Regime Scanner
- Indicateurs
- Version: 1.0
- Activations: 10

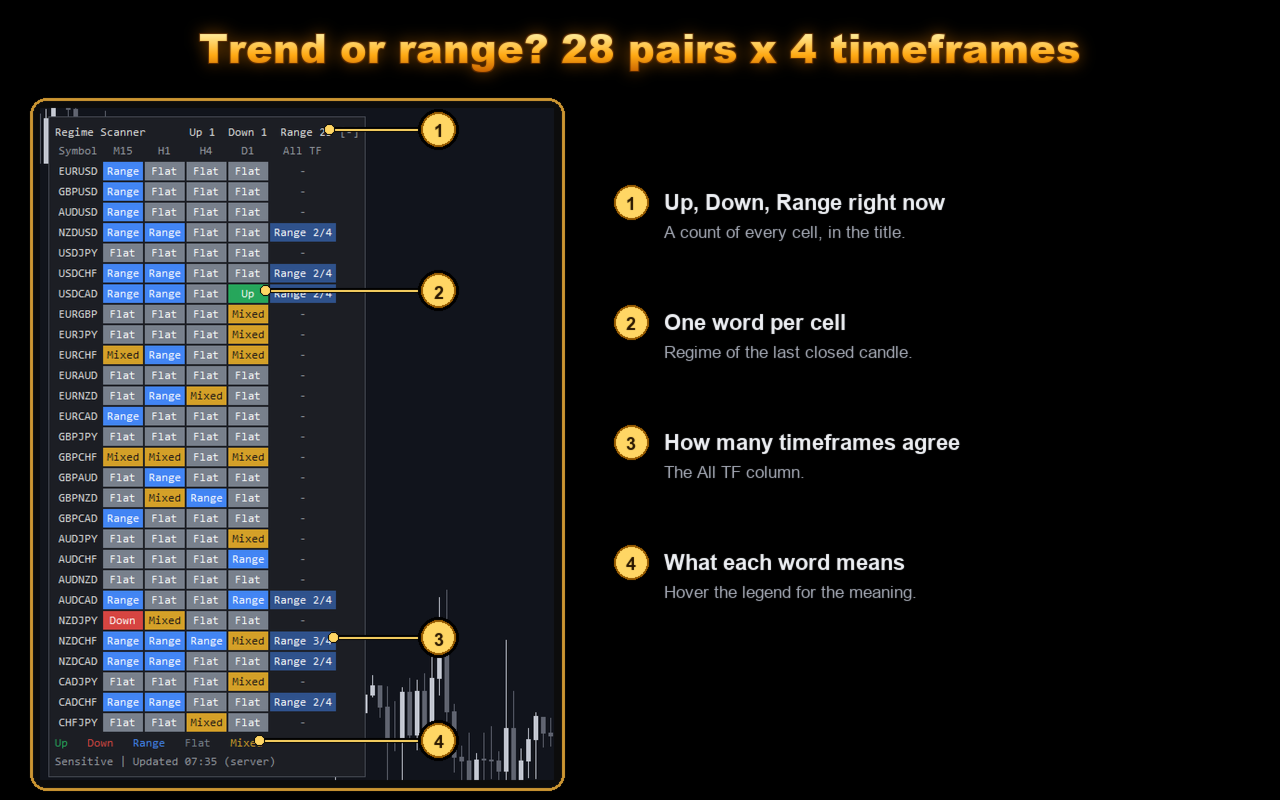
Regime Scanner shows, in one panel, which markets are trending and which are ranging, across many symbols and timeframes.
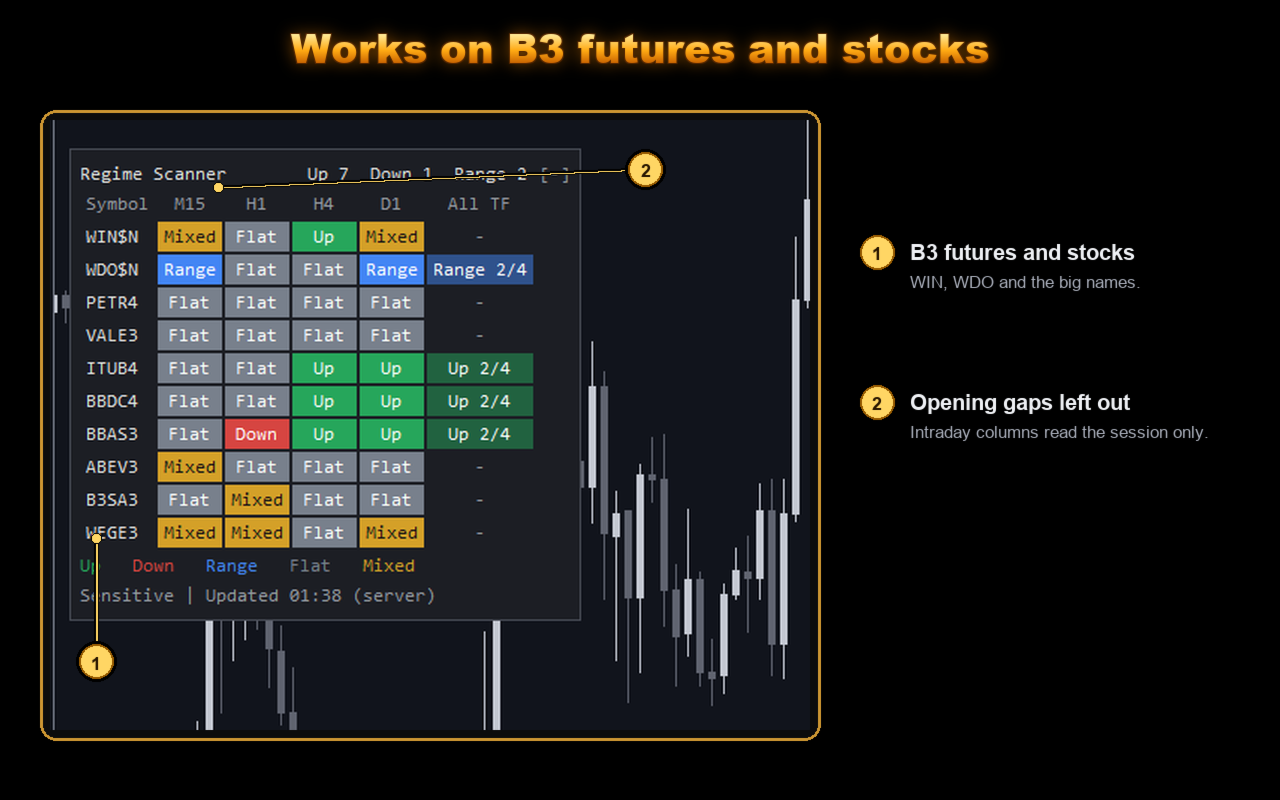
Each cell is one symbol on one timeframe, with one word:
- Up / Down: a trend. Recent moves have tended to continue.
- Range: moves have tended to reverse.
- Flat: no trend and no range.
- Mixed: the measures disagree.
NO REPAINTING
Every cell uses the last closed candle of its timeframe. Once a candle has closed, its result never changes.
HOW IT DECIDES
Each cell looks at the last 256 candles. Three independent measurements of how the price moves must agree before the panel shows Up, Down or Range. A regime needs a little less evidence to stay on than to start, so cells do not flicker.
FEATURES
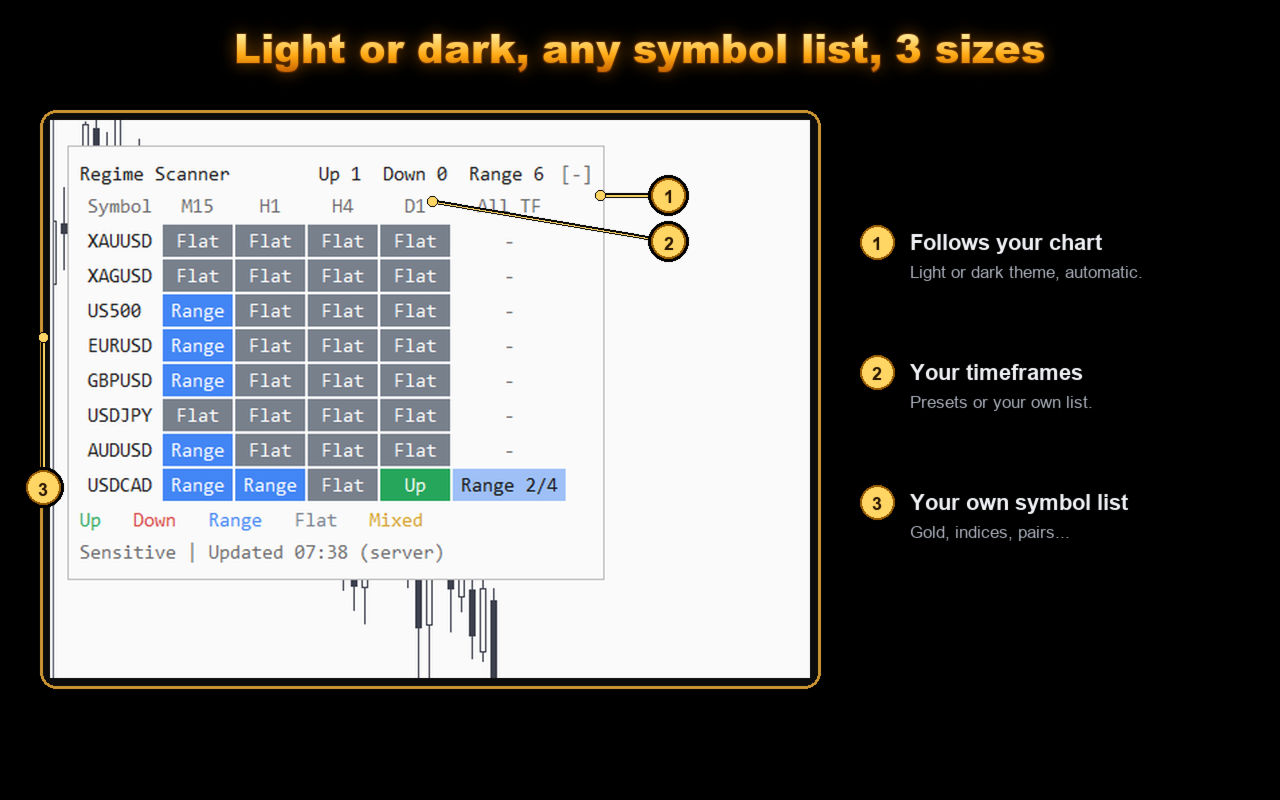
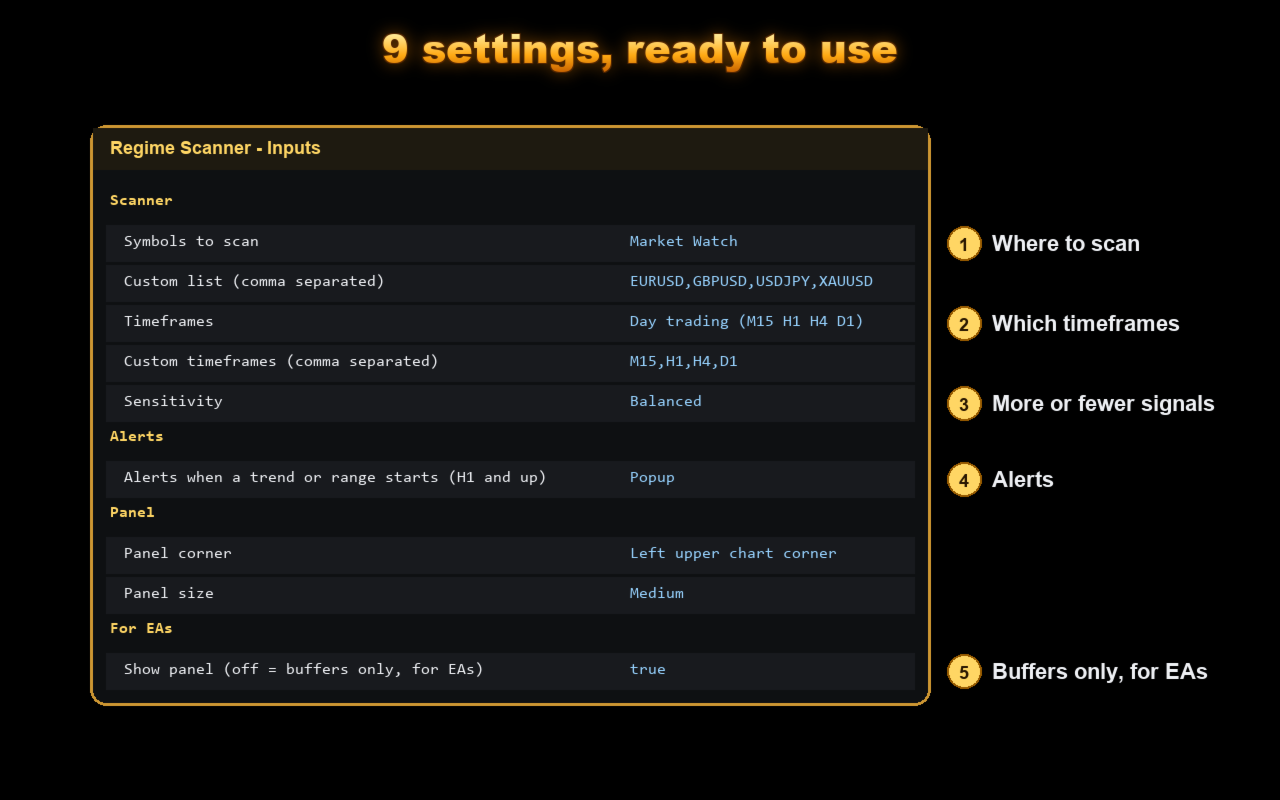
- Symbols: your Market Watch, the 28 Forex pairs (broker suffix detected automatically) or your own list. Up to 30 symbols.
- Timeframes: Intraday (M5 to H4), Day trading (M15 to D1), Swing (H1 to W1) or your own choice.
- Sensitivity: Sensitive, Balanced or Strict.
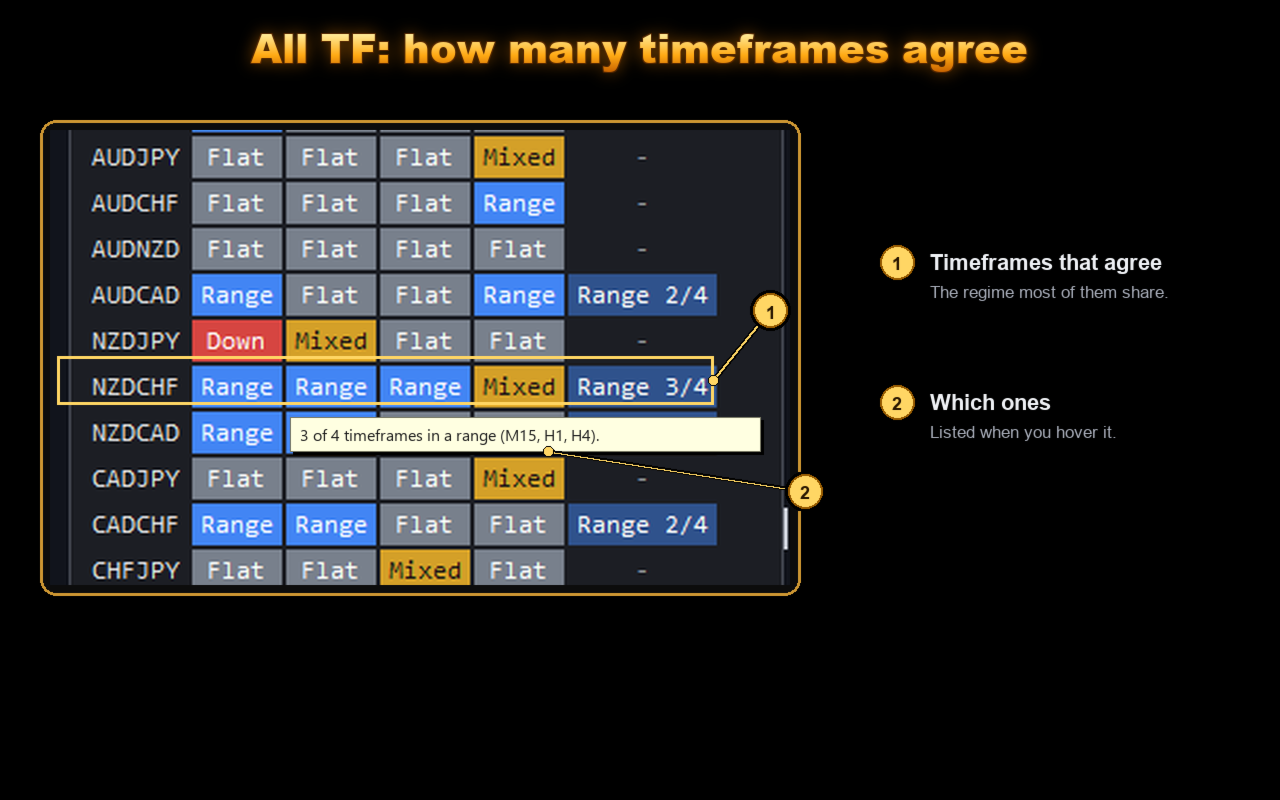
- All TF column: how many timeframes agree.
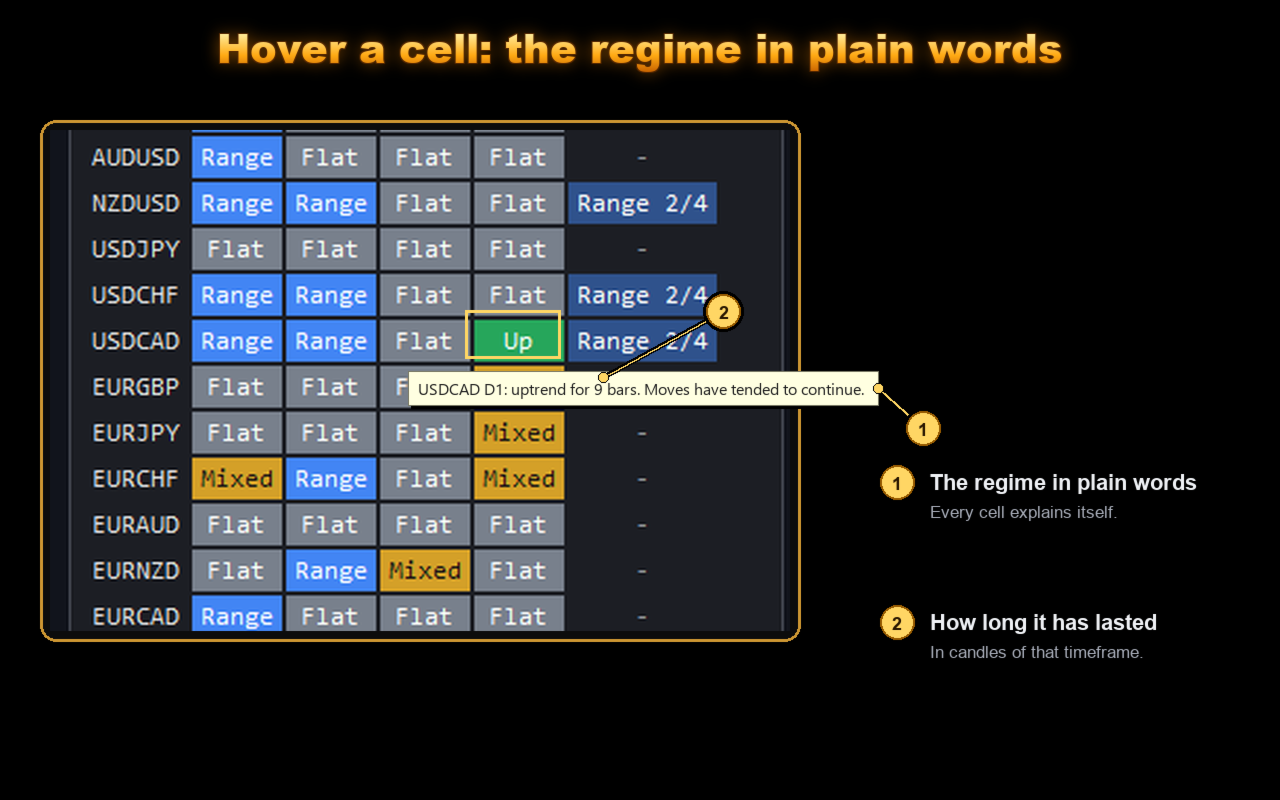
- Hover a cell to read it in plain words: "EURUSD H1: uptrend for 12 bars."
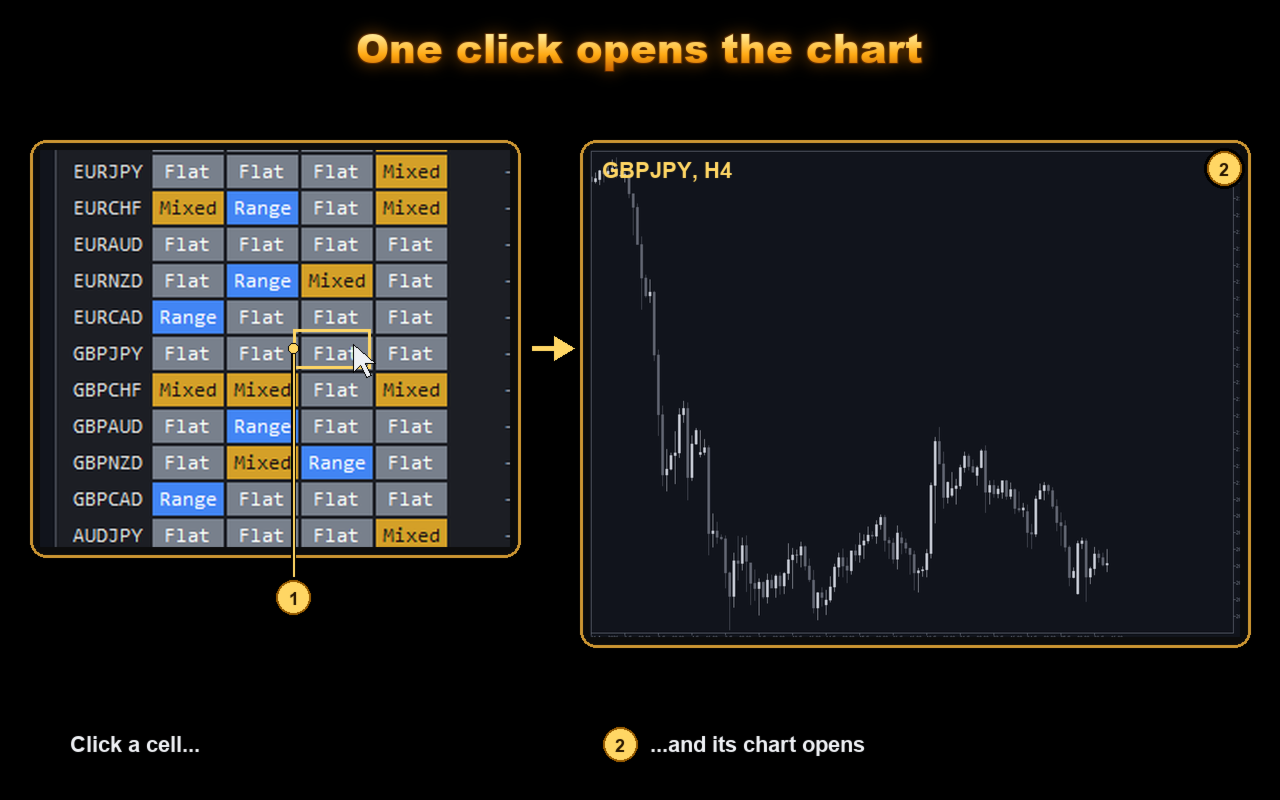
- Click a cell to open that chart.
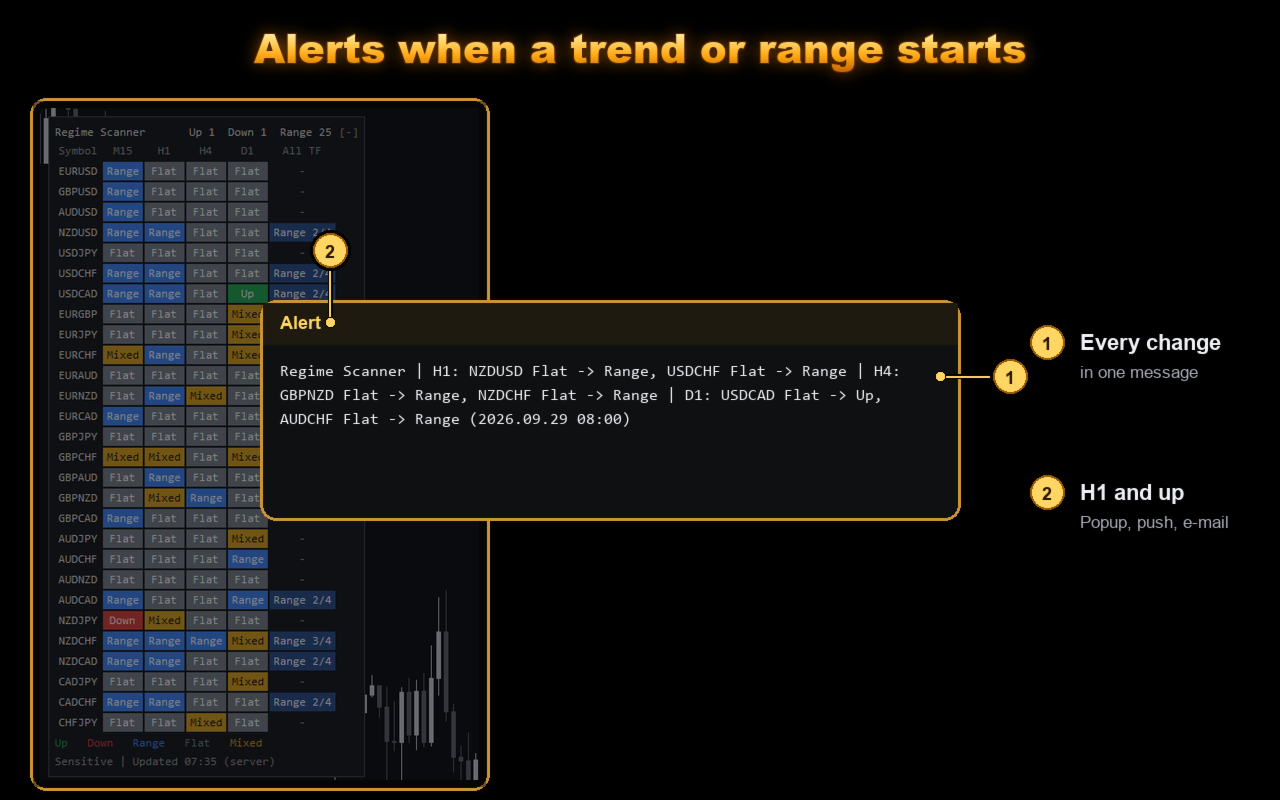
- Alerts when a trend or a range starts, on H1 and higher: popup, push or e-mail, with all changes in one message.
- Light or dark theme, 3 sizes, 4 corners and a minimize button. The panel fits the chart height by itself.
- Forex (hedging) and B3 (netting). Below D1, session gaps are left out.
STRATEGY TESTER
The demo shows the tested symbol and the 7 major pairs. Clicks open charts only in the live terminal.
FOR EA DEVELOPERS
10 buffers for the chart's symbol and timeframe: 0 regime (1 trend, 2 range, 3 flat, 4 mixed), 1 direction (+1 / -1), 2 to 8 the measurements, 9 regime age. Read index 1 (the last closed candle). Set "Show panel" to false for buffers only.
int h = iCustom(_Symbol, PERIOD_H1, "Market\\Regime Scanner",
                "Scanner", 0, "", 1, "", 1,
                "Alerts", 0,
                "Panel", 0, 1,
                "For EAs", false);
TECHNICAL DETAILS
Hurst exponent (R/S, with the Anis-Lloyd-Peters expected value), DFA and the Lo-MacKinlay variance ratio with robust z, on the log returns of closed candles, calibrated by Monte Carlo against a random walk. Sensitivity sets the evidence level at 90%, 95% or 99%.
Risk notice: trading involves substantial risk of loss. Regime Scanner is an analysis tool and does not open trades.