Einstein Pivot Point Pro
- 지표
- 버전: 1.0
- 활성화: 10

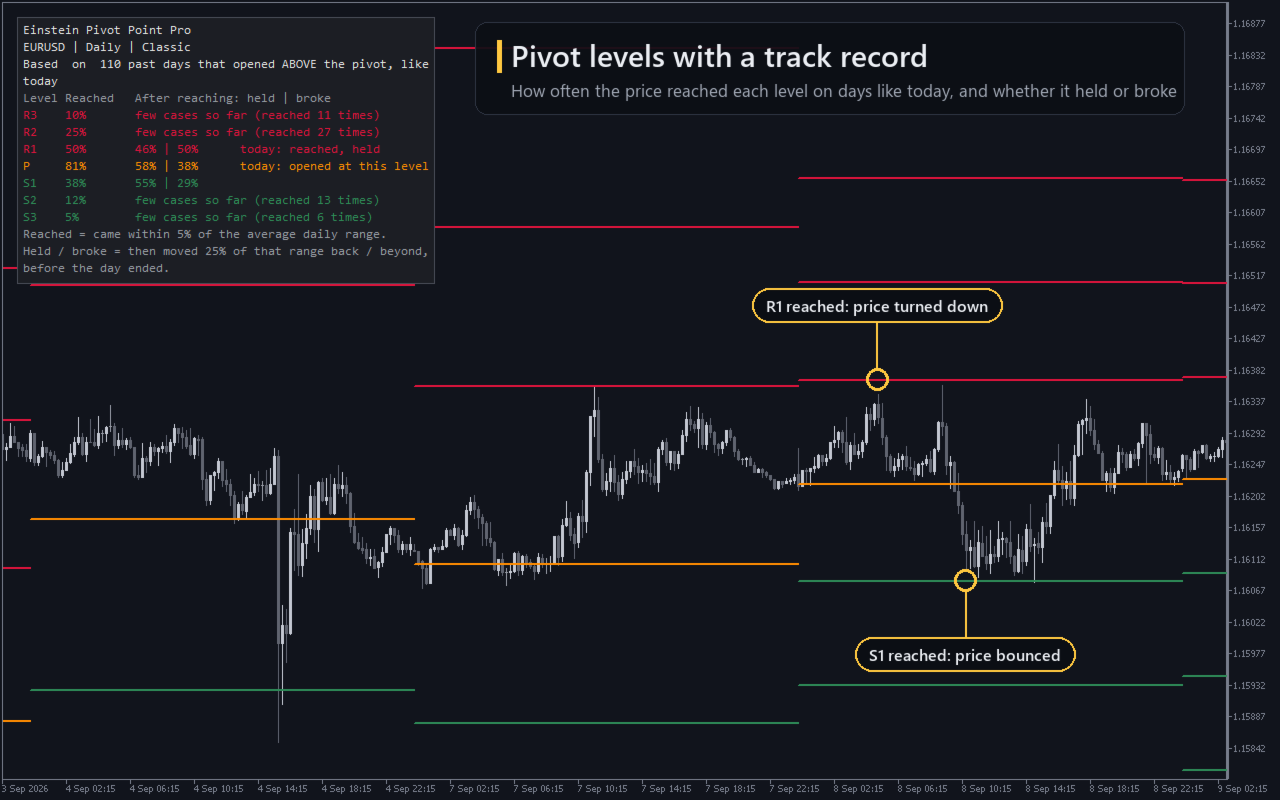
Einstein Pivot Point Pro draws daily, weekly or monthly pivot levels and shows how the price behaved at each level in the past, on days like today.
Most pivot indicators stop at the lines. This one adds a small panel that answers three plain questions for every level:
- Reached: how often did the price get to this level?
- Held: when it got there, how often did it come back?
- Broke: and how often did it go through?
The numbers only count past days that looked like today. By default, "like today" means days that opened on the same side of the pivot: if today opened above P, the panel counts only past days that also opened above P.
HOW TO READ THE PANEL
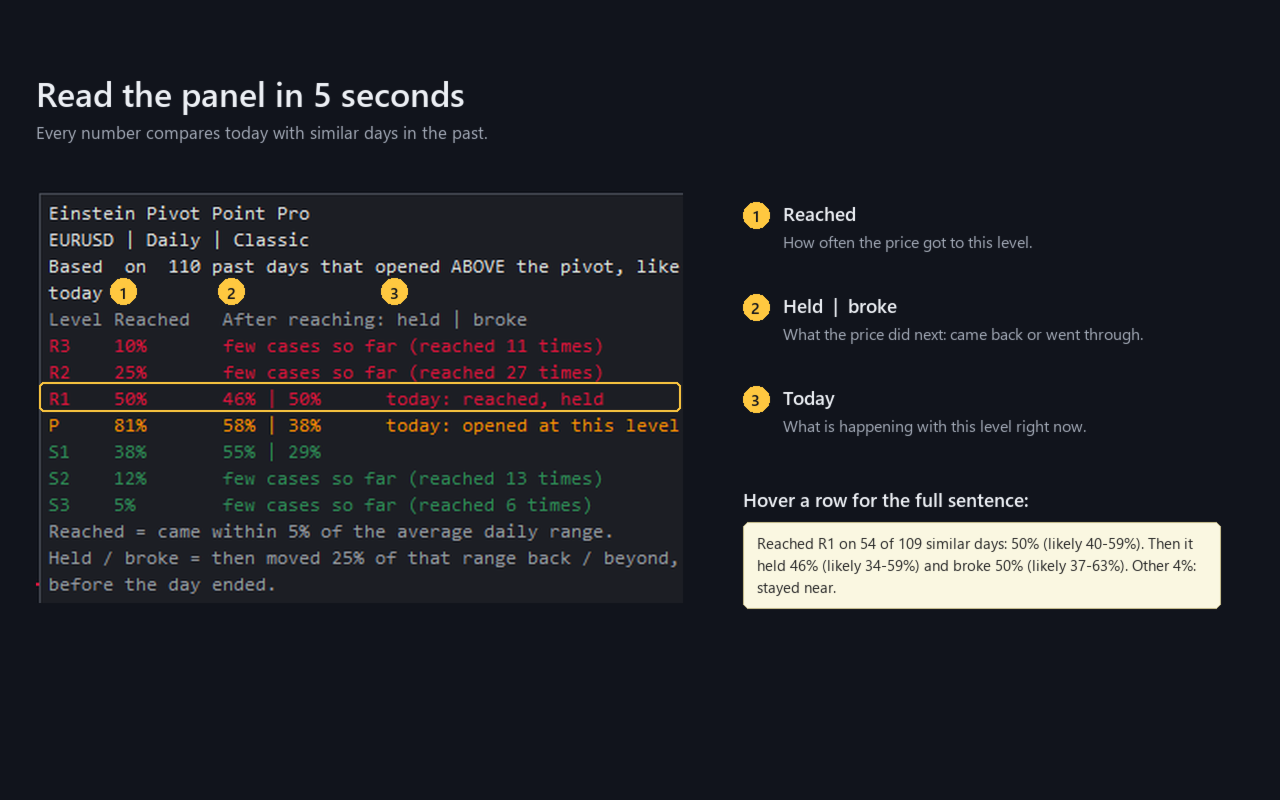
Example taken from a EURUSD chart (the numbers change with the symbol and with each new day):
- Header: "Based on 110 past days that opened ABOVE the pivot, like today"
- Row: R1 | 50% | 46% | 50% | today: reached, held
This row means: on 50% of those 110 days the price reached R1. When it did, it came back 46% of the time and went through 50% of the time (in the other 4%, the price stayed near the level until the end of the day). Today the price has already reached R1 and came back.
- Hover over a row to read it as a sentence, with the likely range of each number, for example "50% (likely 40-59%)".
- When there are too few similar days to trust a percentage, the panel says "few cases so far" instead of showing a number.
- The footer explains the rules in plain words, using the values you set.
- The last column shows what is happening in the current period: reached, reached and held, reached and broke, or opened at this level.
WHAT "REACHED", "HELD" AND "BROKE" MEAN
All distances are measured in the average range of the period (the average daily range, for daily pivots). That is why the same settings work on EURUSD, gold, indices or B3 futures.
- Reached: the price came within 5% of the average daily range of the level.
- Held: after reaching it, the price moved 25% of that range back, before the day ended.
- Broke: after reaching it, the price moved 25% of that range beyond the level, before the day ended.
The first one to happen is the one that counts. The order of events inside the day is read from M15 bars (adjustable), not guessed from a daily candle. If both happen inside the same M15 bar, the day is not counted as held or broke, instead of guessing.
PIVOT FORMULAS
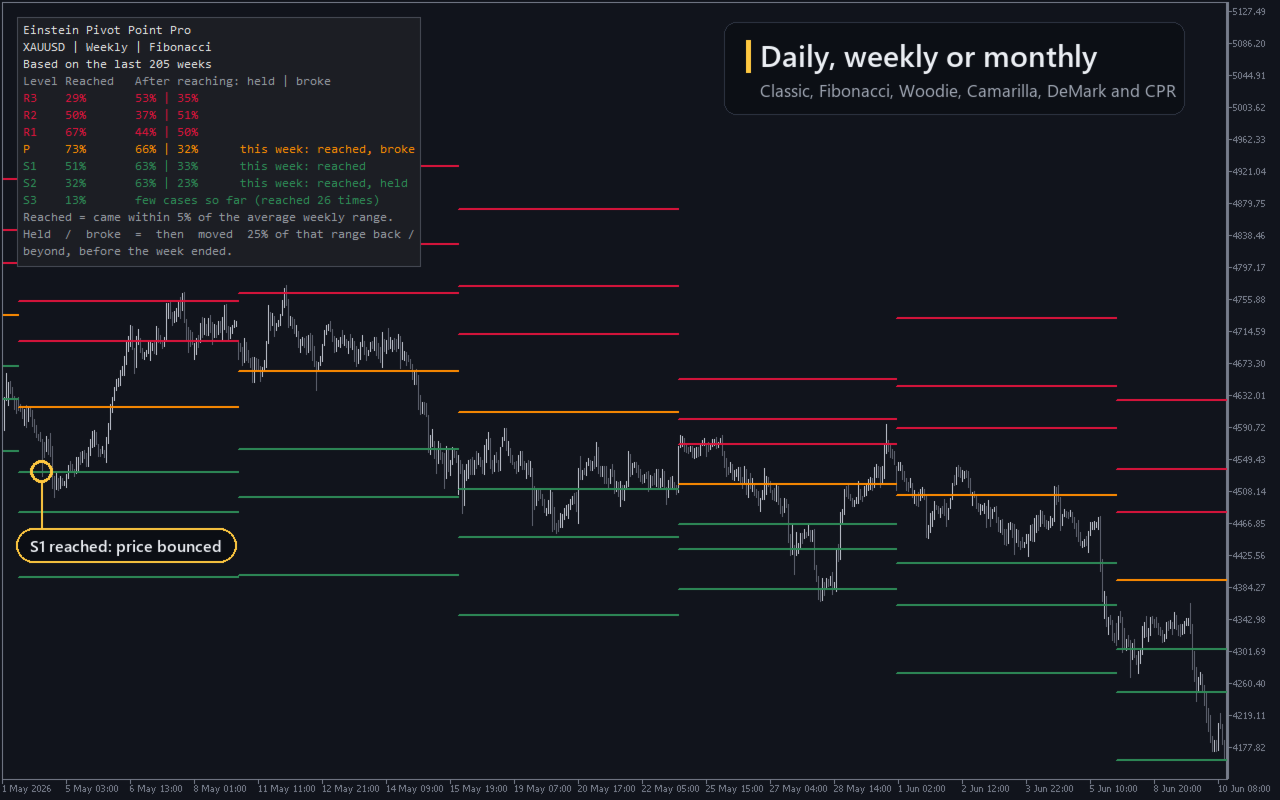
- Classic, Fibonacci, Woodie (with R3 and S3), Camarilla (R1 to R4, S1 to S4) and DeMark.
- Optional CPR lines (TC and BC) on top of any formula, including Camarilla.
- Daily, weekly or monthly pivots. Several instances can run on the same chart, for example daily Classic and weekly Camarilla.
NO REPAINTING
Levels are calculated when each period starts, from the previous closed period, and never change afterwards. In our tests, comparing 355,000 candles in the Strategy Tester, there were 0 differences. The statistics use only closed periods: they stay the same during the period and are updated when a new one starts.
ALERTS
- Alert when a level is touched: popup (on by default), sound, push notification and e-mail.
- At most one alert per level per period.
- Touches that happened before you attached the indicator do not trigger alerts.
- You choose which levels alert: all of them, only resistances and supports, or only the pivot and CPR.
FOREX AND B3
- Works on hedging accounts (Forex) and netting accounts (B3).
- With default settings, the daily open, high, low and close built by the indicator matched the broker's D1 bars on EURUSD, XAUUSD, PETR4 and WIN in our tests.
- Sunday candle: merge into Monday (default), merge into Friday, keep as a separate day, or ignore.
- Configurable day start hour, for brokers whose server day does not match your trading day.
- Optional time window to use only the regular session.
- Opening gaps are handled: a level jumped by the gap is evaluated from the other side, and the gap itself does not count as a touch.
- Weeks follow the calendar, so a Monday holiday does not break the week.
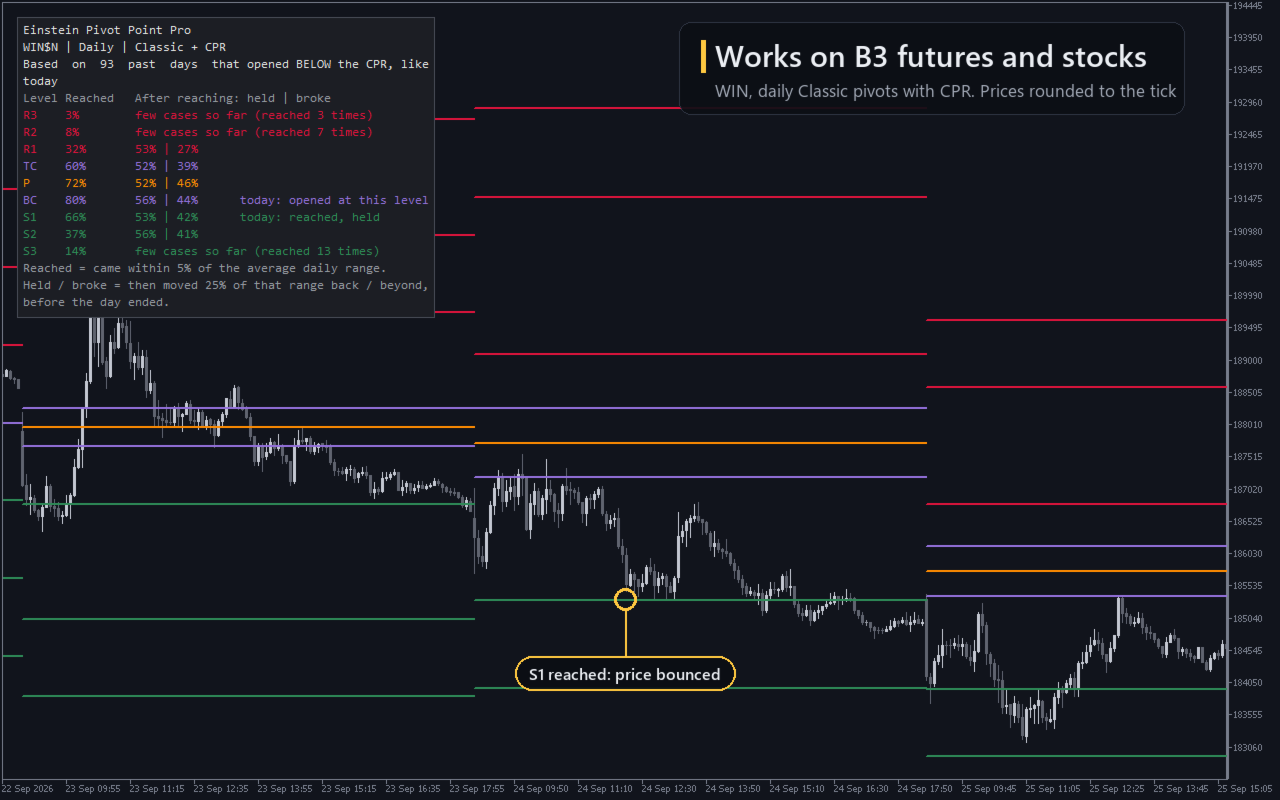
- Label and panel prices are rounded to the symbol's tick (WIN in steps of 5, WDO in steps of 0.5).
FOR EA DEVELOPERS
12 fixed buffers, also shown in the Data Window:
0 P, 1 R1, 2 R2, 3 R3, 4 R4, 5 S1, 6 S2, 7 S3, 8 S4, 9 TC, 10 BC, 11 ATR ref (average range of the period, in price).
- Levels the chosen formula does not have are EMPTY_VALUE (for example R4 and S4 outside Camarilla).
- TC and BC are always calculated, even with the CPR lines hidden.
- Buffer numbers will not change in future versions, and new inputs will only be added at the end of the list.
In iCustom, each input group counts as one parameter: pass the group name before its inputs. From an EA, turn off the panel, the labels and the alerts, otherwise they appear on the EA's chart. Example with default settings:
int handle = iCustom(_Symbol, _Period, "Market\\Einstein Pivot Point Pro",
   "Pivot levels", 0, 0, false,                  // Daily, Classic, CPR lines hidden
   "Sessions", PERIOD_M15, 0, 0, false, "09:00", "18:30",
   "Touch rules", 0.05, 0.25, 0.25, 14,
   "Statistics", true, 250, 1, 30,
   "Alerts", false, 0, true, false, "alert.wav", false, false,   // alerts off
   "Appearance", true, clrDarkOrange, clrCrimson, clrSeaGreen, clrMediumPurple,
   1, STYLE_SOLID, false, true, 8,               // labels off
   "Panel", false);                              // panel off

double r1[];
if(CopyBuffer(handle, 1, 0, 1, r1) == 1 && r1[0] != EMPTY_VALUE)
   Print("R1 now: ", r1[0]);
If the M15 history is not ready when the EA starts, the buffers stay empty until the next tick. Always check for EMPTY_VALUE.
GOOD TO KNOW
- The statistics can only look as far back as the history in your terminal. With the defaults (daily pivots, M15 bars) that is about 4 years of Forex. For weekly and monthly pivots, set "Calculation timeframe" to H1 and raise "Max bars in chart" (Tools > Options > Charts). Monthly samples stay small, and the panel says so.
- Daylight saving time is not adjusted automatically. If your broker's server clock does not follow it, the start of the day shifts by one hour for part of the year; adjust "Day starts at hour" if needed.
- B3: the daily close used is the last trade, not the settlement price. On continuous futures series (such as WIN$ or WIN$N, depending on the broker), the contract roll can shift the levels of the roll day.
- B3 time window: to use only the regular session, turn on "Use only bars inside a time window" and type the session hours of your symbol, in the server time of your broker. B3 changes its trading hours during the year, so check the current hours.
- With Woodie or DeMark, the CPR lines use the classic pivot, so the middle of the CPR can differ from the P drawn. This is expected.
- On a chart timeframe higher than the pivot period (for example daily pivots on W1), no lines are drawn and the panel explains why.
- A day that opens right on a level is left out of that level's statistics and does not alert for it.
- Each instance removes only its own objects. When you run more than one, move one panel (corner or offset) so they do not overlap.
- It loads in a fraction of a second with 100,000 bars.
Risk notice: trading involves substantial risk of loss. Einstein Pivot Point Pro is an analysis tool and does not open trades. Its statistics describe how the price behaved in the past and do not guarantee future results.