CPR Trend Zones
- Indicateurs
-
Minh Truong Pham
 Hello, my name is Pham and I am a programmer and trader! At here, I create amazing forex indicators and expert advisors for Metatrader.
I will try:
+ Provide best tools base on my 5 years experience as a trader and 10 years as a programmer. - Version: 1.0
- Activations: 10
A lot of pivot indicators quietly redraw the levels you already traded. They build today's central pivot range from a bar that's still open, so the "support" you bought at 9am has moved by lunch and the screenshot you saved doesn't match the chart any more. CPR Trend Zones takes the range from the last closed day or week, and once a period has started its lines don't move.
It also reads that range for you. At the start of each period it notes which side of the CPR price opened on, draws one level that price shouldn't close beyond by the end of the period, and keeps count of how often that held. An ATR trend stop and RSI supply and demand boxes share the same chart.
Where the usual pivot tools drift
| What pivots are supposed to be | What many pivot indicators do | What CPR Trend Zones does |
|---|---|---|
| Levels from a finished period, fixed until the next one | Recalculate from the current, unfinished bar, so the lines drift during the day | Uses the previous closed D1 or W1 bar only. The lines are set when the period opens and never move |
| A pivot timeframe that fits the chart you're on | Daily pivots on every chart, including H4 where a day is six bars | Picks it from the chart: M1 uses M30, M5 uses H4, M15 and M30 use D1, H1 to D1 use weekly |
| The central range tells you where the day is being accepted | Draws the lines and leaves the reading to you | Notes whether the first bar of the period sat above, below or inside the CPR and draws one level from that |
| Supply and demand is where the market got stretched | Boxes from fractals, or drawn by hand | A box around the bar where an RSI streak beyond 70 or 30 ended, after at least three bars in a row |
| A trend stop only moves in the trend's direction | Recomputed every bar, so it can step backwards | A trailing stop off ATR that ratchets, and flips the trend only on a close through it |
| A level grid should fit the instrument | One fixed step for every symbol | Rounds to a step scaled to the price, so gold and EURUSD both get a usable grid |
The first row is the one that costs money. If a pivot line can move after you've acted on it, the chart you screenshot at lunch isn't the chart you traded from. Here the level on the chart at 09:00 is the level at 17:00, and it's still the level after you reload the chart next week.
What it draws
The CPR. Top and bottom in blue, the central pivot in purple, one set per period with a gap at each new period so days and weeks don't blur into each other. Traditional R1 to R3 and S1 to S3, and Camarilla R1 to R5 and S1 to S5, can be switched on. They're off by default.
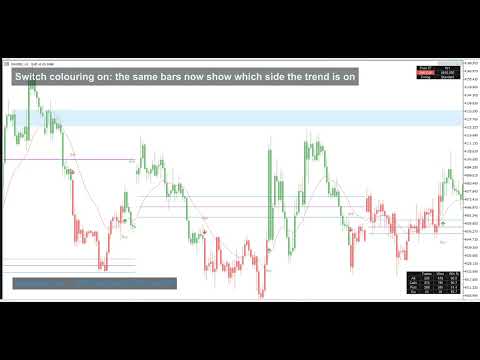
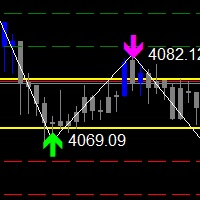
The strike level. A magenta line for the period, worked out on its second bar from where the first bar closed. Above the CPR top, the level sits below price (the panel calls this Sell Put). Below the CPR bottom, it sits above price (Sell Call). Inside the CPR you get a band on both sides (Sell IC). When the period ends it's marked Win or Loss depending on whether the close stayed on the right side.
Trend flips. An ATR trailing stop, one bar of ATR times nine by default. A close through it flips the trend and prints a Buy or Sell arrow. On MT5 the candles can be coloured by trend; that's off by default.
RSI zones. Two RSI sets, 7 and 14. Out of the box only the 14 set draws its supply and demand box. The rest can be switched on, including separate support (oversold) and resistance (overbought) boxes.
An EMA 21 with an optional smoothing line, off by default.
It doesn't place trades or size positions, and it doesn't draw stops or targets for the arrows. The zones don't project into the future. MT4 doesn't colour candles.
The panel
Pivot TF     D1
Sell IC      4350.000
Timing       Optimal (Hedge)
That's the top-right panel from the XAUUSD M15 screenshot. The second row is the current setup and its level. Timing runs from Standard up to Optimal (Hedge) and says how far price has pulled back towards the level. On a Sell Put day, Decent means price has dropped under the CPR top, Good under the central pivot, and Optimal under the CPR bottom.
A second table in the bottom-right corner counts finished periods and how many closed on the right side of their level, split into calls, puts and IC. Read the note on it further down before you trust it.
Alerts
Alerts can fire on a Buy or Sell flip, on a new strike setup, when Timing improves, and when price enters an RSI zone. A guard stops the same message going out twice on one bar, and by default nothing is sent until the bar has closed. MT5 can deliver a terminal alert, email, mobile push, Telegram, or Telegram with a chart screenshot. MT4 has the terminal alert, push and email.
How to read it
| On the chart | Read it as |
|---|---|
| Sell Put in the panel, level below price | The period opened above the CPR. Bias up, with the level as the line not to lose |
| Sell Call, level above price | The mirror of that |
| Sell IC | Opened inside the range. No bias, just the two edges |
| Blue box under price | The last place an oversold run ran out |
Long: Sell Put in the panel, then wait for Timing to reach Good or better, which means price has pulled back to the central pivot or under it. A Buy flip or a demand box in that area gives the entry, and a close under the strike level is where the idea is wrong. Short is the same thing turned over.
Skip it on a Sell IC day with a wide CPR. That's a range with no edge on either side, and trend flips inside it mostly whipsaw.
What it can't do
The trend stop reacts to single bars. With the default one-bar ATR, a quiet bar pulls the stop in close and a news candle throws it far out, so a choppy session flips back and forth and a spike can leave the stop a long way from price. Raise the ATR period if that's too twitchy.
The level grid is coarse on forex. On EURUSD the step is 0.05, so the level often lands a few hundred pips from price, and on gold it's 50 dollars. That's why most periods close on the right side of it, and why the Win % column in the results table looks flattering. It counts periods that stayed on the safe side of a level that sits well away from price. It isn't a hit rate for the arrows, and I'd read it as how often the bias held, nothing more.
Days follow your broker's server time, so a broker on a different clock gets different daily CPRs. On a symbol you haven't opened before, the chart can sit empty for a second or two while the D1 or W1 history loads. It fills itself in, no reload needed.
Honestly, the slow part wasn't drawing it, it was checking it. I wrote the calculation three separate ways and ran them against each other on 32 random data sets until 1,318 flips and 3,086 period setups agreed bar for bar.
Questions you'll have
Does it repaint? The CPR, the strike level and the score don't. They come from the previous closed D1 or W1 bar and are stored per bar. The trend arrows can change while a bar is still open, like any trailing stop, which is why alerts wait for the close by default.
MT4 or MT5? Same logic bar for bar, same defaults. MT4 doesn't colour candles and has no Telegram alerts.
Best settings? Leave the pivot timeframe on Auto and start on M15 for daily CPR or H1 for weekly. On forex, set the spread to Manual in points if you want the level closer to price.
What do Sell Put, Sell Call and Sell IC mean on a forex chart? They're names for where the period opened against the CPR: above it, below it, or inside it. Nothing to do with trading options. The level is the line that bias shouldn't lose.
Why does the panel say No Trade? Usually the pivot history is still loading on a fresh chart, and it fills in within seconds. If it stays that way, the first bar of the period closed exactly on a CPR edge, which gives no side.
Can an EA read it? Yes. On MT5, buffer 42 holds +1 or -1 on a flip bar, 41 the trend direction, 10 to 12 the CPR, 57 the strike level and 56 the direction (1 put, 2 call, 3 IC). On MT4 the same values are in 37, 36, 5 to 7, 52 and 51.
Support
Message me on MQL5 with a screenshot of the chart plus symbol and timeframe. That's normally enough for me to tell you what you're looking at. Updates are free.
Analysis tool. It places no trades and makes no profitability claim. Past price behaviour is not a guide to future price behaviour.