TradingSession Canvas
- Indicateurs
-
Zhang Yi
 I'm have 12 years experience in foreign exchange trading and 12 years EA programming
 - Version: 1.0
- Activations: 10
1. What Is It?
----------------------------------------------------------------
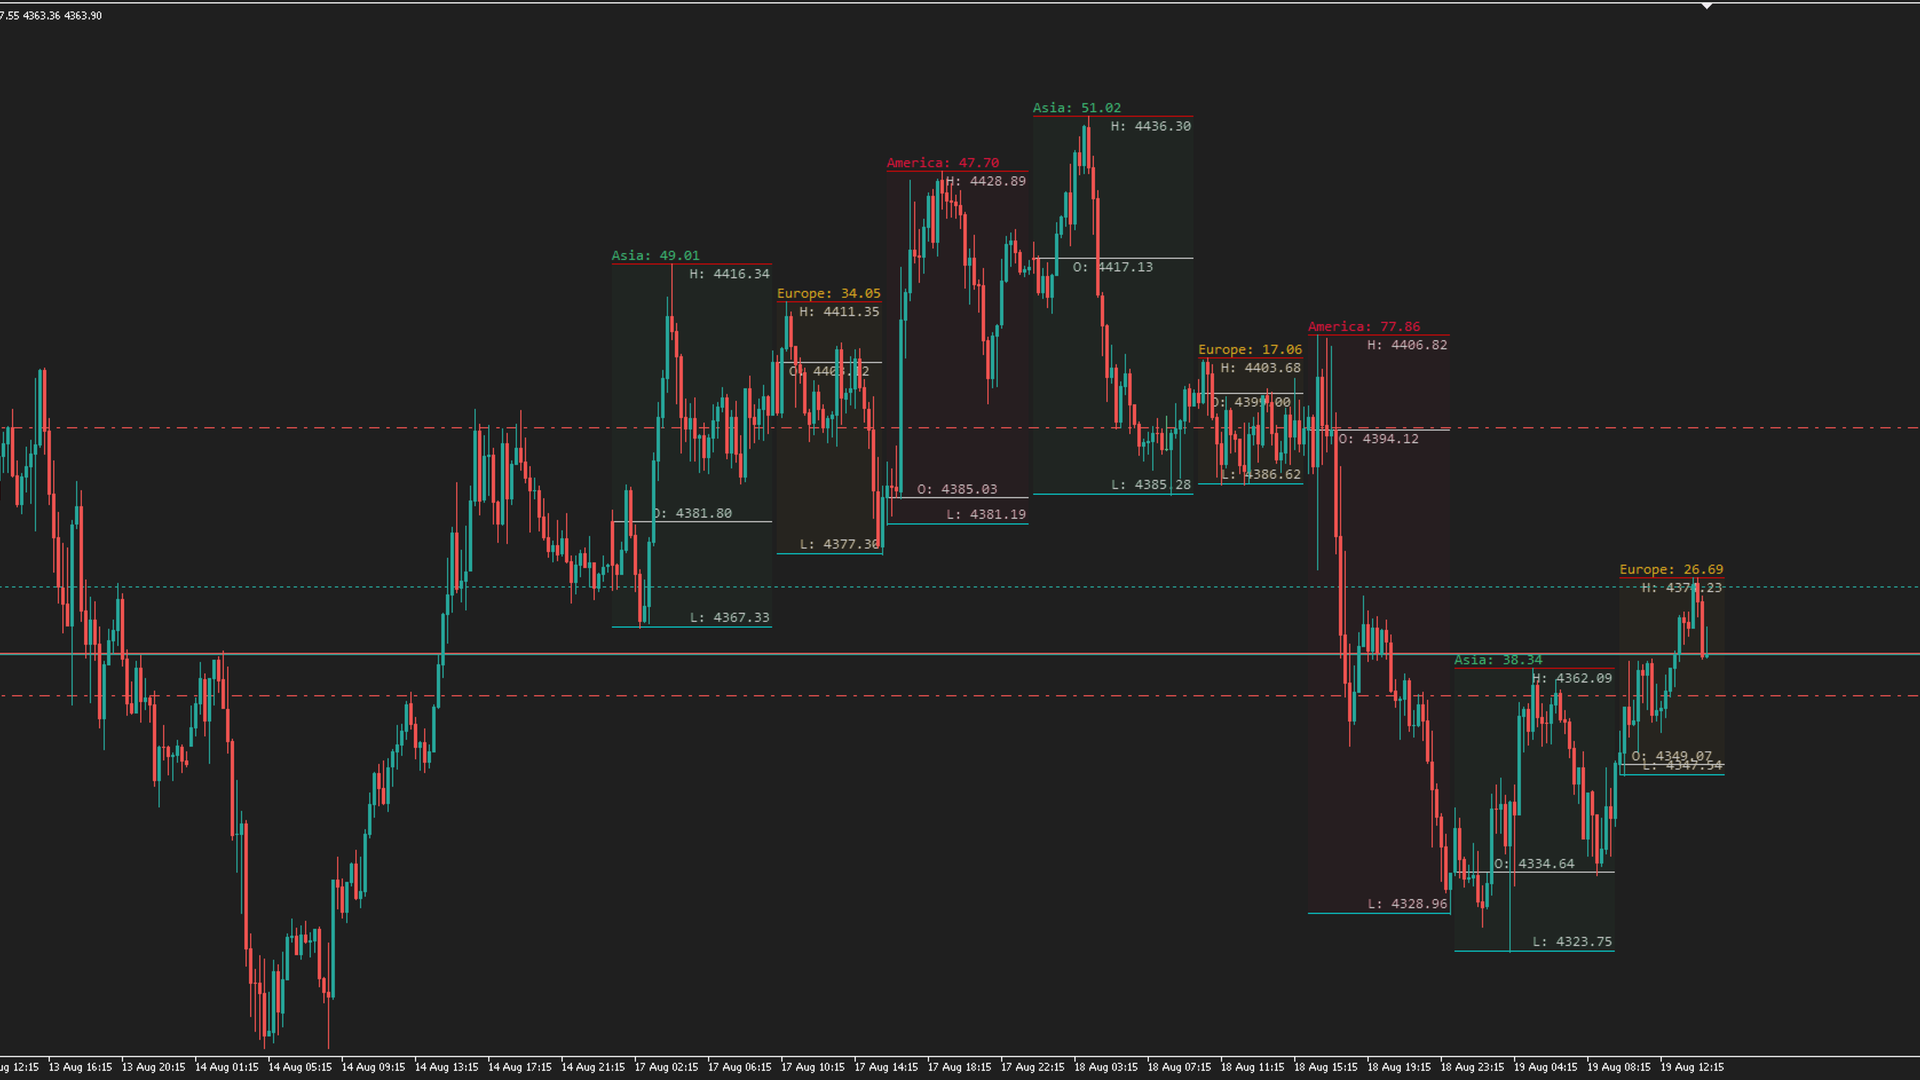
TradingSession Canvas is a display-only chart indicator that marks
the three main trading sessions of every day as semi-transparent
colored blocks on the chart:
1. Asia session (default start 01:00)
2. Europe session (default start 10:00)
3. America session (default start 16:00)
Each session is drawn on its own canvas (CCanvas):
- A semi-transparent block fills the session's time and price range;
- The session High is drawn as a red horizontal line;
- The session Open is drawn as a white horizontal line;
- The session Low is drawn as a cyan horizontal line;
- White price labels H:/O:/L: are placed next to each line;
- A "SessionName: High-Low" range label is shown at the top-left.
NOTE: This indicator is purely visual. It performs no trading
operations, never opens/closes positions or modifies orders, and
therefore does not require Algo Trading to be enabled.
----------------------------------------------------------------
2. Installation & Attachment
----------------------------------------------------------------
1. Put TradingSession Canvas.mq5 into the folder:
MQL5\Indicators\AI\
2. Open it in MetaEditor and compile it (or use the compiled ex5).
3. In MetaTrader 5, open "Navigator -> Custom Indicators -> AI",
find "TradingSession Canvas" and drag it onto any chart.
4. Alternatively, double-click the indicator, adjust parameters in
the dialog and press OK.
It works on any symbol and any timeframe (lower timeframes usually
look better because the blocks adapt to the chart zoom).
----------------------------------------------------------------
3. On-Screen Elements
----------------------------------------------------------------
After loading, the following elements appear on the chart:
1. Session blocks (semi-transparent)
- Asia block (default MediumSeaGreen)
- Europe block (default Goldenrod)
- America block (default Crimson)
Block top = session High, bottom = session Low,
left edge = session start time, right edge = session end time.
2. Three horizontal level lines (fixed colors)
- Red line = session High (highest price)
- White line = session Open (open of the first bar)
- Cyan line = session Low (lowest price)
3. Price labels (white, Consolas monospace font)
- H: xxx right-aligned, below the High line
- O: xxx centered, on the larger gap side of the Open line
- L: xxx right-aligned, above the Low line
4. Range label (top-left corner, colored as the session)
- Format: Asia: 12.34 / Europe: 8.90 / America: 15.67
- Shows the High-Low difference of the session
- Font size adjusts automatically with the chart zoom
----------------------------------------------------------------
4. How to Use
----------------------------------------------------------------
No interaction is required; the indicator runs automatically:
1. On load it immediately draws the last N days (default 3),
current day first, older days behind.
2. When you zoom or scroll the chart, the blocks re-sync
automatically with the new scale.
3. When a new day starts, all blocks are rebuilt.
4. Intraday High/Low changes refresh the current day's blocks.
To change the display, right-click the chart -> "Indicator List",
double-click this indicator, edit the parameters and press OK
(see section 5).
----------------------------------------------------------------
5. Parameters
----------------------------------------------------------------
There are 8 input parameters, grouped as follows:
[Show day]
InpShowDays = 3
Number of days to show. Draws session blocks for the last N
days, counting back from today.
[Setting session]
InpAsiaStartHour = 1 (Asia session opening hour)
Start hour of the Asia session (server time). Must satisfy
Asia < Europe < America.
InpAsiaSession = clrMediumSeaGreen (Asian session)
Color of the Asia block and its range label.
InpEuropeStartHour = 10 (European session opening hour)
Start hour of the Europe session.
InpEuropeSession = clrGoldenrod (European session)
Color of the Europe block and its range label.
InpAmericaStartHour = 16 (American session opening hour)
Start hour of the America session. Must not exceed 24.
InpAmericaSession = clrCrimson (American session)
Color of the America block and its range label.
[Transparency]
InpTransparency = 10 (Rectangle Transparency 0~255)
Fill transparency of the blocks. 0 = fully opaque,
255 = fully transparent. Smaller values make blocks more
vivid, larger values make them fainter and less intrusive.
Validation rule: Asia < Europe < America and America <= 24.
Otherwise the indicator refuses to load with a parameter error.
----------------------------------------------------------------
6. Interaction Details & Runtime Rules
----------------------------------------------------------------
1. Independent canvases
Each session block uses its own OBJ_BITMAP canvas anchored at
(session start time, session High). Object names carry the
program-name prefix, so the indicator can coexist on the same
chart with other canvas indicators (e.g. SLTP_Zones_Canvas).
2. Z-order
Block canvases use ZORDER = -100 (above the candles, below all
GUI windows) and OBJPROP_BACK = true, so they never hide
market data.
3. Automatic repaint triggers
- First load / new day: full rebuild of all blocks;
- A session of the current day just started but has no data
yet: hourly retry until blocks are built;
- Intraday High/Low changes: refresh current-day data and repaint;
- Chart zoom/scroll (CHARTEVENT_CHART_CHANGE): repaint all.
4. Missing data handling
If a day or a session has no market data (holiday, not yet
opened), its block is skipped silently - no drawing, no errors.
5. Dynamic font size
Price label font = -80 - chart_scale * 10 (follows the zoom),
range label font = 8 + chart_scale. Both adapt to the zoom.
----------------------------------------------------------------
7. Notes & FAQ
----------------------------------------------------------------
1. This is a display-only indicator: no trading functions and no
order modification. For visual SL/TP dragging of positions,
use the SLTP_Zones_Canvas EA (Experts\AI folder).
2. Session hours use server time. Adjust the Asia/Europe/America
start hours to match your broker's server timezone so the
blocks align with the real trading sessions (e.g. for a
UTC+2 server, tune the hours accordingly).
3. With invalid parameters (Asia >= Europe, Europe >= America or
America > 24) the indicator fails to load and prints:
Error: session hours must be Asia < Europe < America
4. Block width depends on the chart zoom: the more you zoom out,
the narrower the blocks. This is normal canvas behavior that
follows the chart coordinates.
5. If blocks do not appear, check:
- that the indicator compiled and loaded successfully;
- that price data exists for the dates on this symbol/timeframe;
- chart states such as "Show data of the day" settings.
6. When the indicator is removed, all block objects are cleaned
up automatically - no leftovers remain.
----------------------------------------------------------------
8. Feature Checklist
----------------------------------------------------------------
[x] Semi-transparent session blocks: Asia / Europe / America
[x] Session High red line + H: price label
[x] Session Open white line + O: price label
[x] Session Low cyan line + L: price label
[x] Top-left "SessionName: High-Low" range label (zoom-aware)
[x] Last N days support (default 3, current day first)
[x] Auto repaint on chart zoom / scroll
[x] Auto rebuild on new day, auto refresh on intraday High/Low
[x] Parameter validation (Asia < Europe < America, America <= 24)
[x] Independent canvases, coexists with other indicators
[x] Display only - no trading, no Algo Trading required