VBC Indicator
- Indicateurs
- Version: 1.8
- Mise à jour: 14 juillet 2026
- Activations: 5

VBC Indicator — Volatile Breakout Confirmation for Gold (XAU/USD)
Version: 1.8
Stop guessing reversals. Let strong-candle exhaustion tell you where Gold is likely to turn.
VBC Indicator is a price-action tool for MetaTrader 5, built around Gold's sharp, fast, exhaustion-then-reversal price behavior. It automatically detects exhausted directional moves — runs of strong, same-color candles that have pushed far enough, fast enough — and marks the point where a reversal setup is forming. Alongside the entry zone, it plots a suggested stop loss and take profit, and can alert you the moment a signal confirms. No repainting logic, no lagging moving averages, no indicator soup on your chart. Just clean arrows, a "wait" confirmation line, and clear risk levels, drawn directly on the candles that created the signal.
What It Does
- Finds exhaustion moves. The indicator scans for a run of consecutive "strong" candles (bodies above a minimum size you control) that together cover a minimum price range — the kind of sharp, extended push Gold produces regularly, especially around news and session opens. This is the footprint of a move that has likely run too far, too fast.
- Waits for confirmation. A signal only qualifies once an opposite-color candle appears right after the run, and that candle's body is large enough relative to the last candle in the run — filtering out weak, indecisive reversals.
- Marks the trade zone on your chart:
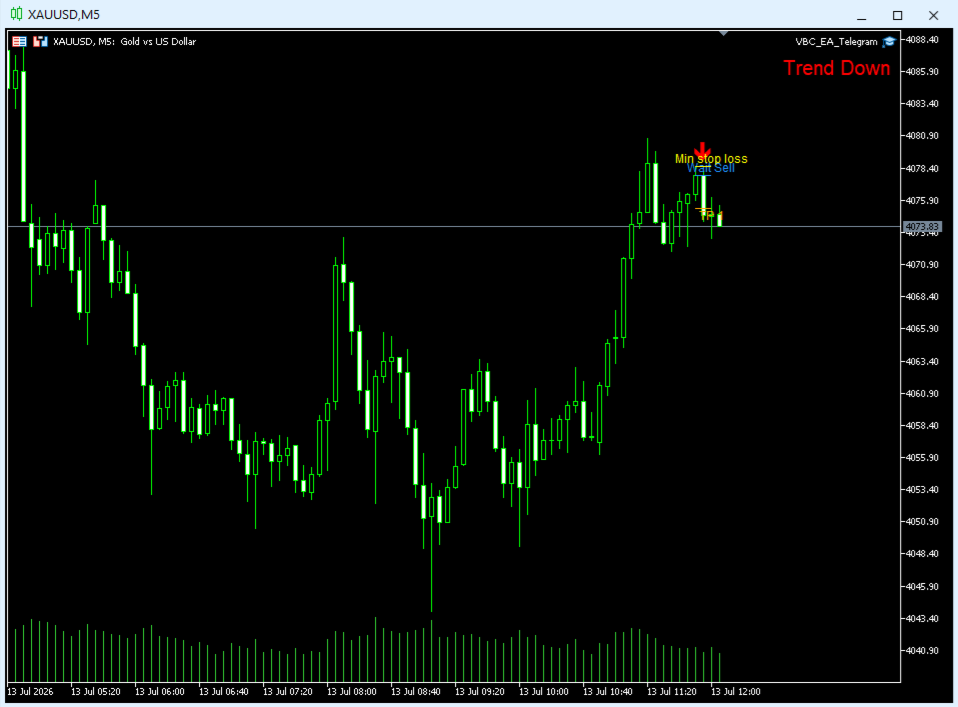
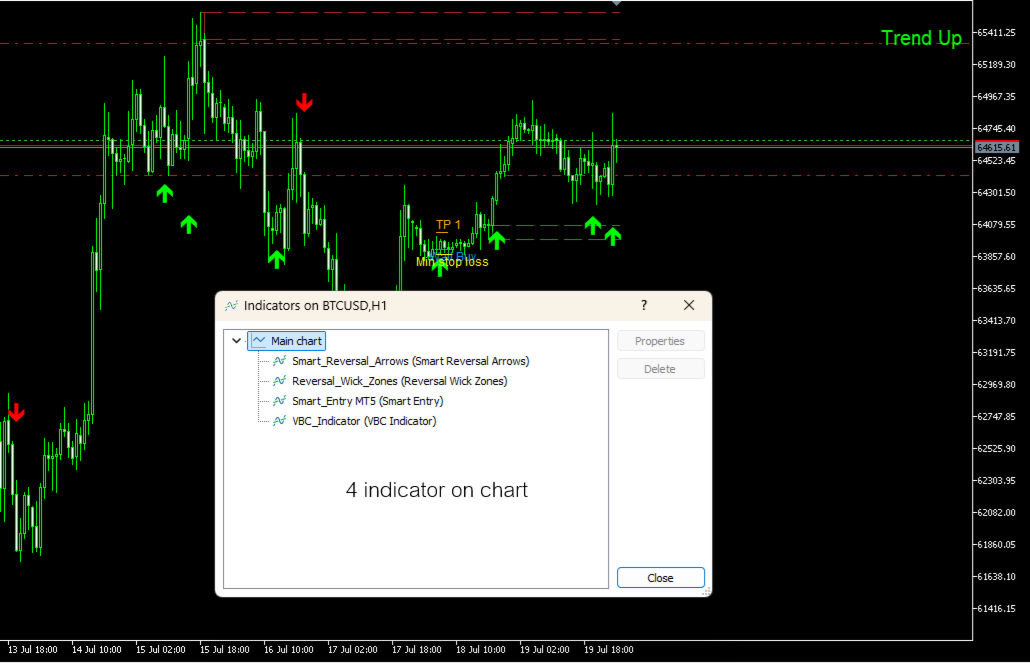
- Arrow — marks the confirmation candle (up arrow for a buy setup, down arrow for a sell setup).
- Wait Buy / Wait Sell line — the reference level at the close of the last candle in the exhausted run. This is your "wait for price to reach here" line.
- Min Stop Loss line — the minimum safe distance for your stop, based on the high/low of the reversal candles. A small buffer can be added on top.
- Take Profit line(s) — the indicator first looks for the most recent Fair Value Gap inside the exhausted run and targets its near edge (TP1) and far edge (TP2). If no qualifying gap exists — or the gap's TP1 would give a worse reward than your stop-loss distance — it automatically falls back to whichever method you've chosen: a Reward:Risk multiple, or a Fibonacci retracement of the full exhausted move (default 50%, fully adjustable). A built-in safety check also guarantees TP1 is never placed closer than your Min Stop Loss distance, switching methods on the fly if it would be.
- Alerts you when it matters. Turn on a popup message, a sound, or both — the indicator notifies you the instant a new signal confirms, so you don't need to watch every candle close.
Every signal is drawn as native chart objects (trendlines, text, arrows) — so it works in your terminal exactly as you see it in this description, and objects update live as new candles close.
New in Version 1.8
- Trend Filter (optional, on/off) — VBC Indicator can now check the trend on a separate, higher timeframe before allowing a signal: BUY setups only fire while that timeframe's trend is up, SELL setups only fire while it's down. Trend is measured with two EMAs (fast/slow, both adjustable), and the timeframe used for the check is fully configurable — independent from the chart you're trading on.
- Sideway Filter (optional, on/off) — an add-on to the Trend Filter that blocks signals when the market is chopping sideways rather than trending, using a fast EMA slope check on the same higher timeframe.
- Live Trend Label — a small label in the corner of the chart shows the current trend state (Up / Down / Sideway) at a glance, color-coded and updating as each higher-timeframe bar closes.
- Self-cleaning signals — if the trend flips after a signal has already been drawn, the indicator automatically removes that signal from the chart so old arrows never linger against the new trend.
- Both filters are fully optional — leave them on for higher-conviction, trend-aligned entries, or turn them off to see every exhaustion/reversal signal the core logic finds, same as in v1.6.
Best Market & Timeframe: Built for Gold
VBC Indicator is tuned specifically for Gold (XAU/USD) and performs exceptionally well across M15, M30, H1, and H4. Higher timeframes generally offer greater accuracy with fewer false signals. Gold's characteristic behavior — sharp, extended directional pushes followed by swift reversals — is exactly the pattern this indicator is designed to catch, which is why the default settings (minimum range, minimum body size, FVG size) are calibrated around Gold's typical point ranges out of the box.
For Gold traders, no adjustment is needed: install it, apply it to XAUUSD, and it's ready to scan.
Also Works on Forex Pairs
The default settings are calibrated for gold's volatility, but the same logic applies to currency pairs (EUR/USD, GBP/USD, etc.) once you scale down two inputs to match forex's smaller average ranges:
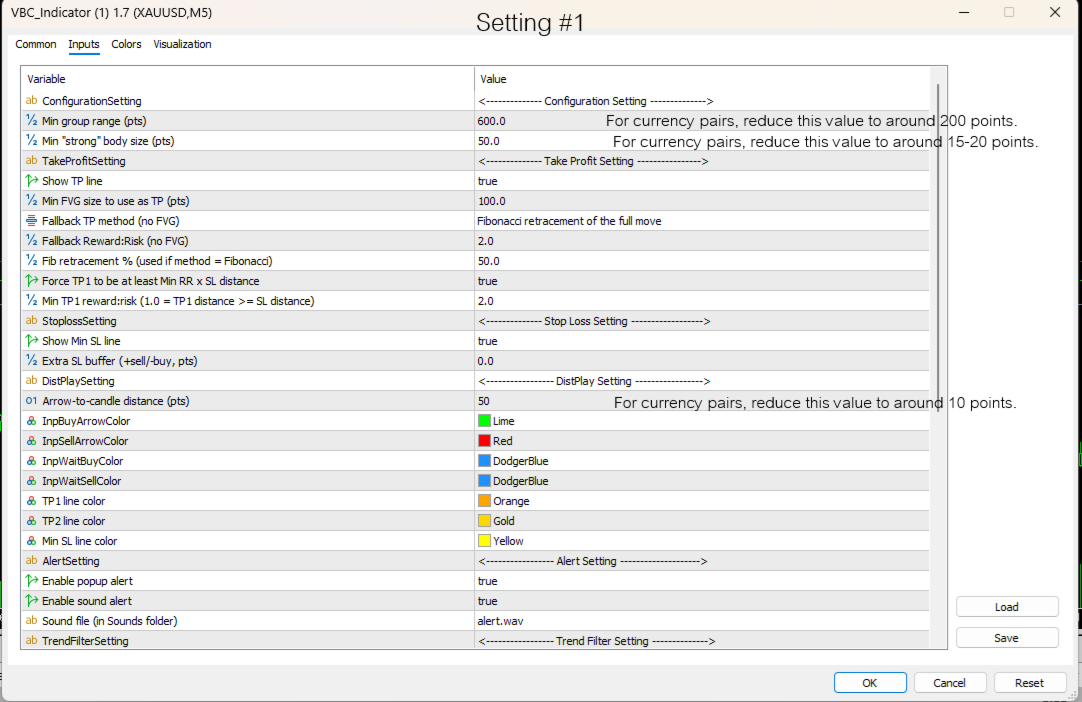
- "Min group range (pts)" — default is 600 for gold; reduce this for forex pairs and adjust to the pair's typical volatility.
- "Min 'strong' body size (pts)" — reduce this as well, so ordinary forex candle bodies can qualify as "strong."
Refining Entries: Higher Timeframe Signal, Lower Timeframe Entry
A signal on a higher timeframe (H1, H4) marks a reliable reversal zone, but the Wait line and Min Stop Loss are still based on that timeframe's candle sizes — waiting for price to reach the zone and then dropping down to a lower timeframe (M5, M15) to time the actual entry is a common way to use VBC Indicator's signals.
How it works in practice:
- Run VBC Indicator on H1 or H4 and let it flag the exhaustion zone with its arrow and Wait line.
- Once price approaches that Wait line, switch down to M5 or M15 (running the indicator there too, or simply watching price action) and look for a smaller-scale confirmation in the same direction — for example, price reacting off the zone, or a smaller version of the same strong-candle exhaustion pattern.
- Enter on the lower timeframe using the higher timeframe's Min Stop Loss and Take Profit levels as your risk reference, or tighten the stop further using the lower timeframe's own structure.
This approach doesn't change how the indicator calculates anything — it's simply a way to use a higher timeframe's zone for direction and bias, while getting a tighter entry price and smaller stop distance from the lower timeframe.
Inputs
- Min group range (pts) — How far the exhausted run must have traveled in total
- Min "strong" body size (pts) — How large a candle's body must be to count as "strong"
- Show TP line — Turns the take-profit target line(s) on or off
- Min FVG size (pts) — Minimum Fair Value Gap size to be used as a TP target
- Fallback TP method — Choose Reward:Risk or Fibonacci retracement for the fallback take-profit (used when no FVG qualifies, or the FVG target fails the min TP:SL check)
- Fallback Reward:Risk — RR ratio used for the TP when the fallback method is Reward:Risk
- Fib retracement % — Retracement % of the full move used for the TP when the fallback method is Fibonacci (default 50%)
- Ensure Min TP:SL ratio — Turns on/off the safety check that stops TP1 from ever being closer than the stop-loss distance
- Min TP:SL ratio — Minimum reward:risk enforced on TP1 when the safety check is on (1.0 = TP1 distance at least equals the SL distance)
- Show Min SL line — Turns the suggested stop loss line on or off
- Extra SL buffer (pts) — Adds a safety margin beyond the calculated minimum stop
- Arrow-to-candle distance / colors — Customize the look of buy/sell arrows and lines
- Enable popup alert — Pops up a message the instant a new signal confirms
- Enable sound alert — Plays a sound the instant a new signal confirms
- Alert sound file — Choose which sound file plays on alert
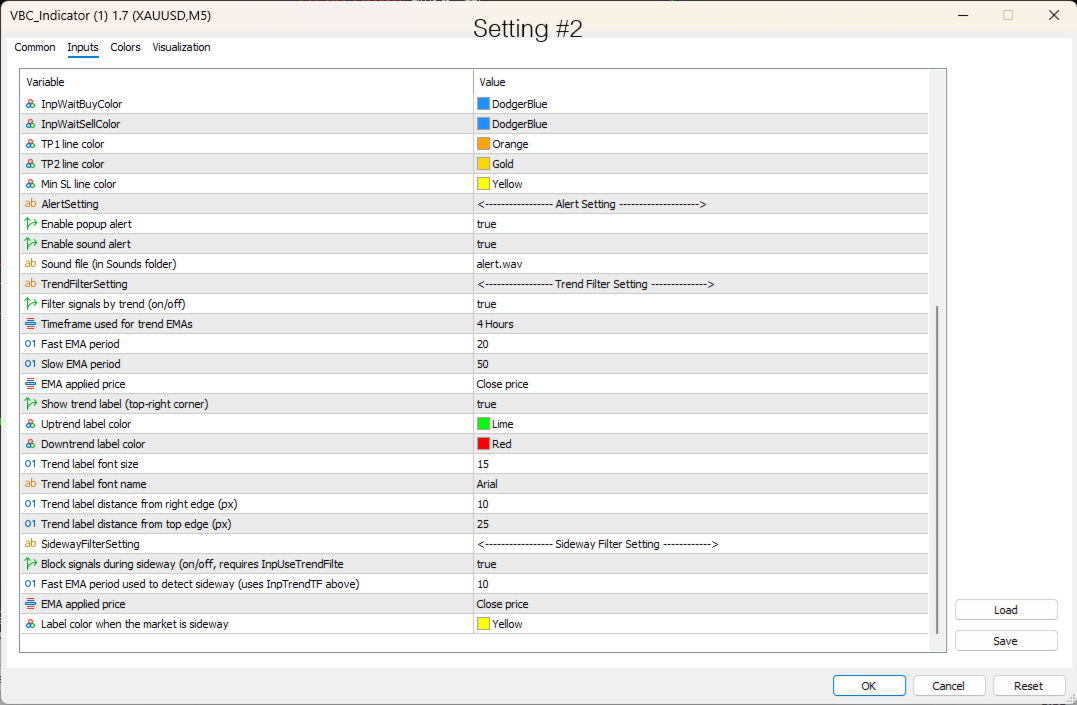
- Filter signals by trend (on/off) — master switch for the Trend Filter
- Timeframe used for trend EMAs — which timeframe the trend check runs on (independent of chart timeframe)
- Fast EMA period / Slow EMA period / EMA applied price — controls for the trend EMAs
- Show trend label (on/off) — toggles the on-chart trend label
- Uptrend / Downtrend label color, font size, font name, label position — appearance settings for the trend label
- Block signals during sideway (on/off) — master switch for the Sideway Filter (requires Trend Filter to be on)
- Fast EMA period used to detect sideway — sensitivity of the sideway check
(Some fine-tuning inputs used internally for signal detection are hidden from the settings panel to keep it simple — the inputs above are the ones you'll actually use day to day.)
How Traders Use It
- Objective entries. No more eyeballing "does this look exhausted yet?" The indicator quantifies it.
- Built-in patience. The Wait line stops you from jumping in on the confirmation candle itself; it marks the level to wait for.
- Risk mapped out for you. Gold can move fast once a reversal starts — the stop loss and take profit levels are drawn the moment a signal confirms, so you can size the trade before price gets there.
- You don't have to watch the chart. Gold setups can form during volatile news windows or session opens when you're not staring at the screen — with alerts on, you'll know the moment a setup completes.
- Works alongside your own system. VBC Indicator flags high-probability reversal zones on Gold (and, with adjusted settings, forex pairs); you still apply your own risk management and trade management on top.
VBC Indicator is an analytical tool, not an automated trading system. It does not place trades, guarantee profits, or replace sound risk management. Always test on a demo account before live use.