Mattrix Basket Viewer
- Utilitaires
-
MATTRIX 8x
 Developer of the MATTRIX 8x Currency Strength System — a multi-timeframe framework analyzing all 28 major forex pairs across 8 currencies.
 - Version: 1.12
- Mise à jour: 25 septembre 2026
Mattrix Basket Viewer
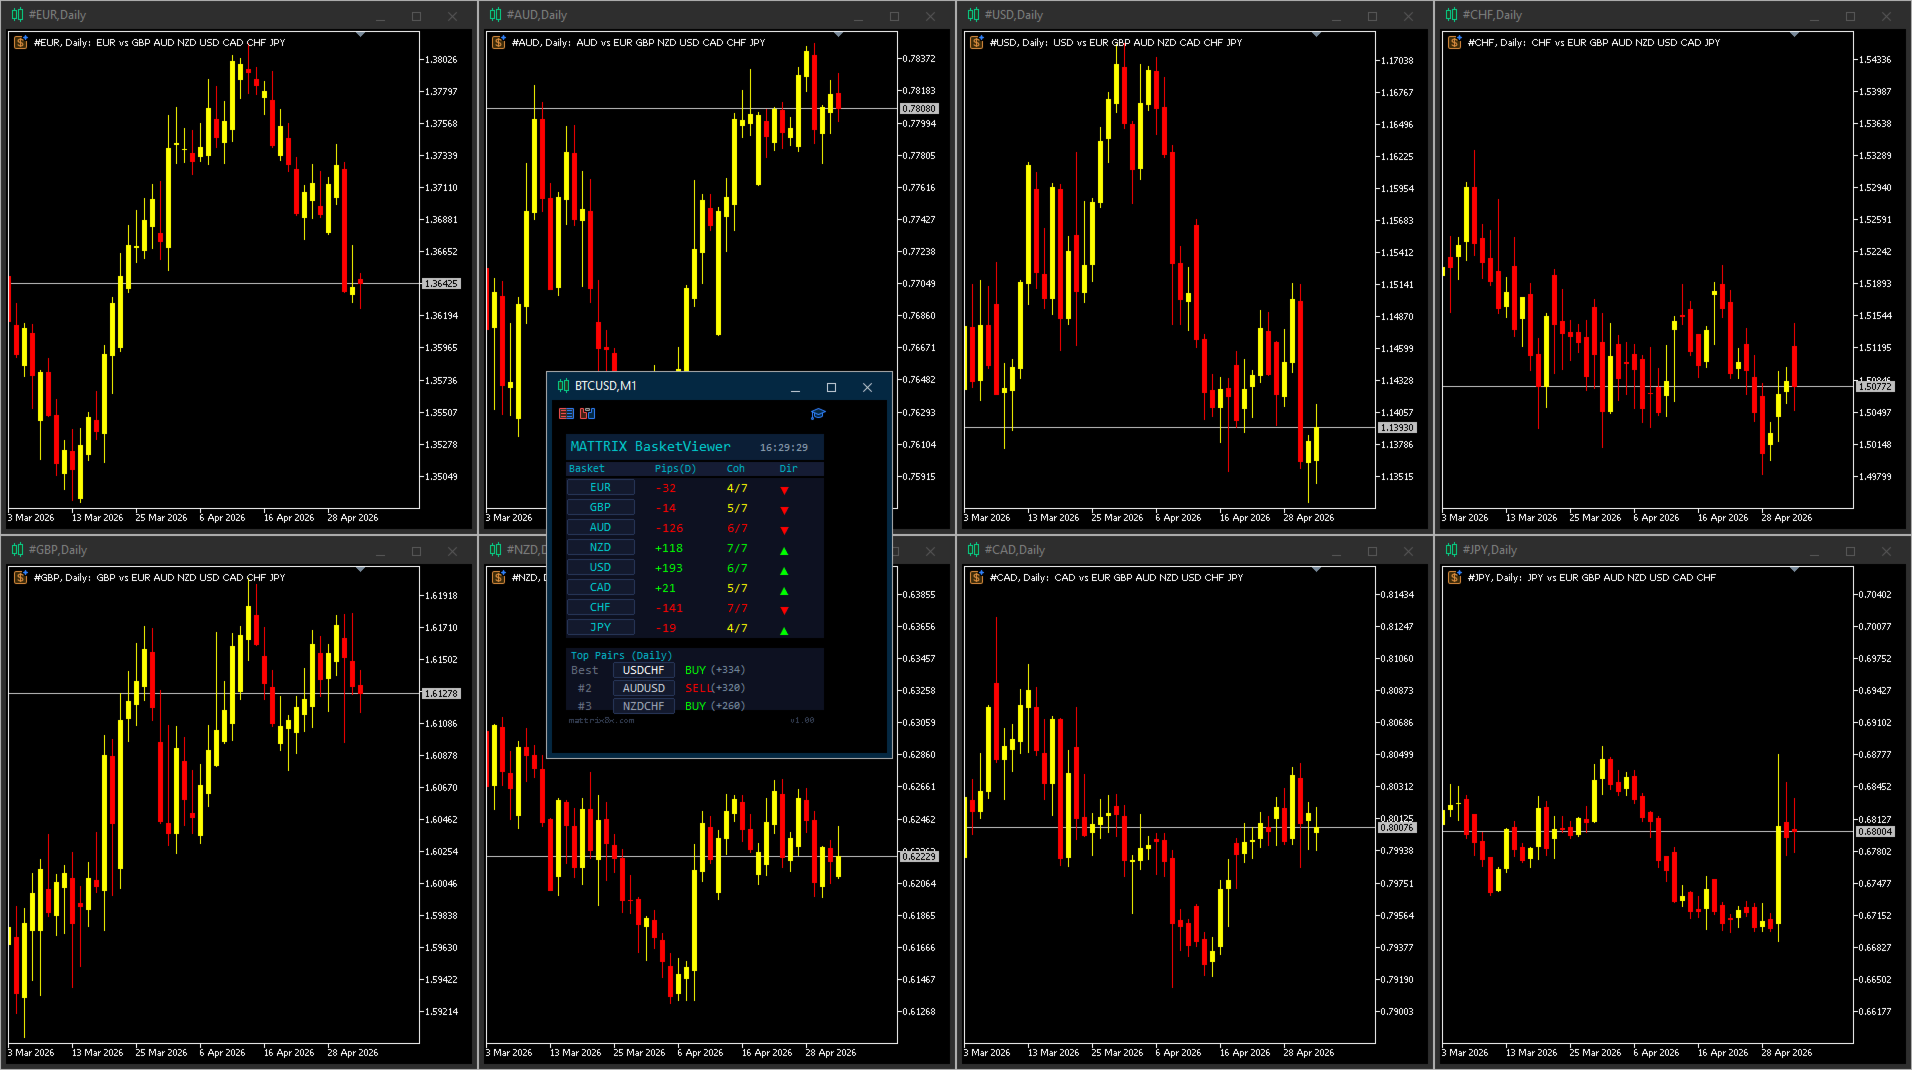
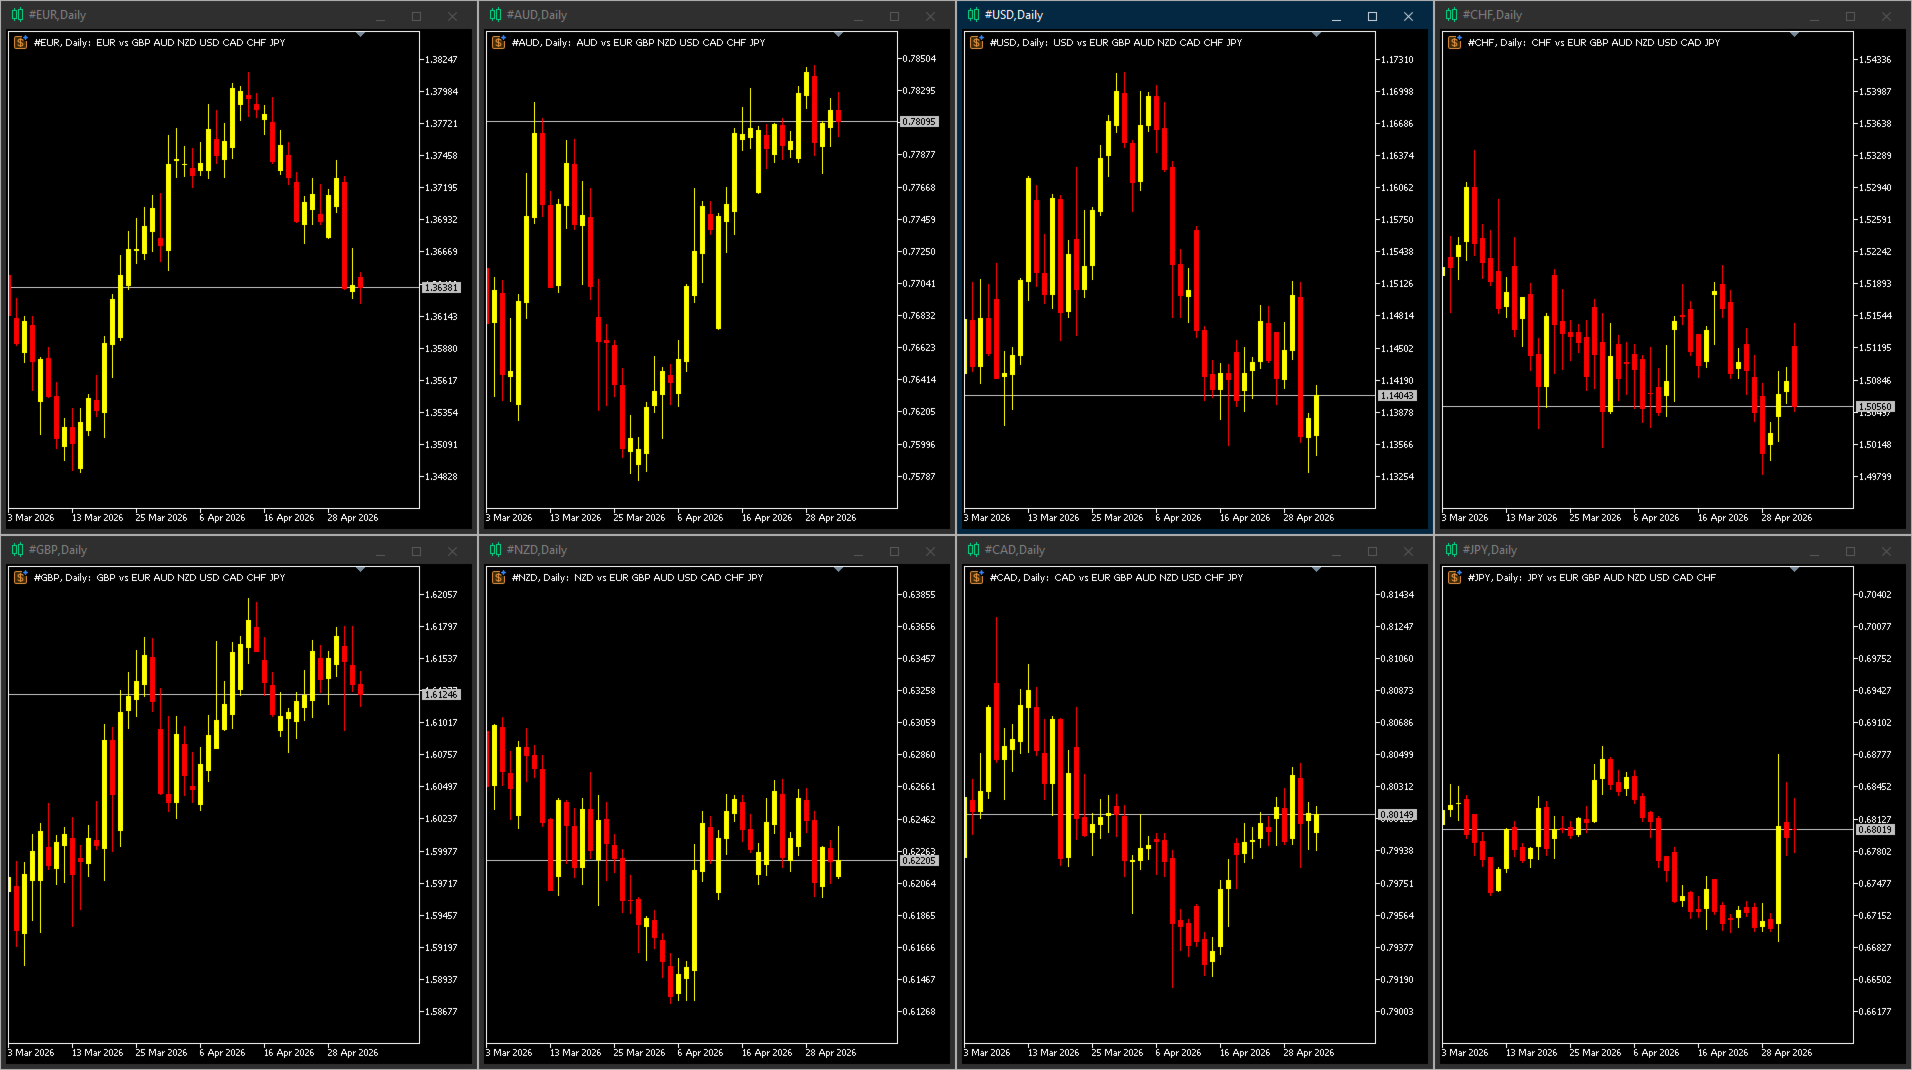
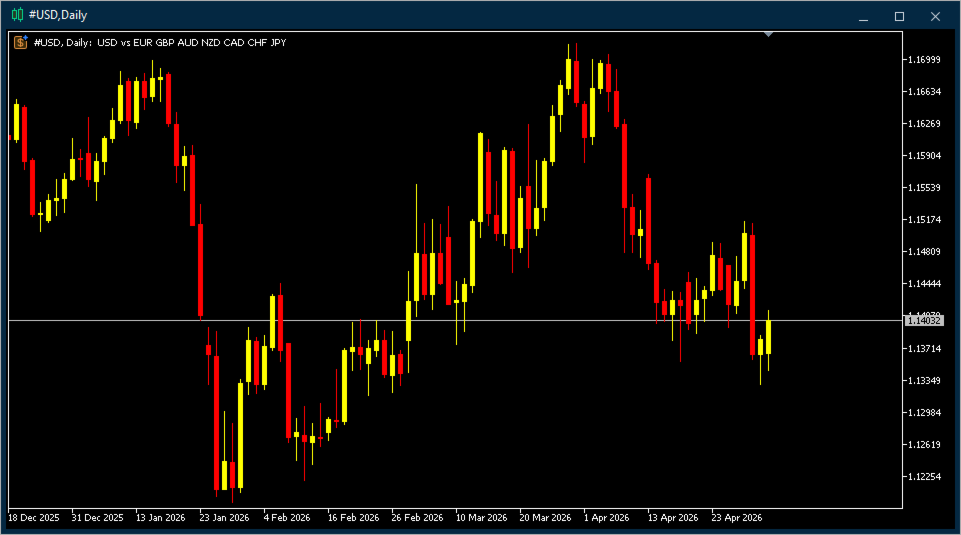
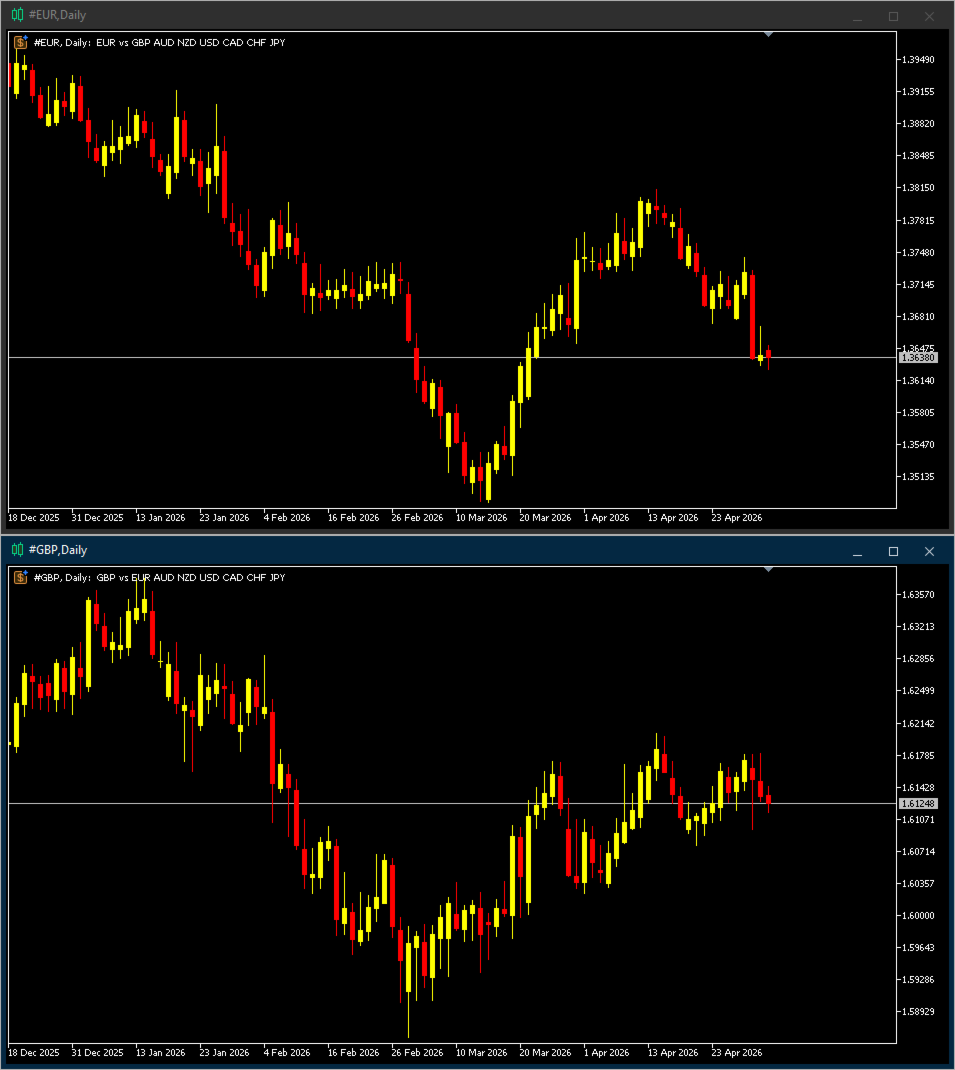
Mattrix Basket Viewer creates 8 synthetic currency index charts directly in MetaTrader 5 using geometric mean calculation.
It analyzes all 28 major forex pairs and groups them into 8 currency baskets, one for each major currency.
Instead of watching 28 individual pairs, you see 8 basket charts that show the strength of each currency.
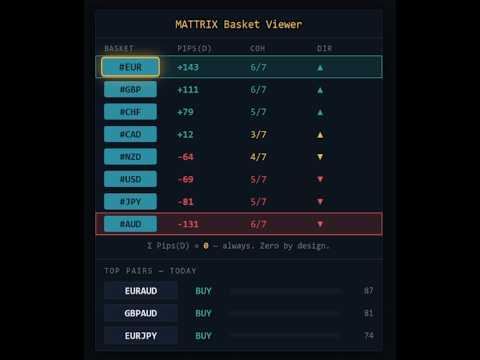
A compact dashboard ranks the baskets by pip sum and coherence - per day, week, month, year or trading session.
Click any basket name to open its chart instantly.
How it works
The EA calculates geometric mean indices for EUR, GBP, AUD, NZD, USD, CAD, CHF and JPY.
Each index measures one currency against all 7 others as the 7th root of the product of its pairs.
This gives an unweighted strength reading for each currency.
All 8 synthetic symbols are created as custom symbols in your terminal with M1 history.
You can apply any indicator or template to these charts.
The 8 baskets are interconnected. Every pair is counted once as a gain for one currency and once as a loss for the other.
The pip sums of all 8 baskets therefore add up to exactly zero, for any period.
When you see USD at +265 pips, that strength is distributed across the other 7 currencies as weakness.
Buy the strong. Sell the weak. Trade the best pair.
Dashboard
Up to four value columns, freely selectable: YTD, MTD, WTD, DAY and the trading sessions TYO, LON and NYC (each 08:00-17:00 local time, daylight saving included). Values are pip sums per basket - the sum of the pip moves of its 7 pairs.
The running session is highlighted. A session that has not yet run on the current trading day shows the last completed one, marked with *.
Coh shows how many of the 7 pairs agree on the direction; Dir shows the majority direction.
High coherence appears green (bullish) or red (bearish), medium coherence yellow, low coherence indicates a choppy market.
Reference period and AUTO
Ranking, coherence and Top Pairs follow a selectable reference period: any of the seven periods, or AUTO.
AUTO ranks by the open session that started first and switches only when the previous session has closed, so the ranking never rests on the first minutes of a new session.
Top Pairs
Below the basket rows the dashboard shows the three best-scored pairs for the reference period: 70 percent basket spread plus 30 percent combined coherence.
Each pair shows the correct base/quote order and whether to buy or sell. Click a pair to open its broker chart.
The value in brackets is the spread between the two baskets, not the pip move of the pair itself.
Snapshot
An optional text block next to the dashboard summarizes strongest and weakest currency, the best pair and the session hours of the current trading day in server time.
The server time zone is detected automatically, including brokers that follow the New York close convention.
Input parameters
Chart Settings: days of M1 history (default 30), symbol group path (default Custom\FX), chart timeframe and template for opened charts, and whether synthetic symbols are deleted when the EA is removed.
Columns & Ranking: Column 1 to 4 (default DAY / TYO / LON / NYC) and the reference period (default AUTO).
Dashboard Position: X / Y position and the snapshot text.
Live write path: how often live data is written to the custom symbols, which keeps the terminal load low.
Requirements
All 28 major forex pairs must be available from your broker. The EA detects the broker suffix automatically.
Attach it to any major pair chart such as EURUSD.
About Free Demo: Due to MetaTrader 5 platform restrictions, the demo version runs only in the Strategy Tester, where this utility cannot fully demonstrate its live-account features (custom symbols cannot be created in the Strategy Tester). For a real-world impression, please refer to the screenshots above or ask any question in the Comments section.
Recommended usage
Attach the EA to a single chart on your main profile. Open basket charts by clicking the dashboard buttons.
Use the session columns to see which currency moves in which session, and the Top Pairs section to find candidate pairs.
Combine with your own technical analysis on the opened charts.
Manual: mattrix8x.com/BasketViewer
Basket Viewer is part of the MATTRIX 8x family. For the full set of custom symbols (#RON, #ROFF, #FIX), pair it with the free Synthetic Chart below.
### THE MATTRIX 8x FAMILY ON MQL5
(c) 2026 Matthias Scholz | mattrix8x.com