Vortex Indicator with Alert System

Vortex Indicator with Alert System for MT5

Overview
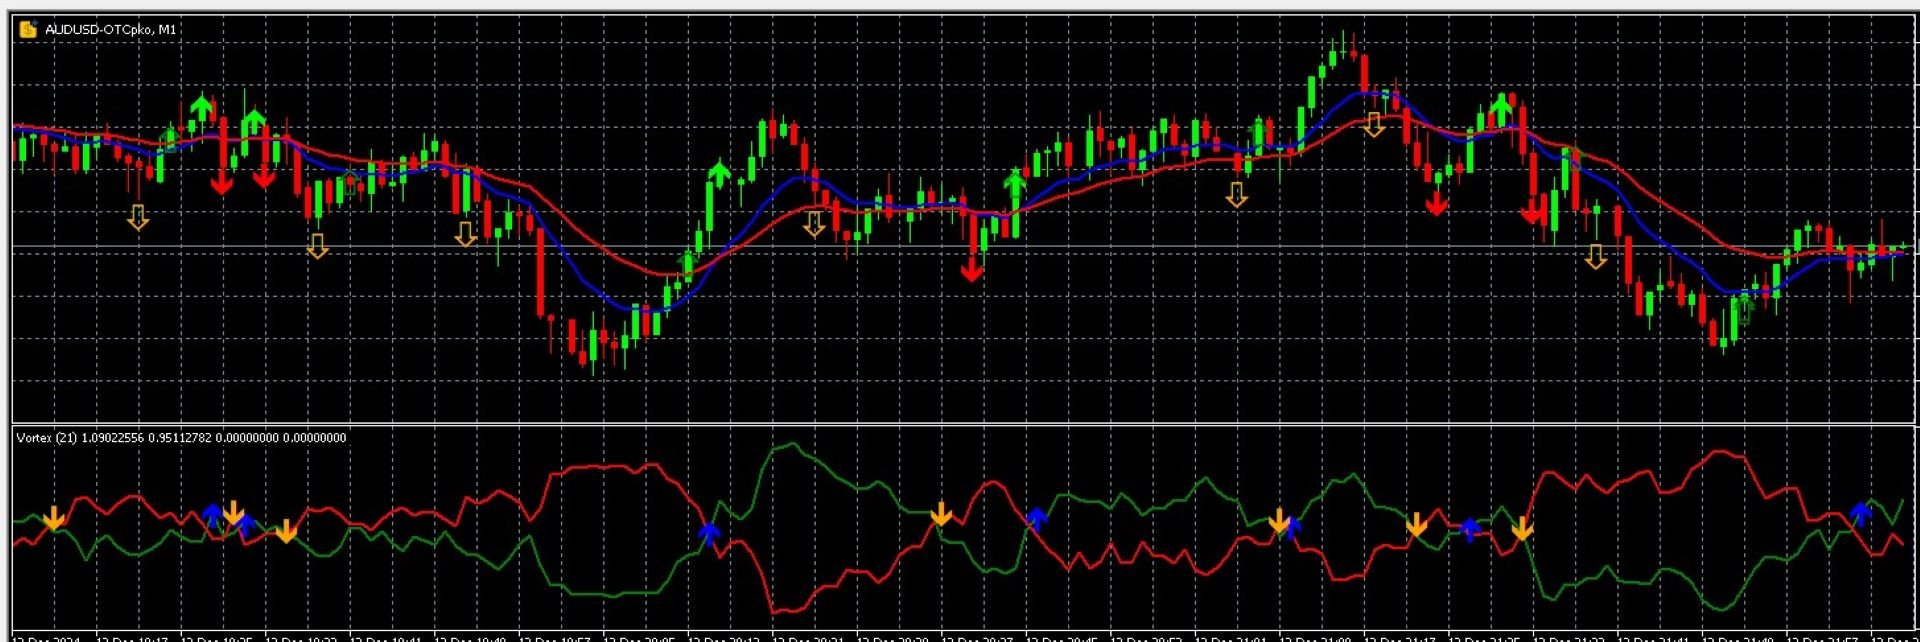
The Vortex Indicator with Alert System is a trend-following tool designed to help traders identify market direction and momentum shifts. This MetaTrader 5 (MT5) indicator analyzes positive and negative vortex movements (+VI and -VI) and generates buy and sell crossover signals with visual markers and customizable alerts.

  • Directional Momentum Detection: Tracks +VI and -VI crossovers for trend confirmation.
  • Crossover Alerts: Notifies traders of potential buy and sell opportunities.
  • Customizable Display: Plots vortex lines and signal arrows directly on the chart.
  • Adjustable Alert System: Enable or disable audio and on-screen notifications.
  • Optimized for Efficient Performance: Designed for minimal system impact.

This indicator is ideal for traders who use momentum-based strategies in volatile markets.

Key Features and Benefits

  • Directional Momentum Analysis

    • +VI (Positive Vortex Indicator) – Measures uptrend strength.
    • -VI (Negative Vortex Indicator) – Measures downtrend strength.
    • Trend Confirmation – Buy and sell signals are triggered when +VI and -VI cross each other.
  • Buy and Sell Signal Alerts

    • Buy Signal: +VI crosses above -VI, indicating potential bullish momentum.
    • Sell Signal: -VI crosses above +VI, indicating potential bearish momentum.
    • Arrows appear on the chart to visually highlight trade opportunities.
    • Configurable alerts notify traders in real time.
  • Customizable Indicator Settings

    • Adjust the vortex period for sensitivity to short-term or long-term trends.
    • Modify arrow colors, sizes, and placement for better visualization.
    • Enable or disable alert notifications to match trading preferences.
  • Lightweight and Efficient

    • Designed to run smoothly on MT5 without slowing performance.
    • Uses optimized calculations for quick signal detection.

How It Works

Step 1: Vortex Line Calculation
The indicator calculates +VI and -VI values over a user-defined period. These vortex lines track momentum shifts in the market.

Step 2: Signal Generation

  • Buy Signal: When +VI crosses above -VI, the indicator plots a green arrow.
  • Sell Signal: When -VI crosses above +VI, the indicator plots a red arrow.

Step 3: Alerts and Visual Markers

  • Optional on-screen alerts notify traders of confirmed crossovers.
  • Arrows on the chart provide a clear visual reference for trade signals.

Customizable Settings

  • Vortex Indicator Parameters:

    • Vortex Period: Adjust sensitivity to market momentum.
  • Signal and Alert Settings:

    • Enable or Disable Alerts: Turn notifications on or off.
    • Arrow Colors and Styles: Customize buy and sell signal markers.
    • Chart Display Options: Modify line thickness and color settings.

Recommended Markets and Timeframes

  • Markets: Works across forex, stocks, indices, commodities, and crypto.
  • Timeframes: Works on M1 to H4 (Recommended: M5, M15, H1).

Why Use This Indicator?

  • Momentum and Trend-Based Strategy: Uses +VI and -VI crossovers for trend confirmation.
  • Custom Alerts and Notifications: Stay informed without constantly monitoring charts.
  • Clear Buy and Sell Markers: Easy-to-read visual signals.
  • Adaptable to Any Market: Works across forex, stocks, commodities, and crypto.

Important Notes and Disclaimer

  • Platform Compatibility: Designed for MetaTrader 5 (MT5).
  • No Guaranteed Outcomes: This indicator provides analysis but does not predict future price movements.
  • User Responsibility: Always test in a demo account before using in live trading.

This Vortex Indicator with Alert System helps traders track trend direction and momentum shifts with real-time notifications and clear visual cues.


Produits recommandés
Every indicator has its advantages and disadvantages. Trending ones show good signals during a trend, but lag during a flat. Flat ones thrive in the flat, but die off as soon as a trend comes. All this would not be a problem, if it was easy to predict when a flat changes to a trend and when a trend changes to a flat, but in practice it is an extremely serious task. What if you develop such an algorithm, which could eliminate an indicator's flaws and enhance its strengths? What if such an algorit
VSA target
Evgenii Bazhenov
VSA target The indicator identifies a professional buyer or a professional seller on the chart using the VSA (Volume Spread Analysis) system and builds a trend support zone relative to these bars (candles), as well as target levels. Features: 1. In this indicator, you can select a mode in which only a professional buyer or a professional seller will be determined, and also that both professional participants will be determined at once. 2. You can set any timeframe on the symbol to determine th
SQN Max indicator for MT5 by ITC
Renaud Herve Francois Candel
Sqn Max Indicator Sqn Max is an exclusive indicator to trade the market with high effectiveness. The indicator is based on price action, volatility and trend. This indicator is as simple as possible but not too simple. The indicator can generate alerts to ease the trading process. You don't have to stay all day in front of your screen. The indicator can be used with any class of assets and with any time frame. It is possible to achieve better results trading our list of selected assets. We achi
SPECIAL LAUNCH OFFER: $30 (1-Month Rent) Limited time offer to build our community and gather feedback! AmbM GOLD Institutional Scalper A high-precision M5 algorithm for XAUUSD (Gold) , engineered to trade exclusively at Institutional Liquidity Levels ($5/$10 psychological marks). PERFORMANCE DATA (BUY ONLY) • Win Rate: 87.09%. • Safe Growth: +$4,113 profit on $10k (13.75% Max Drawdown). • Extreme Stress Test: Successfully generated +$22,997 in a 5-year stress test (2020-2026), proving
Quantum Levels PRO — Anticipez les mouvements du prix avant qu'ils ne se produisent Indicateur de Niveaux de Prix Sans Repeinture pour MT5 | Version 3.10 Le problème avec 90 % des indicateurs : ils vous montrent ce qui s'est déjà produit . Moyennes mobiles, RSI, MACD — ils analysent les données passées et réagissent après que le mouvement est terminé. Quand ils signalent, le meilleur point d'entrée est déjà passé. Quantum Levels PRO est différent. Il calcule des objectifs de prix exacts — des ni
Binary Options Assistant (BOA) CHILL Signals Indicator provides signals based on Katie Tutorials Binary Options Strategy. Indicators: 3 Moving Averages & RSI Stop missing trades, stop jumping from chart to chart looking for trade set-ups and get all the signals on 1 chart! U se any of the BOA Signals Indicator with the  Binary Options Assistant (BOA) Multi Currency Dashboard .  All BOA Signal Indicator settings are adjustable to give you more strategy combinations. The signals can be seen visu
This indicator is based on a classic Moving Average indicator. Moving averages help us to first define the trend and second, to recognize changes in the trend. Multi TimeFrame indicator MTF-MA shows MA data from the 4 timeframes by your choice. By default this indicator has external parameters: TF1 = 1; TimeFrame2b = true; TF2 = 5; TimeFrame3b = true; TF3 = 15; TimeFrame4b = true; TF4 = 60; InpPSARStep = 0.02; InpPSARMaximum = 0.2; You can change TF1-TF4 in the next limits: TF1 from M1 (1) to H4
Kingtrend
Antonio Blazquez
KingTrend — Price Action Trend Analysis Tool KingTrend is a trend-following indicator based on long-standing price action principles involving Highs, Lows, Open, and Close. The logic behind this tool comes from concepts passed on to me by my mentor and translated into code for consistent structure recognition. Features: Identifies market structure using price action logic Detects trend direction and key turning points Marks Higher Highs, Lower Lows, and extensions Suitable for discretionary or
VarMomentPulse is a unique manual trading algorithm developed with precision and flexibility in mind, based on an extensive historical data cluster.  Its operation is grounded in the principles of analyzing crossovers between normalized moving averages and dispersions across various time intervals, enabling it to uncover new opportunities in evaluating market trends. Key Features of the VarMomentPulse Indicator: Adaptability to Volatility:The use of price dispersion analysis allows VarMomentPul
Range Directional Force Indicator – Designed for You to Optimize! The Range Directional Force Indicator is a cutting-edge tool designed to empower traders by visualizing market dynamics and directional strength. Built to offer insights into market trends and reversals, this indicator is an invaluable asset for traders seeking precision in their strategies. However, it is important to note that this indicator is not optimized, leaving room for you to tailor it to your unique trading preferences.
L'indicateur construit les cotations actuelles, qui peuvent être comparées aux cotations historiques et, sur cette base, faire une prévision de l'évolution des prix. L'indicateur dispose d'un champ de texte pour une navigation rapide jusqu'à la date souhaitée. Option : Symbole - sélection du symbole que l'indicateur affichera ; SymbolPeriod - sélection de la période à partir de laquelle l'indicateur prendra des données ; IndicatorColor - couleur de l'indicateur ; HorisontalShift - décalage
# DRAWDOWN INDICATOR V4.0 - L'Outil Essentiel pour Maîtriser Votre Trading ## Transformez Votre Trading avec une Vision Complète de Vos Performances en Temps Réel Dans le monde exigeant du trading Forex et CFD, **connaître vos performances en temps réel** n'est pas un luxe, c'est une **nécessité absolue**. Le **Drawdown Indicator V4.0** est bien plus qu'un simple indicateur : c'est votre **tableau de bord professionnel** qui vous donne une vision claire, précise et instantanée de l'état de vo
Manyal trading system, CovEchoTrend Robot, focuses on reliability and flexibility. By employing statistical analysis methods to study the relationships between the base indicator and market patterns, the system enables a deeper understanding of market processes. Intelligent pattern analysis: The application of statistical data processing helps identify key trend reversal points more accurately, signaling significant market shifts. Informed decision-making is based on the intersection of indicato
VR Grid Mt5
Vladimir Pastushak
3.25 (8)
L'indicateur VR Grid est conçu pour créer une grille graphique avec des paramètres définis par l'utilisateur. Contrairement à la grille standard , VR Grid est utilisée pour créer des niveaux circulaires . Selon le choix de l'utilisateur, le pas entre les niveaux ronds peut être arbitraire. De plus, contrairement à d'autres indicateurs et utilitaires, VR Grid maintient la position de la grille même lorsque la période de temps change ou que le terminal est redémarré. Les paramètres, les fichiers d
FREE
Ugenesys AI MT5
Odaine Ramon Mcmillan
uGenesys AI - 90% Accurate Daytrading Indicator Introducing the ultimate forex trading indicator system, uGenesys AI, powered by cutting-edge AI technology and advanced analytical techniques, including Time-Series Analysis and Genetic Algorithms. Our AI-powered trading system leverages the power of time-series analysis to identify trends and patterns in historical price data, allowing traders to make informed predictions about future market movements. By analyzing vast amounts of data, our syst
ICT Turtle Soup
Rizwan Akram
5 (4)
ICT Turtle Soup Complete System - MT5 Indicator Overview The ICT Turtle Soup Complete System is an advanced MT5 indicator that combines Inner Circle Trader (ICT) concepts with the classic Turtle Soup trading pattern. This sophisticated tool identifies liquidity sweep reversals at key levels, providing high-probability trade setups with complete risk management calculations. Key Features 1. Multi-Timeframe Liquidity Detection Tracks Daily, 4H, 1H, and Yesterday's High/Low levels Identifies
FREE
RBreaker
Zhong Long Wu
RBreaker Gold Indicators est une stratégie de trading intraday à court terme pour les contrats à terme sur l'or, qui combine deux approches : le suivi de tendance et le retournement intraday. Elle permet non seulement de capturer les profits dans les marchés en tendance, mais aussi de prendre des bénéfices en temps opportun lors des retournements de marché et d'ouvrir une position en sens inverse. Cette stratégie a été classée pendant 15 années consécutives parmi les dix stratégies de trading l
RITZ QAFo's PANEL – Quantum Adaptive Fractal Oscillator Panel Adaptive Precision for Smarter Trading Decisions Ritz QAFo's Panel (Quantum Adaptive Fractal Oscillator) is a next-generation adaptive trading indicator engineered to detect high-probability BUY and SELL opportunities through a sophisticated fusion of momentum, trend strength, volatility, and fractal market dynamics. More than a traditional oscillator, QAFo continuously adapts to evolving market structures—reducing noise, filtering fa
Indicator MTF Qristalium Arrows is a semi - automatic trading system. It works on all currency pairs.  The indicator uses three rules: 1) we trade only on the trend, 2)"buy when everyone sells and sell when everyone buys", 3) the Price always goes against the crowd.  Indicator MTF Arrows Qristalium filter rules across multiple time frames using the built-in indicators. If the trend matches on the selected time intervals, the indicator will give an arrow to enter the market. Then you make you
Ultimate Boom and Crash Indicator The Ultimate Boom and Crash Indicator is a cutting-edge tool developed by  Coetsee Digital , designed to identify potential spike opportunities in the market. Crafted for traders focusing on Deriv and Weltrade synthetic markets, this indicator is optimized to operate exclusively on the 3-minute (M3), 5-minute (M5), 15-minute (M15), 30-minute (M30), and 1-hour (H1) timeframes and supports only the following pairs: PainX 1200, PainX 999, PainX 800, PainX 600, Pai
Stratos Pali mt5
Michela Russo
4.5 (8)
Stratos Pali Indicator is a revolutionary tool designed to enhance your trading strategy by accurately identifying market trends. This sophisticated indicator uses a unique algorithm to generate a complete histogram, which records when the trend is Long or Short. When a trend reversal occurs, an arrow appears, indicating the new direction of the trend. Important Information Revealed Leave a review and contact me via mql5 message to receive My Top 5 set files for Stratos Pali at no cost ! Down
Binary Options Assistant (BOA) Multi Currency Dashboard for Binary Options (MT5) . You can use any of the BOA Signals Indicators with the dashboard. Just change the BOA Signals Indicator Name in the dashboard settings to the indicator you want to get signals from. For example: CHILL. BLAZE:  BOA_BLAZE_Indicator_v1   Strategy :   BLW Online Trading Binary Options Strategy (3 Moving Average) LAVA:  BOA_LAVA_Indicator_v1   Strategy:   Lady Trader Binary Options Strategy (Bollinger Bands & Stochas
TransitBlueOcean
Bonginkosi Innocent Khumalo
5 (1)
TransitBlueOcean is indicator system that uses ocean wave's pattern, to help one to know when to buy and when to sell. The indicator system is very powerful like the ocean waves. Join the mql5 channel for TransitBlueOcean  https://www.mql5.com/en/channels/transitblueocean   How to use: Zoom in so that the Ocean will appear on your chart. Buy when you see the candles, the candle will be above the ocean wave (buying signal). Sell when you can't see the candles, the candles will be inside the wav
Kecia Market Manager
Niccolo Filippo Palombi
The Kecia Market Manager is an advanced MT5 indicator that transforms multi-asset correlation analysis into actionable trading intelligence. By employing 6 sophisticated statistical frameworks and professional-grade visualizations, this tool reveals hidden market relationships, pair trading opportunities, and portfolio hedging strategies across unlimited currency pairs in real-time. Key Features: Multi-Metric Analysis Engine : Pearson correlation coefficient with rolling windows Cointegration te
Présentation Cet indicateur MT5 crée un tableau de bord de trading professionnel qui analyse simultanément 4 indicateurs techniques clés sur 3 unités de temps (M15, H1, H4) afin d'identifier les opportunités de trading à forte probabilité grâce à l'analyse de confluence. 1. Analyse de tendance EMA (Moyenne Mobile Exponentielle) 2. Analyse du momentum RSI (Indice de Force Relative) 3. Analyse de la volatilité ATR (Average True Range) 4. Analyse des figures en chandeliers (CDL) Conception optimi
Di Napoli MACD MT5
Samil Bozuyuk
4.33 (6)
Non-proprietary study of Joe Dinapoli used for trend analysis. The indicator gives trend signals when the fast line penetrates the slow line. These signals remain intact until another penetration occurs. The signal is confirmed at the close of the period. It is applicable for all timeframes.   Parameters Fast EMA: period of the fast moving average. Slow EMA: period of the slow moving average. Signal EMA: period of the signal line.                              ************************************
FREE
Visual Vortex Indicator
AL MOOSAWI ABDULLAH JAFFER BAQER
Unleash the Power of Market Dynamics with the Vortex Indicator! The Visual Vortex Indicator is your advanced tool for decoding market trends, reversals, and momentum shifts. Priced at $65, this indicator provides a comprehensive view of market behavior, but it’s designed for you to fine-tune and optimize it according to your unique trading strategy. What Makes It Unique? The Vortex Indicator is based on a strategy that identifies directional movements and trend strength by analyzing key price d
Connors PercentB
MATTHEW STAN WILLS
Larry Connors TPS – PercentB - (Bollinger Band %) A professional implementation of Larry Connors' Percent B strategy, designed to systematically capture high-probability short-term reversals in equity markets. This system uses the Bollinger Band %b indicator to identify when price has moved to a statistical extreme relative to its recent volatility envelope. When %b drops near zero, price is at or below the lower Bollinger Band — a quantified oversold condition that this EA captures with discipl
Visual Momentum Flow Indicator
AL MOOSAWI ABDULLAH JAFFER BAQER
Visual Momentum Flow Indicator: Decode the Market's True Intent Are you tired of indicators that only work in trending markets, leaving you confused during consolidations? Do you struggle to distinguish between a genuine momentum breakout and a false move within a ranging market? The Visual Momentum Flow Indicator is your solution. This meticulously engineered tool is designed not just to follow trends, but to interpret the very character of the market, giving you a distinct edge by clearly ide
Ichimoku Aiko MTF
Michael Jonah Randriamampionontsoa
Ichimoku Aiko MTF is a collection of technical indicators that show support and resistance levels, as well as momentum and trend direction. It is a multi-timeframe indicator so you don't need to change the chart timeframe when you want to see the ichimoku clouds on a higher timeframe.  eg. The chart timeframe is M15 and you want to see on the M15 timeframe chart the H1 ichimoku indicators (the ichimoku in Metatrader can't do that) that's why you need to use Ichimoku Aiko MTF.
Les acheteurs de ce produit ont également acheté
SuperScalp Pro
Van Minh Nguyen
4.57 (21)
SuperScalp Pro – Système avancé d’indicateur de scalping multi-filtres SuperScalp Pro est un indicateur de scalping avancé qui combine le Supertrend classique avec plusieurs filtres de confirmation intelligents afin d’identifier les opportunités de trading. Il fonctionne efficacement sur plusieurs unités de temps, de M1 à H4, avec des performances optimisées sur XAUUSD, BTCUSD et les principales paires Forex. L’indicateur fournit des signaux d’achat et de vente clairs, ainsi que des niveaux d’en
Divergence Bomber
Ihor Otkydach
4.9 (86)
Chaque acheteur de cet indicateur reçoit également gratuitement : L’outil exclusif « Bomber Utility », qui accompagne automatiquement chaque opération de trading, fixe les niveaux de Stop Loss et de Take Profit, et clôture les positions selon les règles de la stratégie Des fichiers de configuration (set files) pour adapter l’indicateur à différents actifs Des set files pour configurer le Bomber Utility selon différents modes : « Risque Minimum », « Risque Équilibré » et « Stratégie d’Attente » U
Entry In The Zone and SMC Multi Timeframe is a real-time 2-in-1 market analysis tool that combines market structure analysis and a No Repaint BUY / SELL signal system into a single indicator, built on Smart Money Concepts (SMC) — a widely adopted framework used by professional traders to understand market structure. This indicator helps you see the market more clearly, make decisions based on structure rather than guesswork, and focus on high-probability zones where price is more likely to react
Azimuth Pro
Ottaviano De Cicco
5 (6)
Azimuth Pro V2: Synthetic Fractal Structure and Confirmed Entries for MT5 Overview Azimuth Pro is a multi-level swing structure indicator by Merkava Labs . Four nested swing layers, swing-anchored VWAP, ABC pattern detection, three-timeframe structural filtering, and closed-bar confirmed entries — one chart, one workflow from micro-swings to macro-cycles. This is not a blind signal product. It is a structure-first workflow for traders who care about location, context, and timing. V2 Launch Offe
Quantum TrendPulse
Bogdan Ion Puscasu
5 (23)
Présentation de   Quantum TrendPulse   , l'outil de trading ultime qui combine la puissance de   SuperTrend   ,   RSI   et   Stochastic   dans un seul indicateur complet pour maximiser votre potentiel de trading. Conçu pour les traders qui recherchent précision et efficacité, cet indicateur vous aide à identifier les tendances du marché, les changements de dynamique et les points d'entrée et de sortie optimaux en toute confiance. Caractéristiques principales : Intégration SuperTrend :   suivez f
Power Candles MT5
Daniel Stein
4.75 (8)
Power Candles – Signaux d’entrée basés sur la force pour tous les marchés Power Candles intègre l’analyse de force éprouvée de Stein Investments directement dans le graphique des prix. Au lieu de réagir uniquement au prix, chaque bougie est colorée en fonction de la force réelle du marché, ce qui permet d’identifier instantanément les phases de momentum, l’accélération de la force et les transitions de tendance propres. Une logique unique pour tous les marchés Power Candles fonctionne automatiqu
Gann Made Easy   est un système de trading Forex professionnel et facile à utiliser qui est basé sur les meilleurs principes de trading en utilisant la théorie de mr. WD Gann. L'indicateur fournit des signaux d'ACHAT et de VENTE précis, y compris les niveaux Stop Loss et Take Profit. Vous pouvez échanger même en déplacement en utilisant les notifications PUSH. VEUILLEZ ME CONTACTER APRÈS L'ACHAT POUR RECEVOIR GRATUITEMENT DES INSTRUCTIONS DE TRADING ET D'EXCELLENTS INDICATEURS SUPPLÉMENTAIRES! V
OmniSync Projection
Antonio-alin Teculescu
5 (1)
Chronos Fractal Engine is an innovative price projection indicator for MetaTrader 5, designed to transform your technical analysis by intelligently identifying and projecting historical price patterns. Built upon an advanced correlation algorithm and the fractal principles of the market, this powerful tool visualizes potential future price movements, giving you a unique edge in your trading decisions. What is Chronos Fractal Engine? At its core, the Chronos Fractal Engine employs a sophisticat
Si vous achetez cet indicateur, vous recevrez mon Gestionnaire de Trading Professionnel + EA  GRATUITEMENT. Tout d'abord, il convient de souligner que ce système de trading est un indicateur non repeint, non redessiné et non retardé, ce qui le rend idéal pour le trading manuel et automatisé. Cours en ligne, manuel et téléchargement de préréglages. Le "Système de Trading Smart Trend MT5" est une solution de trading complète conçue pour les traders débutants et expérimentés. Il combine plus de 10
Présentation       Quantum Breakout PRO   , l'indicateur révolutionnaire MQL5 qui transforme la façon dont vous négociez les zones d'évasion ! Développé par une équipe de traders expérimentés avec une expérience commerciale de plus de 13 ans,       Évasion quantique PRO       est conçu pour propulser votre parcours commercial vers de nouveaux sommets grâce à sa stratégie de zone de discussion innovante et dynamique. Quantum Breakout Indicator vous donnera des flèches de signalisation sur les z
Grabber System MT5
Ihor Otkydach
4.83 (23)
Je vous présente un excellent indicateur technique : Grabber, qui fonctionne comme une stratégie de trading "tout-en-un", prête à l'emploi. En un seul code sont intégrés des outils puissants d'analyse technique du marché, des signaux de trading (flèches), des fonctions d'alerte et des notifications push. Chaque acheteur de cet indicateur reçoit également gratuitement : L'utilitaire Grabber : pour la gestion automatique des ordres ouverts Un guide vidéo étape par étape : pour apprendre à installe
FX Trend MT5 NG
Daniel Stein
5 (4)
FX Trend NG : La Nouvelle Génération d’Intelligence de Tendance Multi-Marchés Vue d’ensemble FX Trend NG est un outil professionnel d’analyse de tendance multi-timeframe et de surveillance des marchés. Il vous permet de comprendre la structure complète du marché en quelques secondes. Au lieu de naviguer entre de nombreux graphiques, vous identifiez immédiatement quels instruments sont en tendance, où le momentum s’affaiblit et où plusieurs unités de temps sont alignées. Offre de Lancement – Ob
Commençons par être honnêtes. Aucun indicateur ne vous rendra rentable à lui seul. Si quelqu’un vous dit le contraire, il vous vend un rêve. Tout indicateur qui affiche des flèches parfaites d’achat/vente peut être rendu impeccable — il suffit de zoomer sur la bonne partie de l’historique et de capturer uniquement les trades gagnants. Nous ne faisons pas cela.  SMC Intraday Formula est un outil. Il lit la structure du marché pour vous, identifie les zones de prix à la probabilité la plus élevée
Voyez quelle strategie fonctionne reellement sur votre symbole - avant de risquer de l'argent reel. Power Bar detecte les barres de prix extremes sur n'importe quel symbole et n'importe quel timeframe, puis backteste instantanement 3 strategies de trading differentes pour que vous puissiez comparer les taux de reussite, les facteurs de profit et les P&L cote a cote. Le tout dans un seul panneau interactif. Pas de suppositions. Pas de suroptimisation. Juste des donnees. Qu'est-ce qui rend Power
CGE Trading Suite
Carl Gustav Johan Ekstrom
5 (2)
Institutional-Grade Analytics for MT5 C GE Trading Suite delivers the analytical edge typically reserved for professional trading desks. The platform integrates a full suite of analytical tools into one seamless workflow: dynamic grid mapping, liquidity behavior analysis, ECM, trend lines, MIDAS, trade cycles, and directional channel projections. Together, these provide a unified view of market structure and momentum. Directional clarity is further enhanced by the capital flow index, which meas
Atomic Analyst MT5
Issam Kassas
3.94 (31)
Tout d'abord, il convient de souligner que cet indicateur de trading n'est ni repainting, ni redrawing et ne présente aucun délai, ce qui le rend idéal à la fois pour le trading manuel et automatisé. Manuel de l'utilisateur : réglages, entrées et stratégie. L'Analyste Atomique est un indicateur d'action sur les prix PA qui utilise la force et le momentum du prix pour trouver un meilleur avantage sur le marché. Équipé de filtres avancés qui aident à éliminer les bruits et les faux signaux, et à
Trend Screener Pro MT5
STE S.S.COMPANY
4.85 (104)
Indicateur de tendance, solution unique révolutionnaire pour le trading et le filtrage des tendances avec toutes les fonctionnalités de tendance importantes intégrées dans un seul outil ! Il s'agit d'un indicateur multi-période et multi-devises 100 % non repeint qui peut être utilisé sur tous les symboles/instruments : forex, matières premières, crypto-monnaies, indices et actions. Trend Screener est un indicateur de suivi de tendance efficace qui fournit des signaux de tendance fléchés avec des
FX Power MT5 NG
Daniel Stein
5 (31)
FX Power : Analysez la force des devises pour des décisions de trading plus intelligentes Aperçu FX Power est l'outil essentiel pour comprendre la force réelle des principales devises et de l'or, quelles que soient les conditions du marché. En identifiant les devises fortes à acheter et les faibles à vendre, FX Power simplifie vos décisions de trading et révèle des opportunités à forte probabilité. Que vous suiviez les tendances ou anticipiez les retournements à l'aide de valeurs extrêmes de D
Btmm state engine pro
Garry James Goodchild
5 (4)
BTMM State Engine Pro is a MetaTrader 5 indicator for traders who use the Beat The Market Maker approach: Asian session context, kill zone timing, level progression, peak formation detection, and a multi-pair scanner from a single chart. It combines cycle state logic with a built-in scanner dashboard so you do not need the same tool on many charts at once. What it does Draws the Asian session range; session times can follow broker server offset or be set in inputs. Tracks level progression (L
Crystal Heikin Ashi Signals
Muhammad Jawad Shabir
5 (2)
Crystal Heikin Ashi Signals - Professional Trend & Signal Detection Indicator Advanced Heikin Ashi Visualization with Intelligent Signal System for Manual & Automated Trading Final Price: $149 ---------> Price goes up $10 after every 10 sales . Limited slots available — act fast . Overview Crystal Heikin Ashi Signals is a professional-grade MetaTrader 5 indicator that combines pure Heikin Ashi candle visualization with an advanced momentum-shift detection system. Designed for both manual traders
Berma Bands
Muhammad Elbermawi
5 (8)
L'indicateur Berma Bands (BB) est un outil précieux pour les traders qui cherchent à identifier et à capitaliser sur les tendances du marché. En analysant la relation entre le prix et les BB, les traders peuvent déterminer si un marché est dans une phase de tendance ou de range. Visitez le [ Berma Home Blog ] pour en savoir plus. Les bandes de Berma sont composées de trois lignes distinctes : la bande de Berma supérieure, la bande de Berma moyenne et la bande de Berma inférieure. Ces lignes sont
Meridian Pro
Ottaviano De Cicco
5 (1)
Meridian Pro: Professional Multi-Timeframe Trend Matrix for MT5 Overview Meridian Pro is a multi-timeframe trend matrix by Merkava Labs that compresses directional state, strength, momentum condition and matrix agreement into one compact panel. One adaptive engine, applied consistently from M1 to W1. No per-symbol tuning. No indicator stacking. One structured readout across every asset and every timeframe. Launch Offer — Get Meridian Pro for USD 99 (introductory). Regular price: USD 149. 1. Why
Bill Williams Advanced
Siarhei Vashchylka
5 (11)
Bill Williams Advanced is designed for automatic chart analysis using Bill Williams' "Profitunity" system. The indicator analyzes four timeframes at once. Manual (Be sure to read before purchasing) Advantages 1. Analyzes the chart using Bill Williams' "Profitunity" system. Signals are displayed in a table in the corner of the screen and on the price chart. 2. Finds all known AO and AC signals, as well as zone signals. Equipped with a trend filter based on the Alligator. 3. Finds "Divergence Bar
Auto Optimized Parabolic RSI : Moteur de Momentum 3D Avancé La plupart des indicateurs pour les particuliers échouent car ils s'appuient sur des paramètres statiques qui se brisent dès que la volatilité du marché change. L'Auto Optimized Parabolic RSI résout le problème de l'« obsolescence des indicateurs » en recalculant continuellement son propre avantage mathématique, apportant une adaptation quantitative de niveau institutionnel directement sur votre terminal MT5. L'Avantage Principal : Opti
Market Structure Order Block Dashboard MT5 est un indicateur MT5 conçu pour les traders qui veulent lire la structure de marché et les principales zones de réaction du prix directement sur le graphique. Il combine BOS, ChoCH, Order Blocks, Fair Value Gaps (FVG), Liquidité, Kill Zones, Volume Profile, et un dashboard compact pour une analyse rapide. Cet indicateur s’adresse aux traders qui utilisent la structure de marché, les concepts ICT et Smart Money comme cadre de décision. Il peut aider à r
ARICoins
Temirlan Kdyrkhan
ARICoin is a powerful trading companion designed to generate high-probability entry signals with dynamic TP/SL/DP levels based on volatility. Built-in performance tracking shows win/loss stats, PP1/PP2 hits, and success rates all updated live. Key Features: Buy/Sell signals with adaptive volatility bands Real-time TP/SL/DP levels based on ATR Built-in MA Filter with optional ATR/StdDev volatility Performance stats panel (Success, Profit/Loss, PP1/PP2) Alerts via popup, sound, push, or email Cust
SignalTech MT5 is a trading system for EURUSD, USDCHF, USDJPY, AUDUSD, NZDUSD, EURJPY, AUDJPY, NZDJPY, CADJPY H2 and H3 Timeframe.  It can generate signals with Buy/Sell Arrows and Pop-Up/Sound Alerts. Each signal has clear Entry and Stop Loss levels, which should be automatically flagged on the chart, as well as potential Targets 1, 2, and 3. The Entry and TP levels are fixed after the trade is taken. The exit level is dynamic. If there are signs of a potential short-term trend reversal, the
Smart Stop Indicator – Précision intelligente du stop-loss directement sur votre graphique Présentation Smart Stop Indicator est la solution idéale pour les traders qui souhaitent placer leur stop-loss de manière claire et méthodique, sans deviner ni suivre leur intuition. Cet outil combine la logique classique de price action (succession de plus hauts et de plus bas) avec une reconnaissance moderne des cassures pour identifier le prochain niveau de stop réellement logique. Que le marché soit
Market Structure Patterns
Samuel Manoel De Souza
4.47 (19)
Disponible pour   MT4   et   MT5 . Rejoignez le canal Market Structure Patterns pour télécharger des documents d'étude et/ou des informations supplémentaires. Articles connexes : Market Structure Patterns - Introdução Beyond Fancy Order Blocks: Using True Volumetric Analysis with Market Structure Patterns & Timeless Charts Market Structure Patterns – Complete SMC Indicator Guide (Concepts + Settings) Market Structure Patterns   est un indicateur basé sur les   Smart Money Concepts   qui affich
Meravith Scanner
Ivan Stefanov
5 (1)
MERAVITH SCANNER est un indicateur professionnel pour les marchés financiers sur MetaTrader 5, qui regroupe plusieurs outils d’analyse en un seul système intégré. Il effectue tous les calculs automatiquement en utilisant une méthodologie propriétaire de prix moyen pondéré par le volume (VWAP), éliminant ainsi toute interprétation subjective. Cet indicateur fonctionne sur toutes les classes d’actifs (Forex, actions, indices, matières premières, cryptomonnaies) et sur toutes les périodes, de M1 au
Plus de l'auteur
ocket Options Keltner Channel with MA v3.12 Indicator Name: Keltner Channel v3.12 – Advanced Trend and Signal Indicator Version: 3.12 Release Date: 2024 Platform: MetaTrader 5 (MT5) Category: Trend Indicators Overview Keltner Channel v3.12 is a trend-following indicator that combines Keltner Channels with Moving Averages (MA1 and MA2) to identify breakouts, trend shifts, and momentum changes. This tool provides real-time buy and sell signals, visual markers, and alerts to assist traders in dec
Indicator Overview Latest Updates: Update 02-23-2025: This version includes further optimizations for improved signal accuracy. Update 01-13-2025: Now compatible with the upcoming Web Request App, which will replace the AutoSignal_Connection bot. Purpose This MT5 indicator is designed for analyzing 3-minute Heiken Ashi candles, generating buy and sell signals based on moving average (MA) crossovers. It provides visual signals and alerts, making it a valuable tool for traders. Heiken Ashi Candl
Combined RSI and Stochastic Indicator for MT5 Overview The Combined RSI and Stochastic Indicator integrates the Relative Strength Index (RSI) and Stochastic Oscillator to provide trend confirmation and momentum-based trading signals. This MetaTrader 5 (MT5) indicator helps traders identify potential buy and sell opportunities by combining stochastic crossovers with RSI trend validation. RSI Trend Confirmation: Filters stochastic signals based on overall trend direction. Stochastic Crossovers:
MACD Alerts
Matthew Palulis
MACD Crossover with Alerts, Colored Histogram, and Zero Line Arrows Overview The MACD Crossover Indicator is designed to help traders analyze trend direction and momentum shifts. This enhanced version of the classic MACD includes visual crossover markers, dynamic histogram coloring, and real-time alerts, offering a clear and structured approach to market analysis. Histogram color changes based on MACD position (above or below zero). Zero-line arrows for crossover points to highlight key trend
MA Crossover and Trend Alert Indicator Latest Updates: Fixed multiple buy and sell icons on each candle for cleaner signals. Optimized alert logic to prevent duplicate notifications. Enhanced compatibility – Now works with Heiken Ashi or regular candles. Updated print statement – Alerts now log directly to alerts.txt for future reference. Overview The EMA Crossover and Trend Alert Indicator is a trend-following tool designed to assist traders in identifying moving average crossovers and short-
SuperTrend Indicator with Alerts Overview The SuperTrend Indicator is a trend-following tool that helps traders identify market direction and potential reversals using a combination of: Commodity Channel Index (CCI): Detects momentum shifts and confirms trends. Exponential Moving Average (EMA): Acts as a trend filter to enhance signal accuracy. SuperTrend Lines: Visual trend markers for clear buy and sell signals. This indicator provides real-time alerts and visual markers to help traders reco
Custom Heiken Ashi and Moving Averages-Based Signal Indicator Overview This Heiken Ashi and Moving Average-based indicator is designed to identify trend-following buy and sell signals by analyzing the relationship between three Exponential Moving Averages (EMAs). It applies Heiken Ashi smoothing to filter market noise and improve trend clarity. EMA Crossovers for Trend Detection – Uses 3, 8, and 25-period EMAs to confirm trends. Heiken Ashi Smoothing – Reduces market noise for better trend vis
ocket Options GreenLine Strategy – SMA(7) Crossover & Trend Alert Indicator Latest Updates: Added Sell Alerts within an Uptrend – If MA1 crosses below MA2 without going below MA3, a Sell Alert is triggered. Enhanced Alert Logic – Prevents duplicate buy and sell icons on every candle. Improved Print Statement – Alerts now log directly to alerts.txt for future reference. Now Compatible with Heiken Ashi and Regular Candles. Overview The Pocket Options GreenLine Strategy is a trend-following indic
Overview Pullback Rejection v2.0 is a professional-grade visual indicator that spots continuation setups after pullbacks using Heiken Ashi logic and multi-EMA trend bias. It is designed for scalpers and intraday traders who want clean, rule-based BUY and SELL signals aligned with trend direction only — no repainting, no noise, no counter-trend traps.  Trading Concept The indicator combines EMA 7, EMA 50, and EMA 200 to define directional bias: Bias Condition Trades Allowed Bullish EMA7 > EMA200
Filtrer:
Aucun avis
Répondre à l'avis