 MetaTrader 5
 Experts
 Indicateurs
 Scripts
 Bibliothèque
 Stockage
Rejoignez notre page de fans

Risk of Ruin: how often your account blows up at a chosen risk per trade - script pour MetaTrader 5

- Vues:
- 65
- Note:
- Publié:
-
 Vous manquez des opportunités de trading :
- Applications de trading gratuites
- Plus de 8 000 signaux à copier
- Actualités économiques pour explorer les marchés financiers
Inscription Se connecterVous acceptez la politique du site Web et les conditions d'utilisation
Si vous n'avez pas de compte, veuillez vous inscrire -
 Besoin d'un robot ou d'un indicateur basé sur ce code ? Commandez-le sur Freelance
Aller sur Freelance
Risk of Ruin reads the closed trades in your account history and tells you the probability of blowing up your account before your edge pays off. A positive expectancy on paper does not stop a losing streak at the wrong size from ending the account, and this script tells you how likely that is on your own trades.
It works by normalising each historical trade to an R-multiple (its net result divided by your average absolute loss), then simulating many hypothetical future runs at a risk-per-trade you choose. In each run it draws R-multiples from your history at random with replacement, compounds the equity trade by trade, and marks the run as ruined if the equity ever falls below the floor you set. The method is independent of the dollar size you traded in history; all that carries over is the shape of your win/loss distribution, and the risk % you set now is what sizes every future trade.
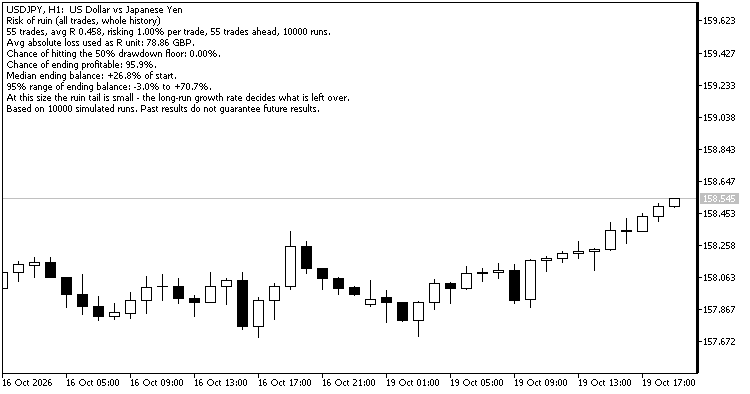
The script on a USD/JPY chart, reading a demo account with 55 closed trades at 1% risk per trade: a 0% chance of hitting the 50% drawdown floor over the next 55 trades, median ending balance +26.8% of start.
How to read the result
- Chance of hitting the drawdown floor: the share of simulated runs that ended at or below the floor you set. Zero is desirable, but zero on a small history is not a guarantee; the sim can only reshuffle the trades you already have.
- Chance of ending profitable: the share of runs ending above the start. A high number here with a non-trivial chance of ruin means the strategy makes money most of the time but blows up often enough to matter.
- Median ending balance: the typical final result as a percentage change from start. The median is more honest than the mean on bootstrapped equity curves because the mean is pulled by a long upside tail.
- 95% range of ending balances: the middle 95% of simulated final equities. The width of this range is where position sizing lives: the same strategy at double the risk has roughly the same median growth rate and a far wider range, and the extra width is almost all drawdown.
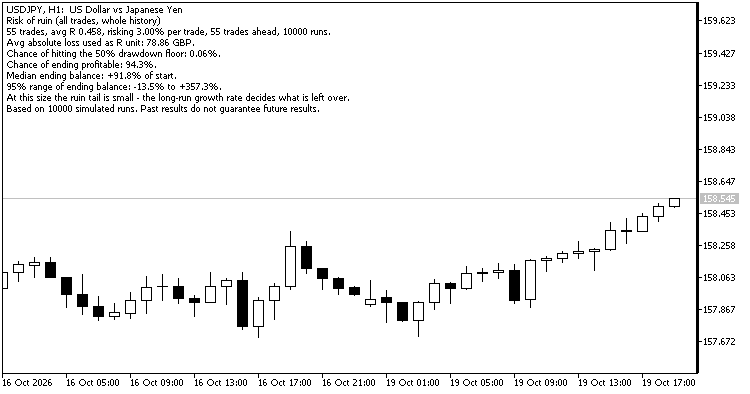
The same account at 3% risk per trade instead of 1%: the median ending balance goes to +91.8%, but the 95% range widens from -3.0%..+70.7% to -13.5%..+357.3%. The extra range is almost all extra downside.
The result is printed in the Experts tab of the Toolbox and shown in the top left corner of the chart. The chart you run it on does not matter, because the script reads the whole account history rather than the chart's symbol. Run it again with other settings to replace the text, for example to try a different risk per trade or a different drawdown floor.
How trades are counted
A trade is every deal of one position, counted once the position is closed. Its net result is profit plus commission, fee and swap, as recorded in your broker's deal history, so it matches what you were charged. Each trade is then converted to an R-multiple by dividing by the average of your absolute losses: a trade that lost one average loss is -1R, a trade that won twice an average loss is +2R. Deposits, withdrawals and charges booked outside trades are left out, and so are positions that are still open. On a netting account, a position that is reversed counts as one trade.
Parameters
- Magic number: -1 for all trades, 0 for manual trades only, or the magic number of one Expert Advisor.
- Symbol: leave empty for all symbols.
- Only trades closed in the last N days: 0 for the whole history.
- Risk per trade, % of equity: 0.01 to 25.0, default 1.0. The simulation sizes every future trade with this; it does not need to match the risk you used in history, because the sim scales from R-multiples.
- Ruin floor, % of starting equity: 10.0 to 95.0, default 50.0. A 50% floor is the convention used in the risk-of-ruin literature; raise it to be stricter (a prop-firm style 10% drawdown cap, say).
- Future trades per run: 0 uses the same count as your history, so one run resamples a history-sized future. Raise it to look further ahead.
- Simulated runs: 1,000 to 100,000 (default 10,000).
- Fewest history trades for a verdict: default 30.
Notes
- The script only reads the history. It never opens, changes or closes a trade, so you can run it next to live Expert Advisors.
- The random numbers start from a fixed seed, so running the script twice on the same history and inputs gives the same answer.
- Fewer than 30 trades, and the R-multiple distribution the sim draws from is itself noisy. Treat the numbers as a rough guide, not a verdict.
- A zero probability of ruin at a given risk level does NOT mean ruin is impossible; it means ruin did not occur in any of the simulated runs drawing from your past trades. Rare tail trades that never happened to you will not appear in the sim.
- YuRaLytics Trade Analyzer, free in the Market, runs this test alongside the edge-or-luck bootstrap, cost accounting and losing-streak checks for every Expert Advisor and symbol at once, in a chart panel.
- Edge or Luck, free in the Code Base, runs the companion test: whether your average trade is large enough to tell apart from luck.
- A browser version of this test, plus a losing-streak probability calculator and the full backtest write-ups the script was built around, live at yuratrading.com/tools/risk-of-ruin-calculator.
 GDS Renko RSI + MACD 4-Mode Demo EA
An educational MetaTrader 5 Expert Advisor with four RSI and MACD signal modes calculated on completed Renko bricks. Fixed-size Renko is built internally from Bid ticks. No external indicators, DLLs, custom symbols or offline charts are required.
 Spread Monitor
 — a simple information indicator for MetaTrader 5.
Prop Firm Guard - daily loss and max drawdown protection
Closes all trades and blocks new ones when your prop firm daily loss or maximum drawdown limit is reached.
Failed Breakout Detector
Marks breakouts of the recent trading range and the breakouts that fail (price closes back inside within a few bars). Closed bars only, alerts, buffers for iCustom.