Carsten Pflug
Carsten Pflug
4.8 (60)
  • Información
7+ años
experiencia
14
productos
117
versiones demo
9
trabajos
0
señales
0
suscriptores
Carsten Pflug Ha publicado el producto
Comentarios: 15
69.00 USD

Netsrac Correlation Trader (NCT) es una herramienta muy potente para operar con pares de divisas correlacionados positiva y negativamente con órdenes cubiertas.  1) Busca pares correlacionados positiva y negativamente 2) Muestra una señal, si los pares correlacionados no están en equilibrio 3) Puede "autotrade" algunos o todos los pares correlacionados con su configuración de los marcos de tiempo y los valores de la señal (manejar con cuidado) 4) Puede establecer el tamaño de lote correcto

Carsten Pflug
This is the fifth episode of a blog series on how to use the „Netsrac SR Dashboard" (SRD) to find trading opportunities. The SRD is designed to reduce your time in front of the monitor. It can find many setups for us. All we have to do is trade those setups...
Carsten Pflug
This is the fourth episode of a blog series on how to use the „Netsrac SR Dashboard" (SRD) to find trading opportunities. The SRD is designed to reduce your time in front of the monitor. It can find many setups for us. All we have to do is trade those setups...
Carsten Pflug
Carsten Pflug
Update of the Netsrac SR Dashboard to Version 1.9 is now available!

- New section: RSI (it is the last feature update for SR-Dashboard to stay consistently for my existing customers)
- Optical and performance enhancements

https://www.mql5.com/en/market/product/34855
Carsten Pflug
Carsten Pflug
New Version 1.70 of Netsrac SR Dashboard now available

- bugfix in score-calculation
- improvements in pattern-scanner

(With the SR Dashboard, you get a powerful tool to control some of the most important information in trading. Assemble a setup according to your strategy and get informed as soon as this setup is valid. Assign different points to selected conditions. Choose from Trend, Average Daily Range, Moving Averages, Pivot (Daily, Weekly, Monthly), Highs and Lows, and Candlestick Patterns.)

https://www.mql5.com/de/market/product/34855
Carsten Pflug
This is the fifth episode of a blog series on how to use the „Netsrac SR Dashboard" (SRD) to find trading opportunities. The SRD is designed to reduce your time in front of the monitor. It can find many setups for us. All we have to do is trade those setups...
Carsten Pflug
This is the second episode of a blog series on how to use the „Netsrac SR Dashboard“ to find trading opportunities. The SR Dashboard is designed to reduce your time in front of the monitor. It can find many setups for us. All we have to do is trade those setups...
Carsten Pflug
This is the first episode of a blog series on how to use the „Netsrac SR Dashboard“ to find trading opportunities. The SR Dashboard is designed to reduce your time in front of the monitor. It can find many setups for us. All we have to do is trade those setups...
Carsten Pflug
About With the SR Dashboard, you get a powerful tool to control some of the most important information in trading. Assemble a setup according to your strategy and get informed as soon as this setup is valid. Assign different points to selected conditions...
Carsten Pflug Ha publicado el producto
Comentarios: 4
59.00 USD

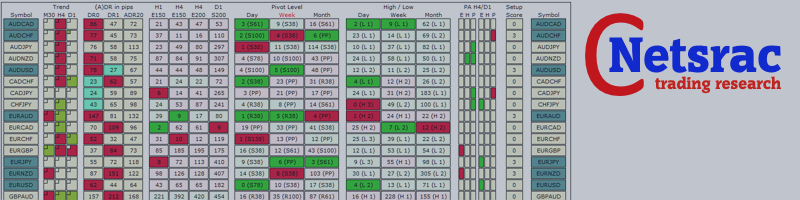
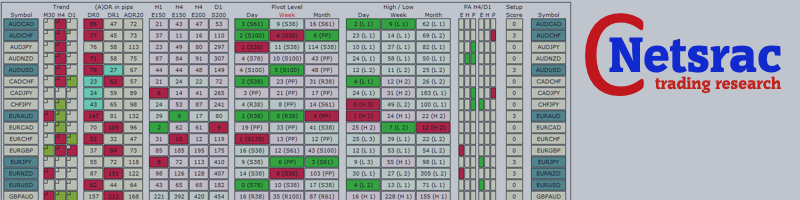
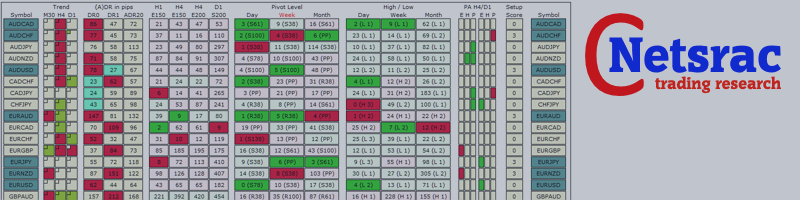
Con el Tablero SR, usted obtiene una poderosa herramienta para controlar parte de la información más importante en el trading. Montar una configuración de acuerdo a su estrategia y ser informado tan pronto como esta configuración es válida. Asigne puntuaciones a condiciones definidas y deje que el Tablero las encuentre. Elija entre Tendencia, Rango Medio Diario, RSI, Medias Móviles, Pivote (Diario, Semanal, Mensual), Máximos y Mínimos, Patrones de Velas. Nota: Este indicador no se puede

Carsten Pflug Ha publicado el producto
Comentarios: 1
FREE

El indicador SuPrEs indica la distancia hasta la siguiente línea horizontal cuyo nombre comienza por el prefijo configurado (ver Opciones). utilización Dibuje soportes y resistencias en el gráfico y deje que el indicador le avise en cuanto se sobrepase una distancia configurada. Utilice el prefijo para proporcionar alarmas para otras líneas, así como para las líneas estándar (véase la captura de pantalla con el indicador de pivote). Visualización del indicador El indicador muestra la distancia a

Carsten Pflug Ha publicado el producto
Comentarios: 3
40.00 USD

El cuadro de mandos debe ayudar a obtener una visión rápida de las correlaciones de los distintos activos entre sí. Para ello, las series de valores se comparan según el método de Pearson. El resultado es el valor de la correlación (en porcentaje). Con el nuevo modo de activo único, puede ver inmediatamente qué símbolos tienen la mayor correlación positiva o negativa. Esto evita que accidentalmente asuma un riesgo en sus operaciones con símbolos altamente correlacionados. Utilización Existen

Carsten Pflug Ha publicado el producto
Comentarios: 14
39.00 USD

As a tribute to all the "quants" and "quantums" in this market who promise to make you rich quickly and easily, my ADR Dashboard is now just $39 — until summer is over, or perhaps a little longer. It won't make you rich quick, but it gives you a perfect view of the potential trading ranges of an asset. El objetivo del panel de control es ofrecer una visión general rápida de la evolución diaria, semanal y mensual de los activos configurados. En el «modo de activo único», el panel de control

Carsten Pflug
Se ha registrado en MQL5.community
12