Issam Kassas
Issam Kassas
4.6 (1197)
  • Información
4 años
experiencia
36
productos
1268
versiones demo
0
trabajos
0
señales
0
suscriptores
I’m Issam Kassas, the developer behind Issam Algo. I build MetaTrader 5 indicators and Expert Advisors for chart analysis and trading automation.

Current OFFER: Buy Smart Trend Trading System MT5 and receive Smart Universal Expert Adviser MT5 as a free bonus.

Smart Trend Trading System MT5:
https://www.mql5.com/en/market/product/103515

Smart Universal Expert Adviser MT5:
https://www.mql5.com/en/market/product/104039

After purchasing Smart Trend Trading System, message me here on MQL5 to claim your bonus.

For product questions, setup guidance, or technical support, contact me directly through MQL5 messages.
Issam Kassas
Issam Kassas
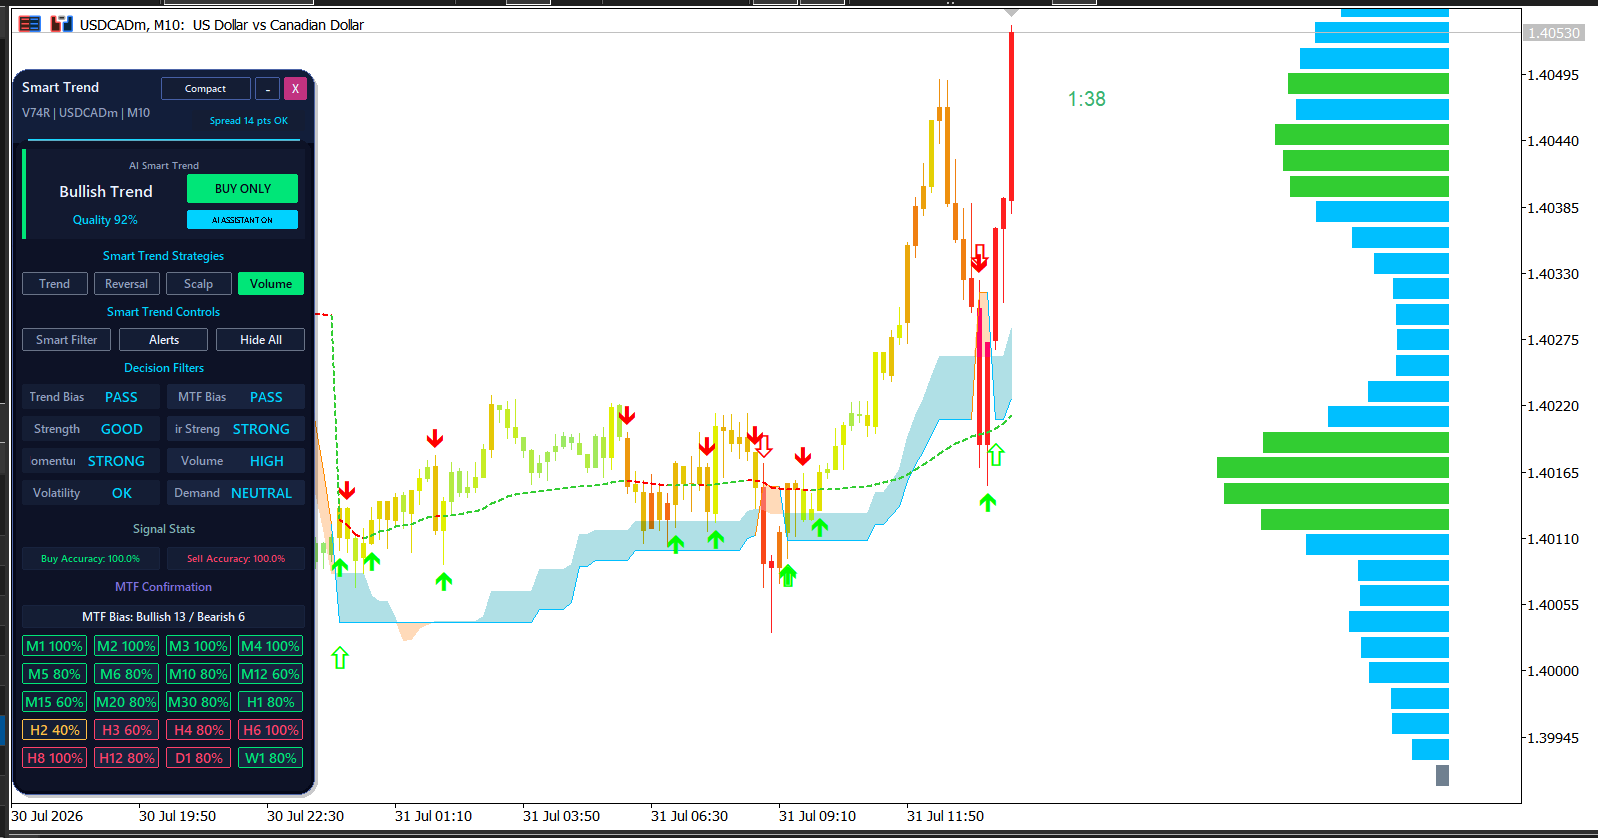
Read volume context alongside price structure. This historical 30-31 July 2026 USDCADm M10 Smart Trend example shows Volume selected, Bullish Trend, BUY ONLY and Quality 92%, with a price-level histogram at the right. Momentum reads STRONG and Volume HIGH, while the MTF summary shows Bullish 13 / Bearish 6. A sharp drop and rebound appear near the latest candles, so a bullish label alone is not a complete entry plan. Check signal timing, nearby levels and invalidation before defining position risk. Displayed accuracy figures are interface statistics, not verified live returns or guarantees. Test settings on demo first.

https://www.mql5.com/en/market/product/103515
Issam Kassas
Issam Kassas
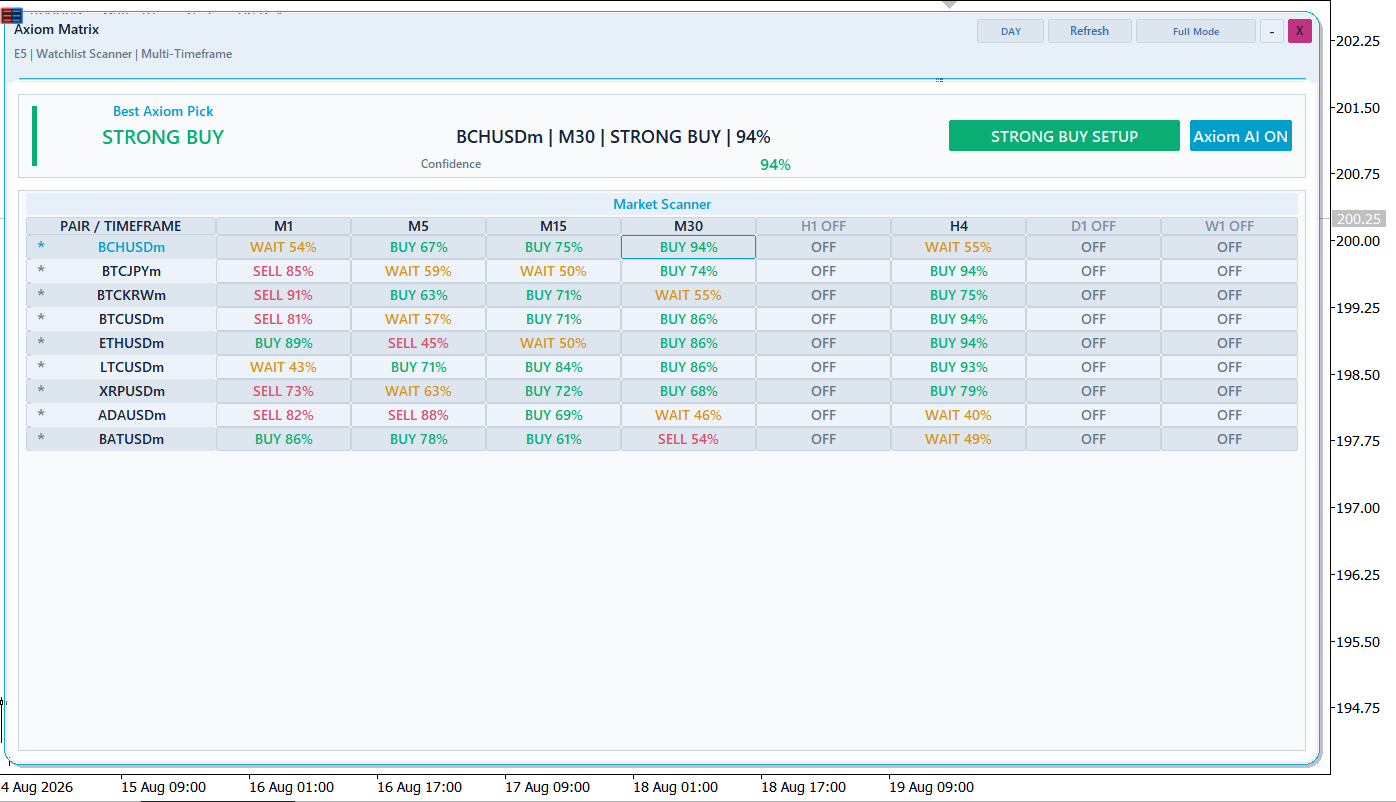
Check which timeframes are enabled before comparing a scanner. This historical August 2026 Axiom Matrix example highlights BCHUSDm M30 as STRONG BUY with 94% displayed confidence. The same symbol reads WAIT on M1 and H4, while the H1, D1 and W1 columns are OFF. Other crypto rows contain mixed BUY, SELL and WAIT readings. An OFF column is not a neutral market signal, and one highlighted cell is not a complete entry plan. Inspect the underlying chart, data, timing and invalidation before defining risk. Displayed percentages are scanner readings, not probabilities of profit or verified live returns. Axiom Matrix is an analysis dashboard and does not place trades.

https://www.mql5.com/en/market/product/182954
Issam Kassas
Issam Kassas
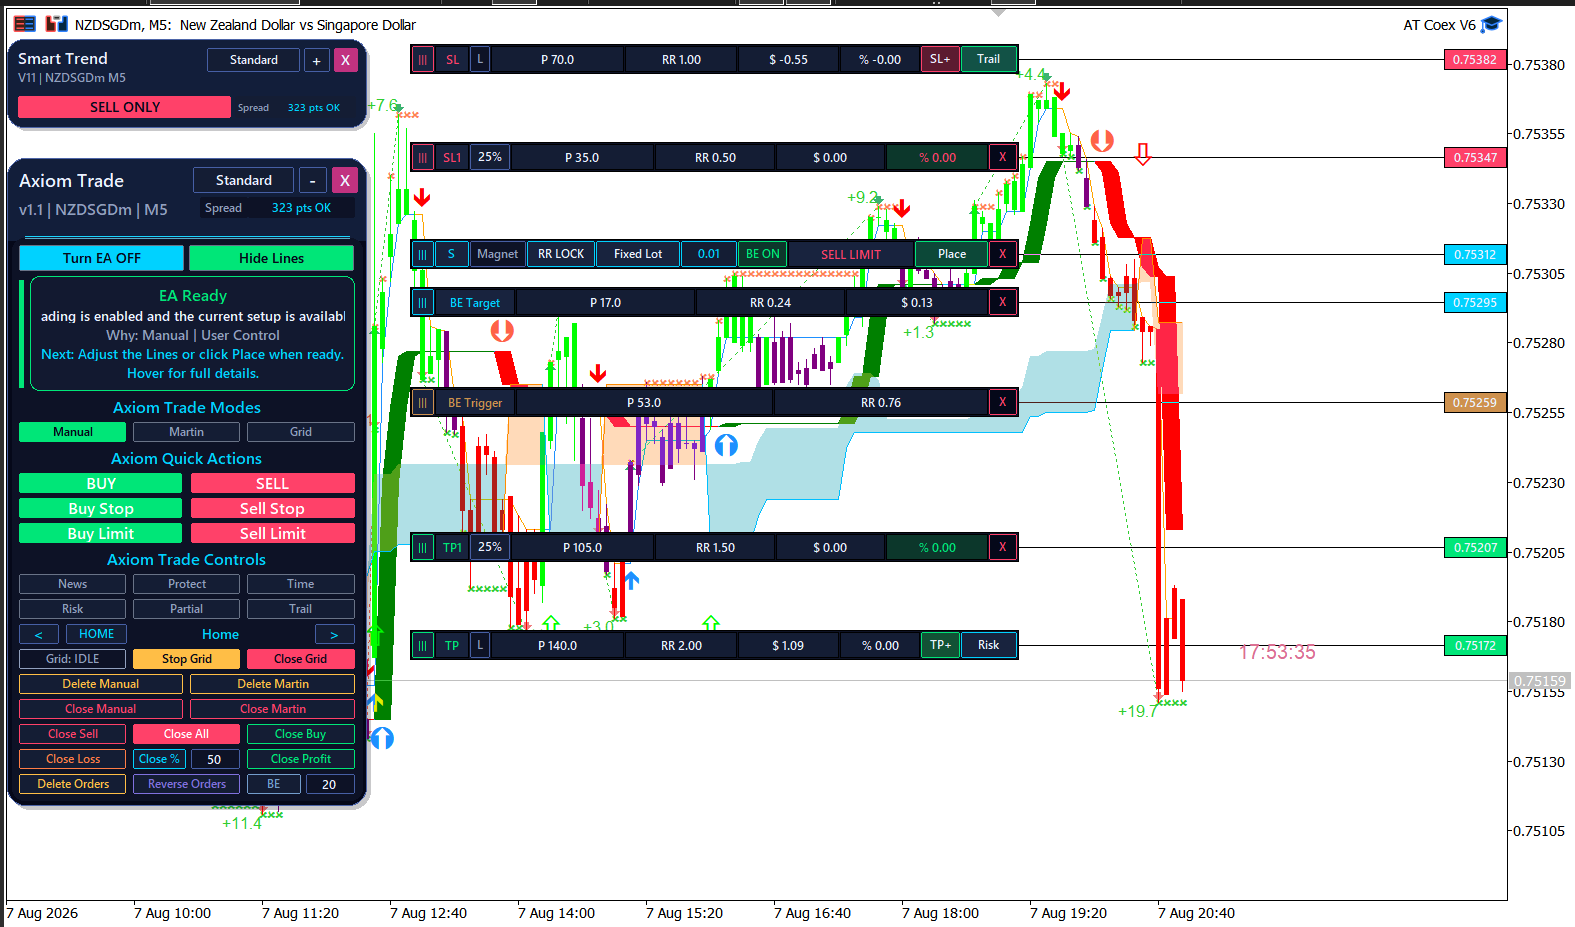
Separate the indicator reading from the order plan. This historical 7 August 2026 NZDSGDm M5 example shows Smart Trend V11 reading SELL ONLY alongside Axiom Trade in Manual mode. The order toolbar displays a SELL LIMIT plan with fixed lot 0.01, stop and target lines, partial-exit levels and break-even controls. EA Ready means the displayed workflow is available; it does not prove an order has been placed. Review entry, stop distance, position size and total risk before execution. The values and chart annotations are examples, not recommended settings or verified live returns. Test the configuration on demo first.

https://www.mql5.com/en/market/product/184566
Issam Kassas
Issam Kassas
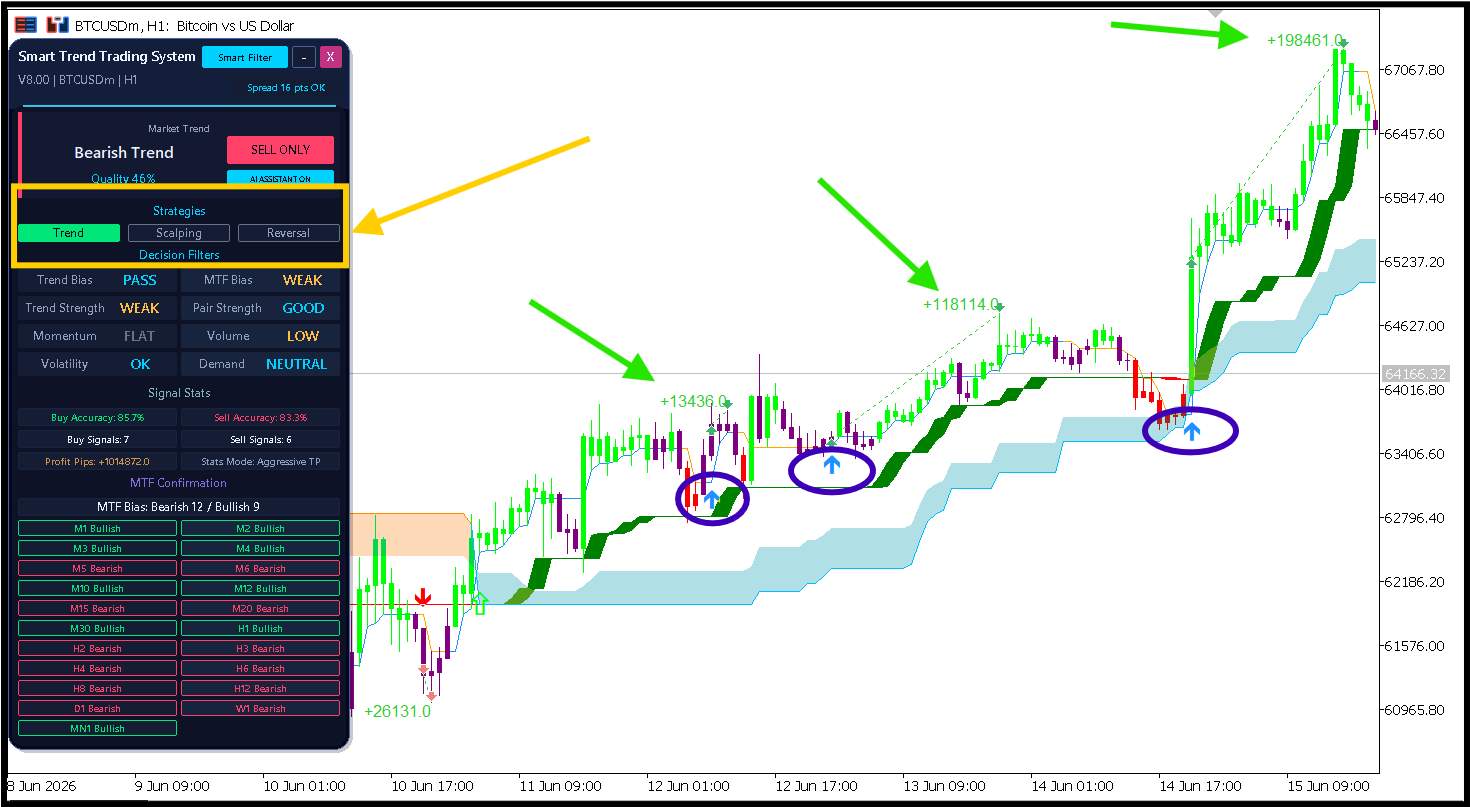
Compare a panel reading with the chart period it describes. This historical 8-15 June 2026 BTCUSDm H1 Smart Trend V8 example highlights earlier upward moves and buy arrows, while the panel reads Bearish Trend, SELL ONLY and Quality 46%, with Trend selected. Trend Strength and MTF Bias read WEAK, Momentum FLAT and Volume LOW. Earlier chart examples do not establish the direction of the next trade. Check signal timing, nearby price structure and invalidation before defining risk. Displayed accuracy and profit figures are interface statistics, not verified live returns or guarantees. Test settings on demo first.

https://www.mql5.com/en/market/product/103515
Issam Kassas
Issam Kassas
Check combined exposure when more than one position is open. This historical 8-9 September 2026 XAUUSDm M4 Gold Notch example shows Working and EA ON, two buy entries, stop and target lines, Take Profit 4 selected, Break Even Off and compound percentage-risk settings. The panel displays Risk 1.00% and Next Trade Risk $1000. These are example settings, not recommended values. Multiple entries can increase total risk; review position sizes, broker-side stops and account exposure before enabling automation. Displayed performance estimates are not verified live returns or guarantees. Test the configuration on demo first.

https://www.mql5.com/en/market/product/194809
Issam Kassas
Issam Kassas
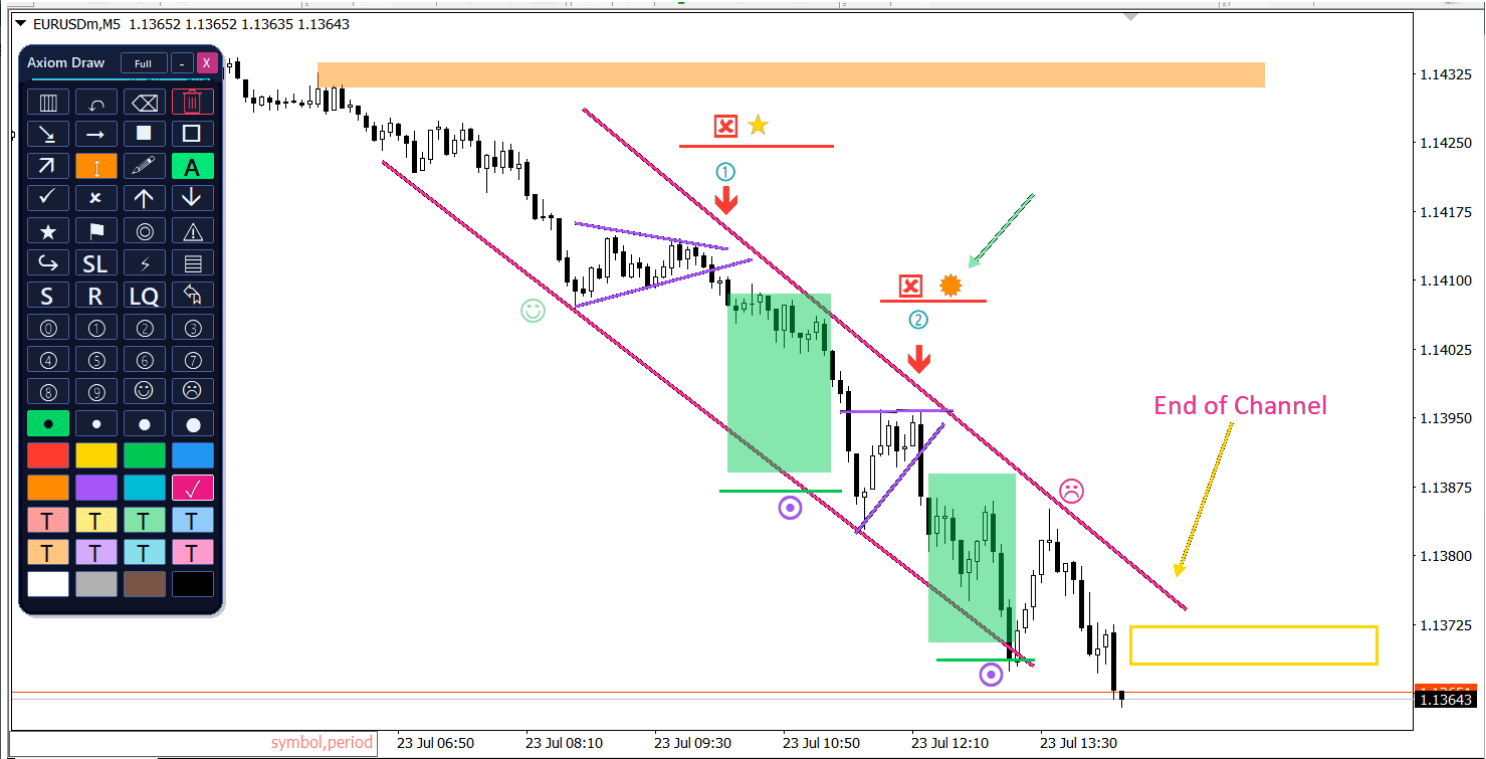
Separate chart annotations from trade signals. This EURUSDm M5 Axiom Draw example marks a descending channel, small consolidation triangles, shaded areas and numbered arrows. The End of Channel label marks the drawn boundary; it does not prove that price must reverse there. Use drawings to record a hypothesis, its invalidation and the price area you will review next. Axiom Draw is an annotation and measurement utility, not a signal generator or order executor. The marked moves are historical examples, not verified trading results or a current recommendation. Test your process on demo first.

https://www.mql5.com/en/market/product/186356
Issam Kassas
Issam Kassas
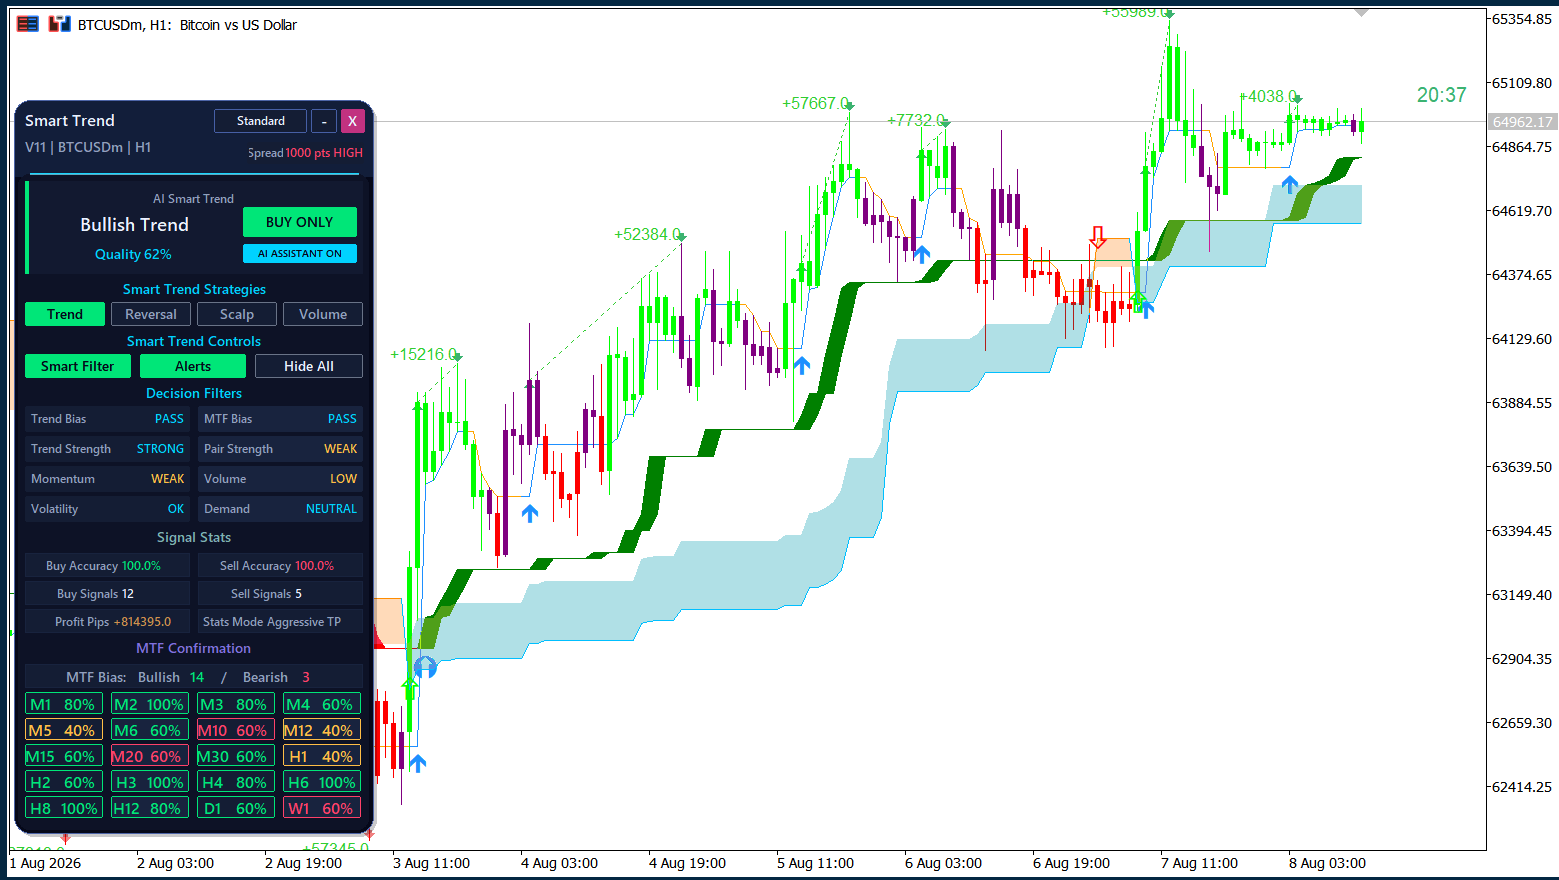
Read a bullish trend alongside its weaker filters. This historical 1-8 August 2026 BTCUSDm H1 Smart Trend V11 example shows Bullish Trend, BUY ONLY and Quality 62%, with Trend selected. Trend Strength reads STRONG, while Momentum and Pair Strength read WEAK and Volume reads LOW. The MTF summary shows Bullish 14 / Bearish 3, and spread is flagged HIGH. Mixed conditions call for checking signal timing, price structure and trading costs before defining entry, invalidation and risk. Displayed accuracy and profit figures are interface statistics, not verified live returns or guarantees. Test settings on demo first.

https://www.mql5.com/en/market/product/103515
Issam Kassas
Issam Kassas
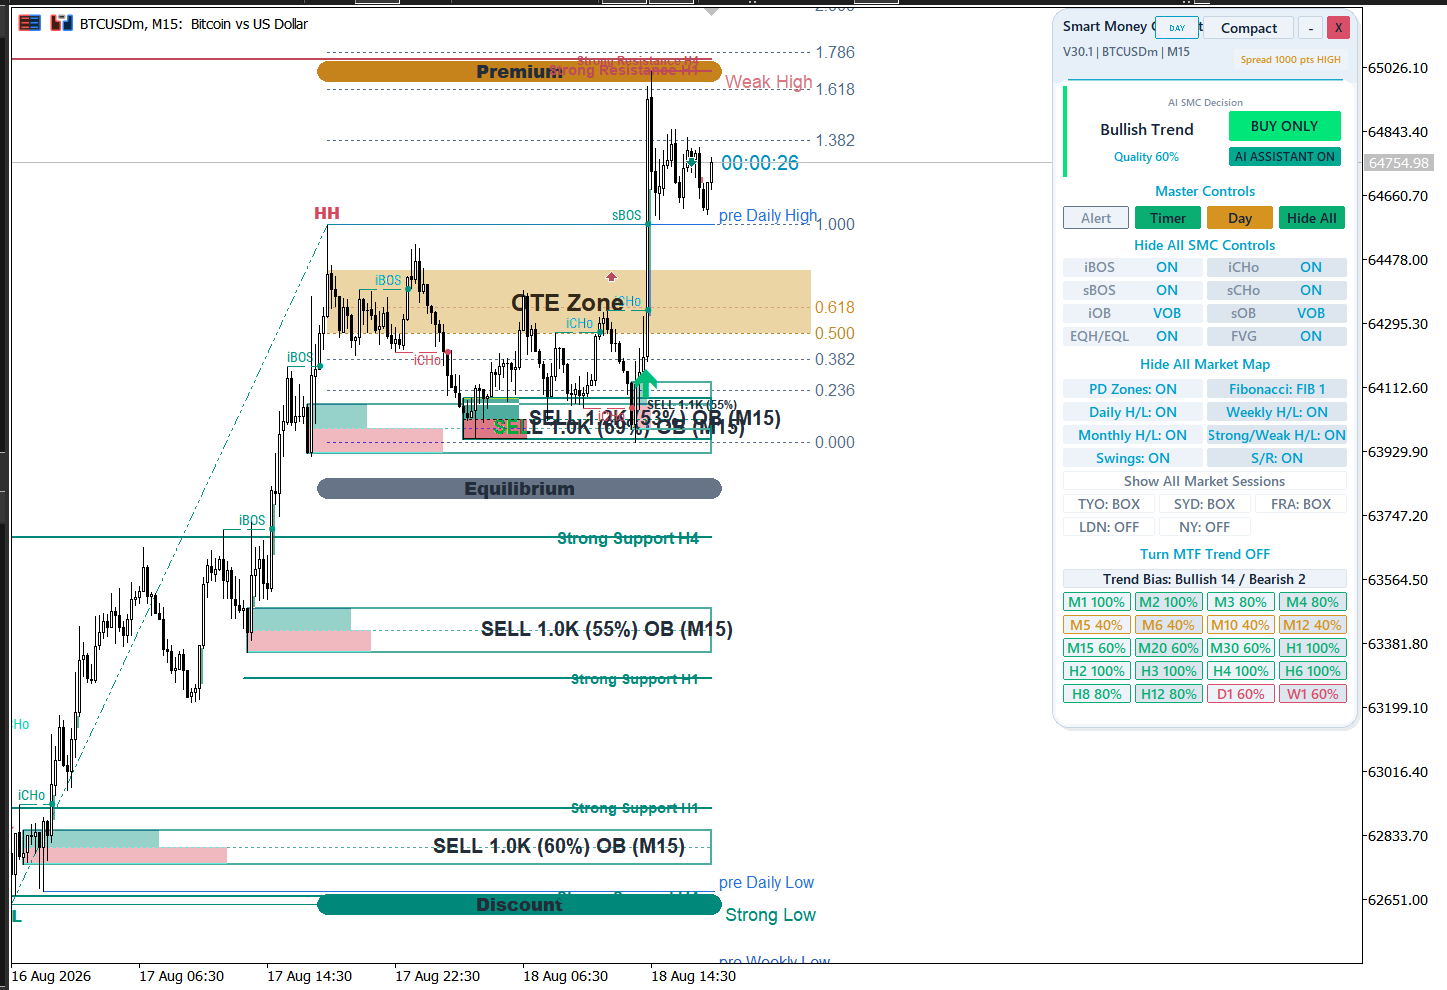
Compare direction with nearby structure and execution costs. This historical 16-18 August 2026 BTCUSDm M15 Smart Price Action Concepts example shows Bullish Trend and BUY ONLY, with MTF Bias Bullish 14 / Bearish 2, while the spread warning reads HIGH. Price has advanced toward a marked premium/resistance area and Weak High, above the prior daily high. The chart also marks an OTE Zone, order blocks, equilibrium and discount. A bullish label does not guarantee a breakout, and structure labels do not prove institutional activity. Define entry, invalidation and position risk before acting. Displayed quality and zone percentages are interface readings, not verified returns. Test settings on demo first.

https://www.mql5.com/en/market/product/103105
Issam Kassas
Issam Kassas
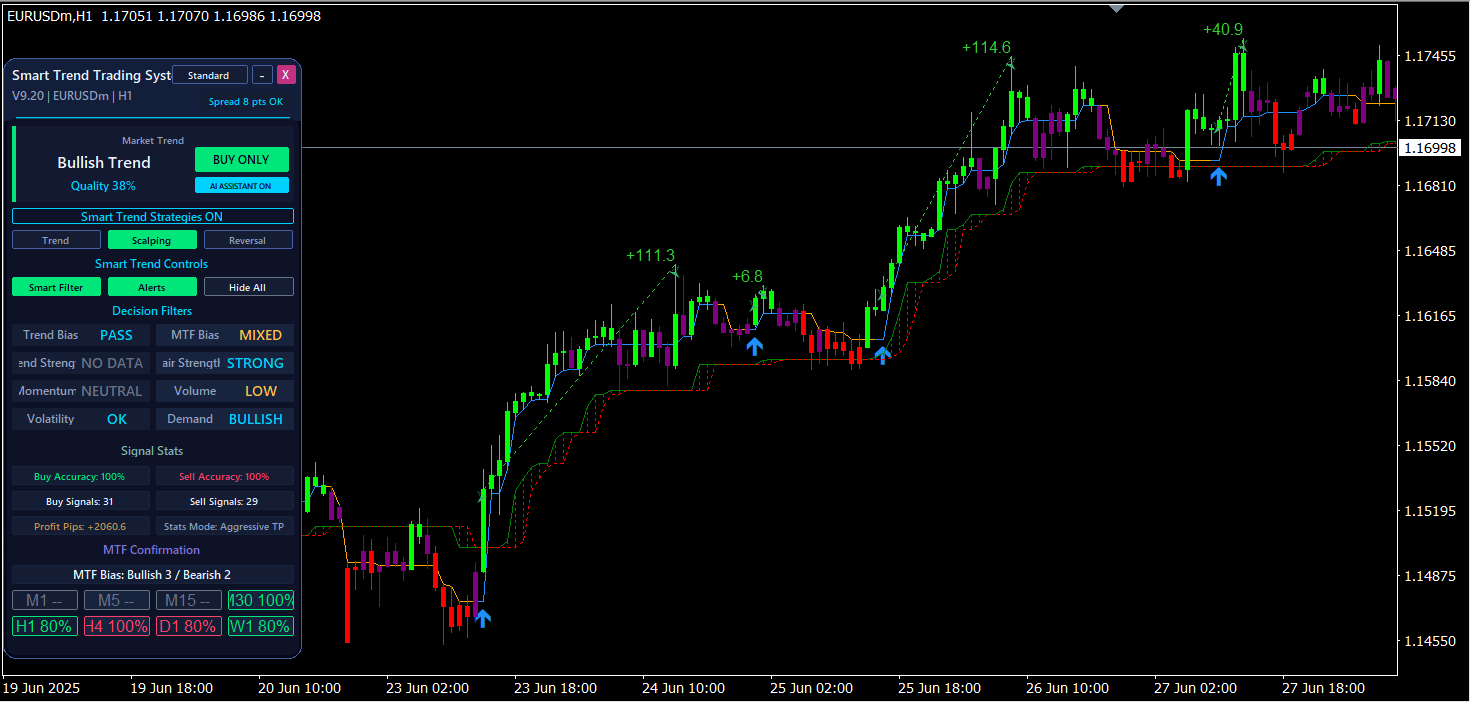
A bullish label can coexist with mixed confirmation. This historical 19-27 June 2025 EURUSDm H1 Smart Trend example shows Bullish Trend and BUY ONLY, while MTF Bias reads MIXED, momentum NEUTRAL and volume LOW. Trend strength reads NO DATA, and the MTF summary shows Bullish 3 / Bearish 2. The chart includes a rising move, pullbacks and a pause near recent highs. Check which filters support the setup and which remain unresolved before defining entry, invalidation and position risk. Displayed quality, accuracy and pip figures are interface statistics, not verified live returns or guarantees. Test settings on demo first.

https://www.mql5.com/en/market/product/103515
Issam Kassas
Issam Kassas
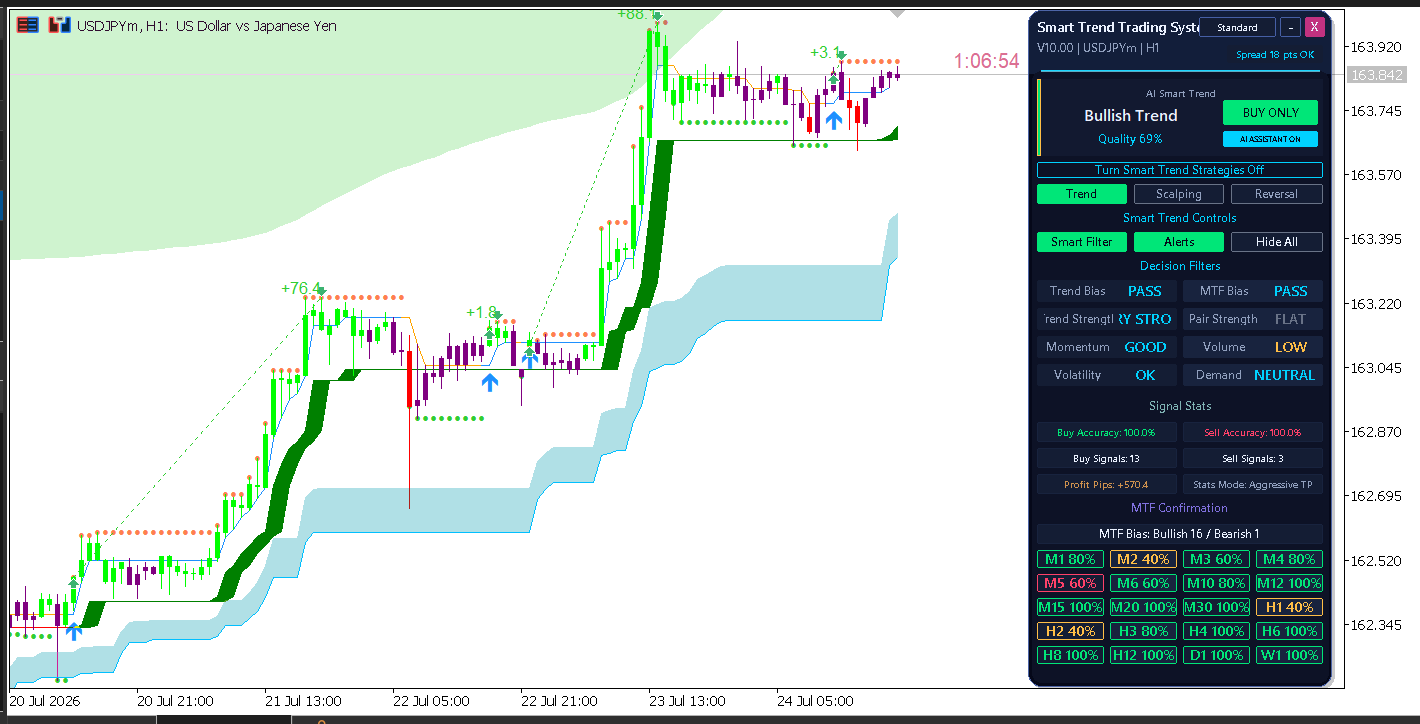
Read the filters behind a bullish label. This historical 20-24 July 2026 USDJPYm H1 Smart Trend example shows Bullish Trend and BUY ONLY after a strong rise. Trend Bias and MTF Bias read PASS, momentum GOOD and volume LOW; the MTF summary shows Bullish 16 / Bearish 1. The chart also contains pullbacks and a sideways pause near the recent high. Agreement across timeframes does not define an entry or remove reversal risk. Compare signal timing with nearby price structure, then define invalidation and position risk. Quality, accuracy and displayed pip figures are interface statistics, not verified live returns or guarantees. Test settings on demo first.

https://www.mql5.com/en/market/product/103515
Issam Kassas
Issam Kassas
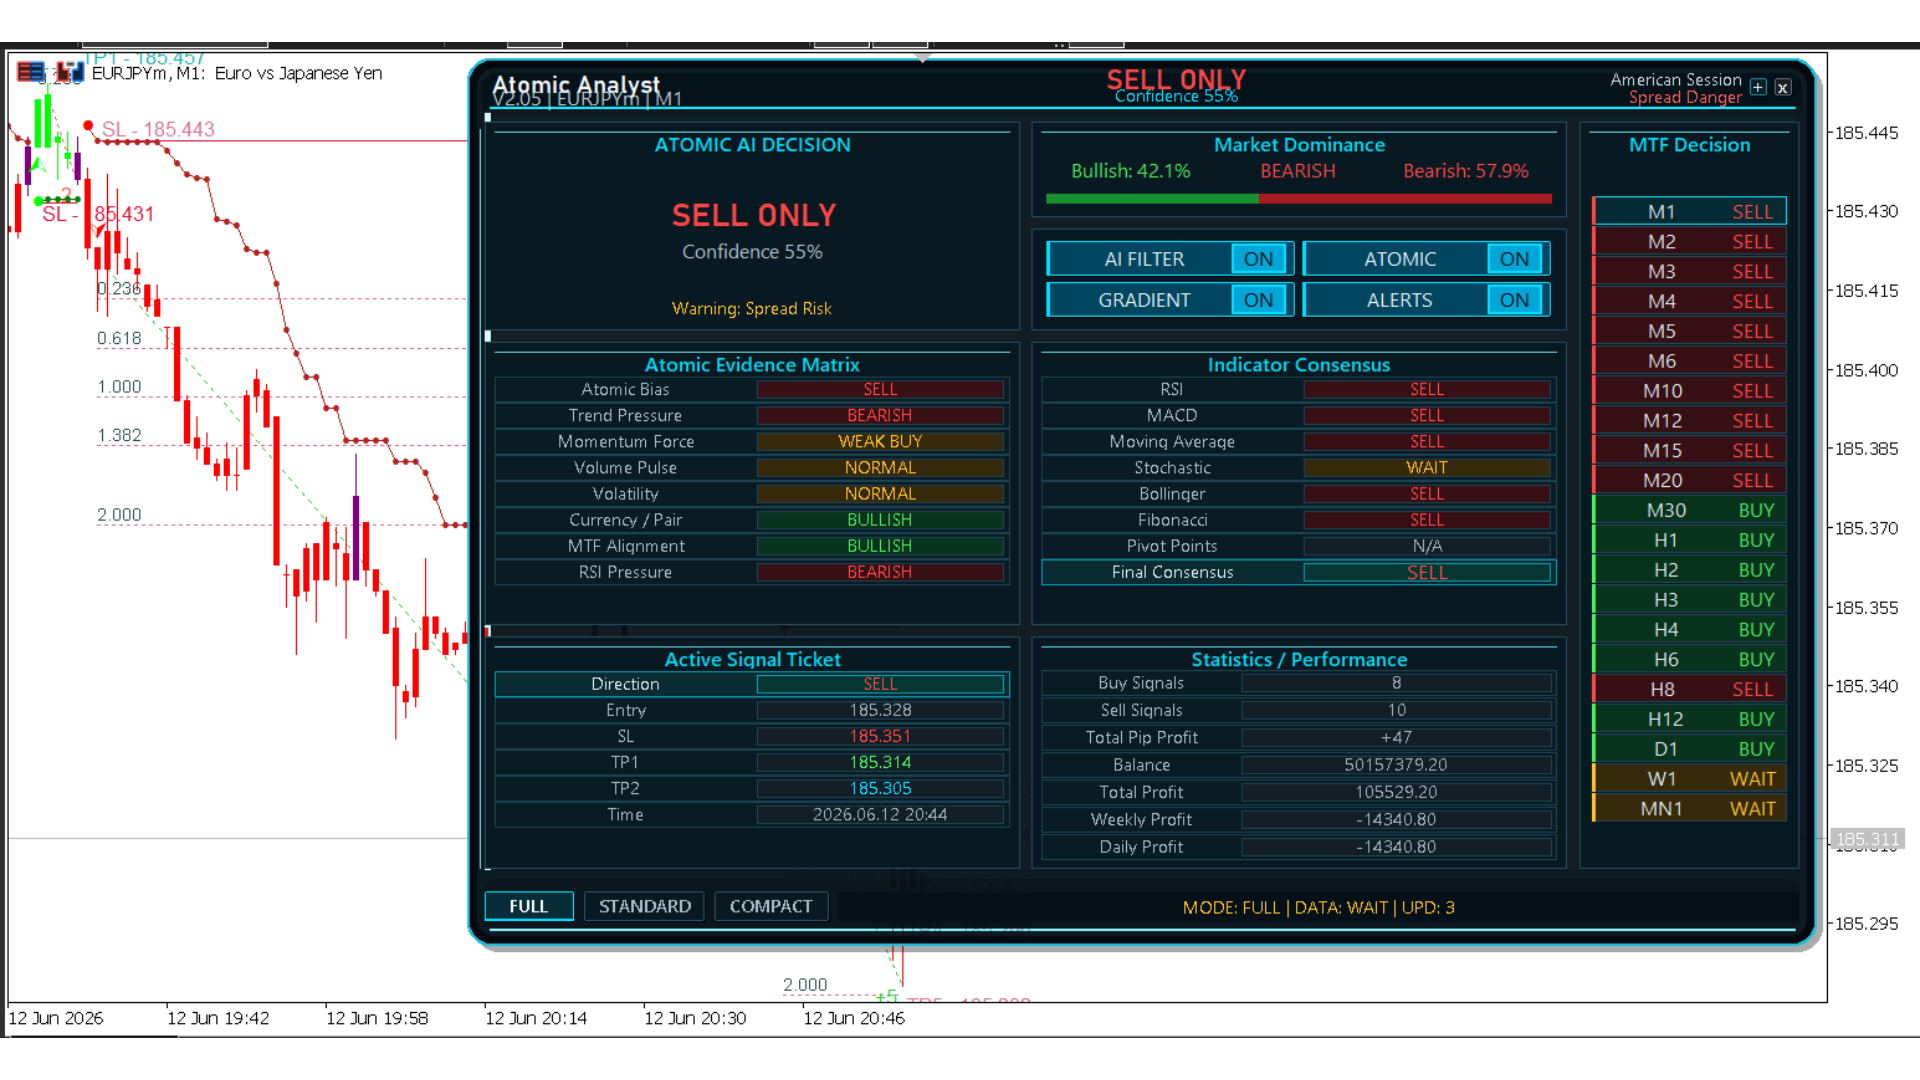
Check execution warnings even when several indicators agree. This historical 12 June 2026 EURJPYm M1 Atomic Analyst example shows SELL ONLY with 55% confidence and Warning: Spread Risk. The evidence matrix reads WEAK BUY for momentum, while the final indicator consensus reads SELL. The MTF table contains both SELL and BUY readings, with WAIT on W1 and MN1. A displayed signal ticket is not a complete reason to enter. Compare the spread, timeframe context and nearby price structure before defining risk and invalidation. Confidence and performance figures are interface statistics, not probabilities of profit or verified live returns. Test settings on demo first.

https://www.mql5.com/en/market/product/114662
Issam Kassas
Issam Kassas
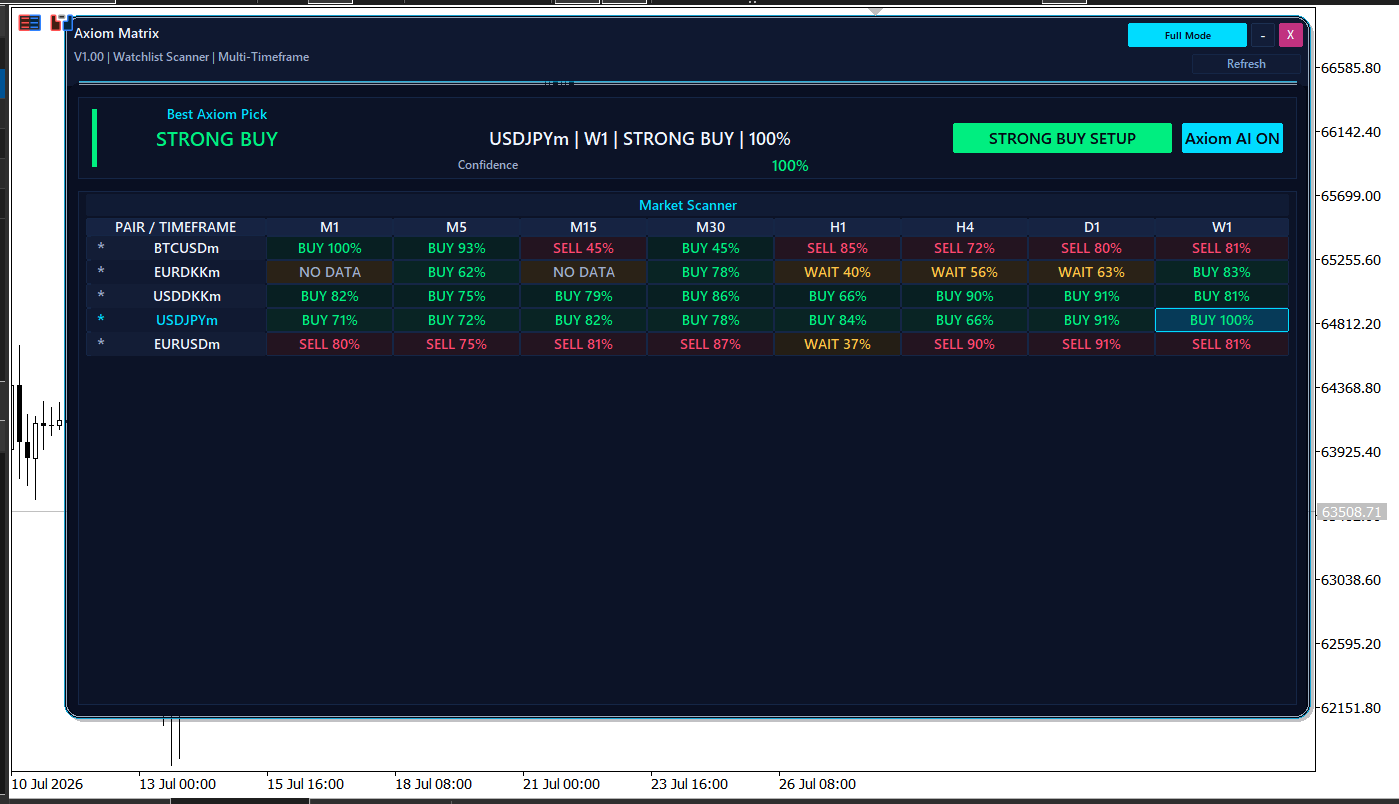
Use a scanner to compare timeframes, then inspect the underlying chart. This historical Axiom Matrix example highlights USDJPYm W1 as STRONG BUY with 100% displayed confidence. BTCUSDm has BUY readings on M1 and M5 but SELL readings on H1 through W1; EURUSDm is mostly SELL with WAIT on H1. EURDKKm also has NO DATA cells. These differences show why one highlighted cell is not a complete trading plan. Check data availability, timeframe context, entry and invalidation before defining risk. Displayed percentages are scanner readings, not probabilities of profit or verified live returns. Axiom Matrix is an analysis dashboard and does not place trades.

https://www.mql5.com/en/market/product/182954
Issam Kassas
Issam Kassas
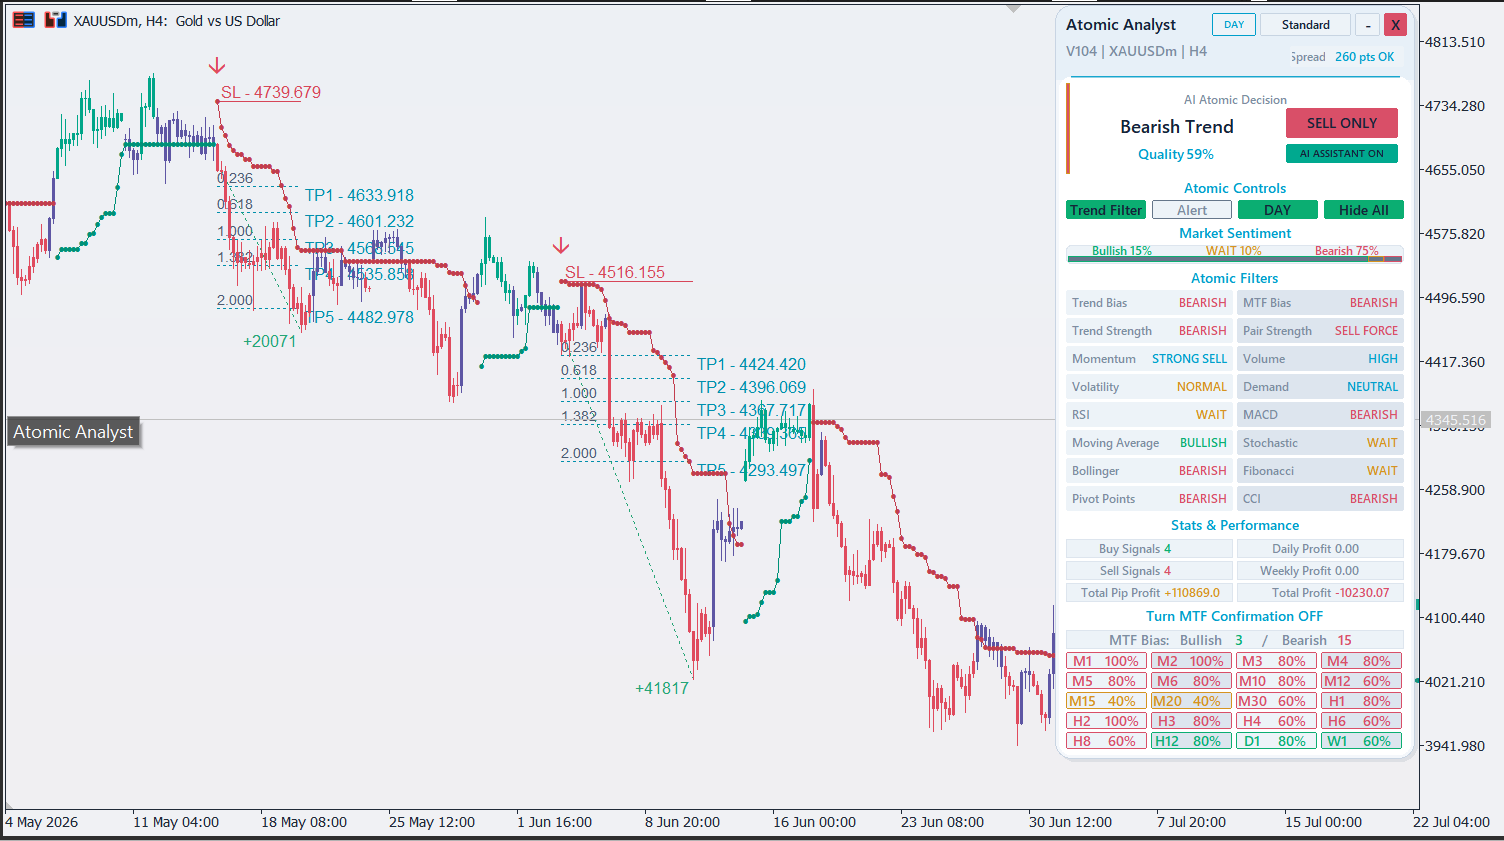
Compare the full filter panel with price structure before choosing an entry. This historical May-July 2026 XAUUSDm H4 Atomic Analyst example shows Bearish Trend and SELL ONLY. Momentum reads STRONG SELL and volume HIGH, while Moving Average reads BULLISH and RSI, Stochastic and Fibonacci read WAIT. The MTF summary shows Bullish 3 / Bearish 15. Price declines through displayed stop and target structures with sharp rebounds along the way. Mixed readings still require a defined risk limit and invalidation. Quality percentages and point or profit annotations are interface statistics, not verified live returns or guarantees. Test settings on demo first.

https://www.mql5.com/en/market/product/114662
Issam Kassas
Issam Kassas
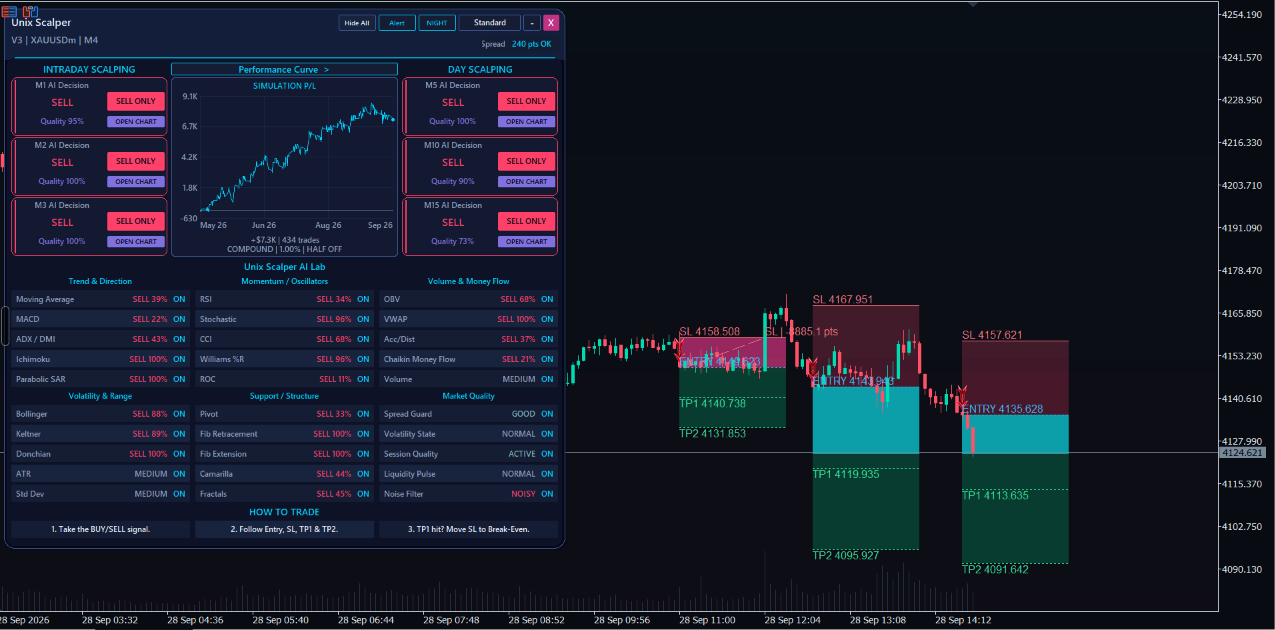
Keep a simulation curve separate from an entry decision. This historical 28 September 2026 XAUUSDm M4 UNIX Scalper V3 example shows SELL readings across the displayed intraday and day-scalping timeframes, with Entry, Stop Loss, TP1 and TP2 levels on the chart. Its performance panel is explicitly labelled SIMULATION P/L. A rising simulated curve and high quality readings do not verify live returns or guarantee the next setup. Compare the planned stop distance, position size, spread and total exposure with your risk limit. Review losing periods and test settings on demo before considering live use.

https://www.mql5.com/en/market/product/190882
Issam Kassas
Issam Kassas
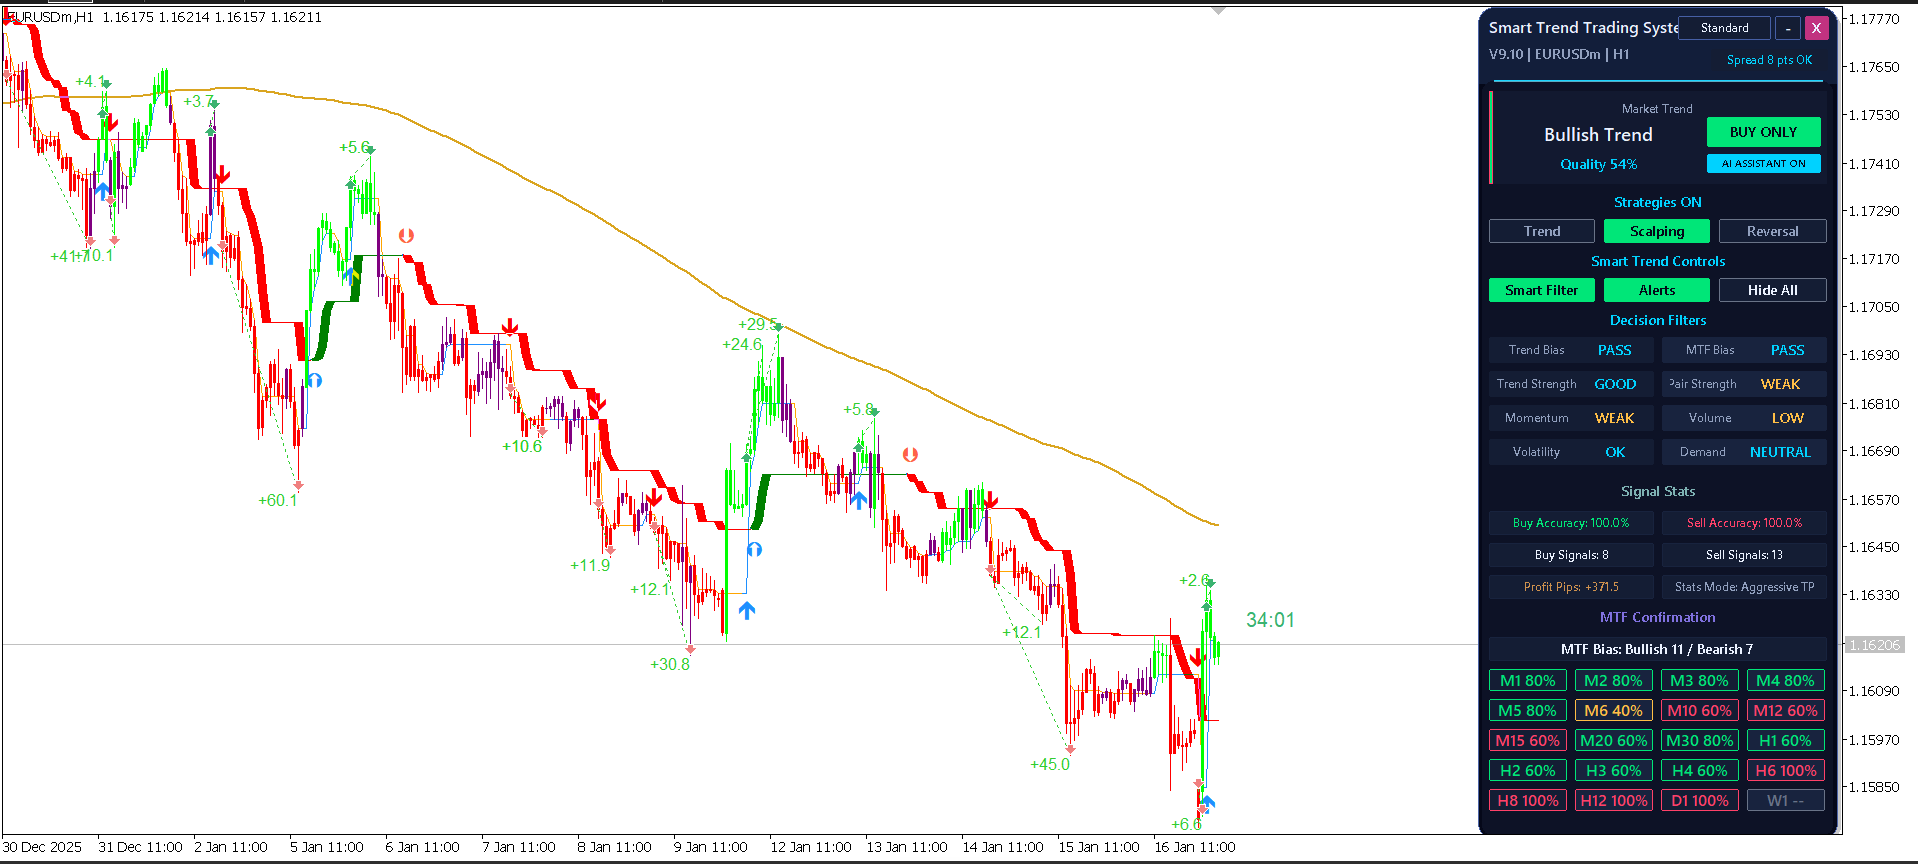
Read the current panel in the context of the wider chart. This historical EURUSDm H1 Smart Trend V9.10 example shows a broad decline from late December into January, while the panel reads Bullish Trend, BUY ONLY and Quality 54%, with Scalping selected. Momentum and Pair Strength read WEAK, Volume LOW, and the MTF summary shows Bullish 11 / Bearish 7. A directional label alone does not establish a complete entry. Check signal timing, price structure and invalidation before defining risk. Displayed accuracy and profit figures are interface statistics, not verified live returns or guarantees. Test settings on demo first.

https://www.mql5.com/en/market/product/103515
Issam Kassas
Issam Kassas
Plan the loss before following a sell signal. This historical 1 September 2026 XAUUSDm M3 UNIX Scalper example shows SELL ONLY and TRADE ON, with marked entries, Stop Loss, TP1 and TP2 levels across a falling market. Compare the distance to the stop with the intended target and position size before considering an entry. A target label or displayed points figure is not a verified live return. The example illustrates a chart layout, not a current trade recommendation. Check spread and broker conditions, define total risk and test the configuration on demo first.

https://www.mql5.com/en/market/product/190882
Issam Kassas
Issam Kassas
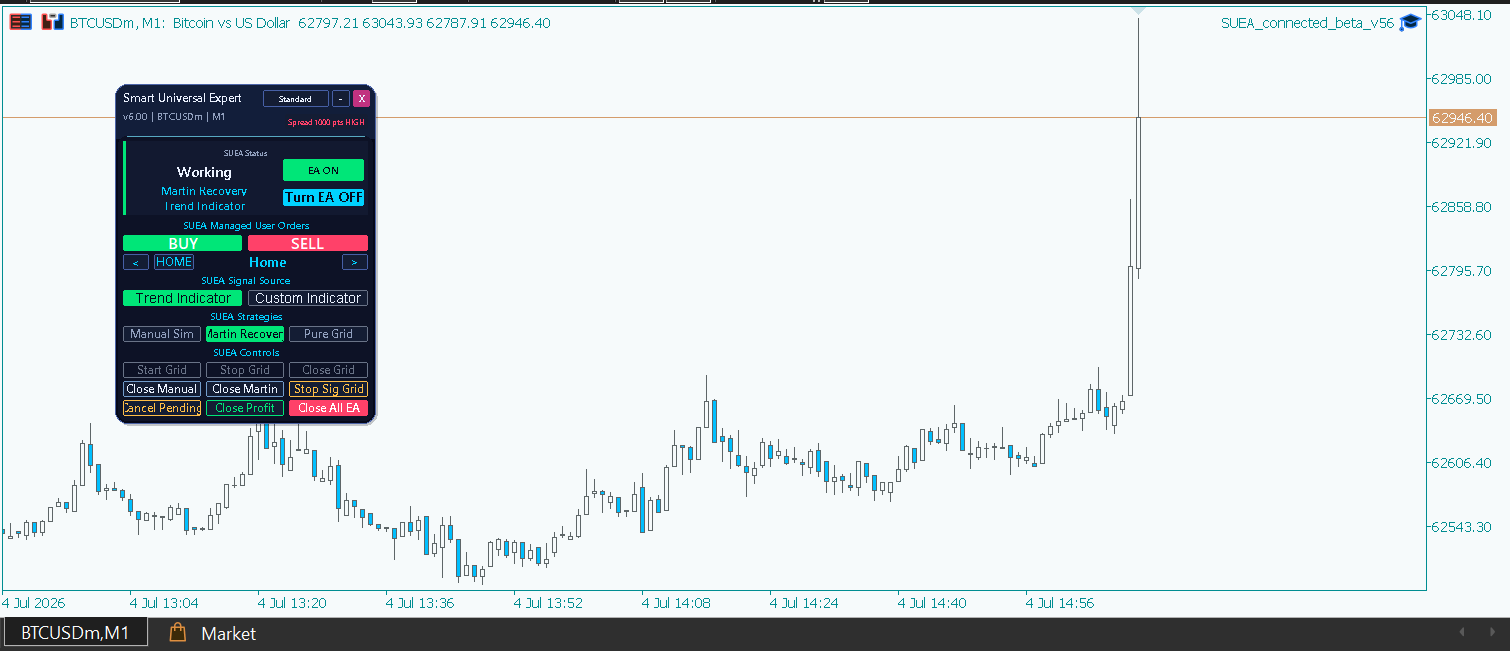
Read the operating state before interpreting a price move. This historical 4 July 2026 BTCUSDm M1 Smart Universal Expert example shows Working, EA ON, Trend Indicator selected and Martin Recovery selected, alongside a sharp upward move. The panel also warns that spread is HIGH. An enabled EA and a moving chart do not establish a profitable trade or controlled exposure. Check the signal connection, spread limit, position sizing and total basket risk before enabling automation. Recovery modes can increase exposure and drawdown. The displayed controls are an example, not recommended settings. Test the complete configuration on demo first.

https://www.mql5.com/en/market/product/104039
Issam Kassas
Issam Kassas
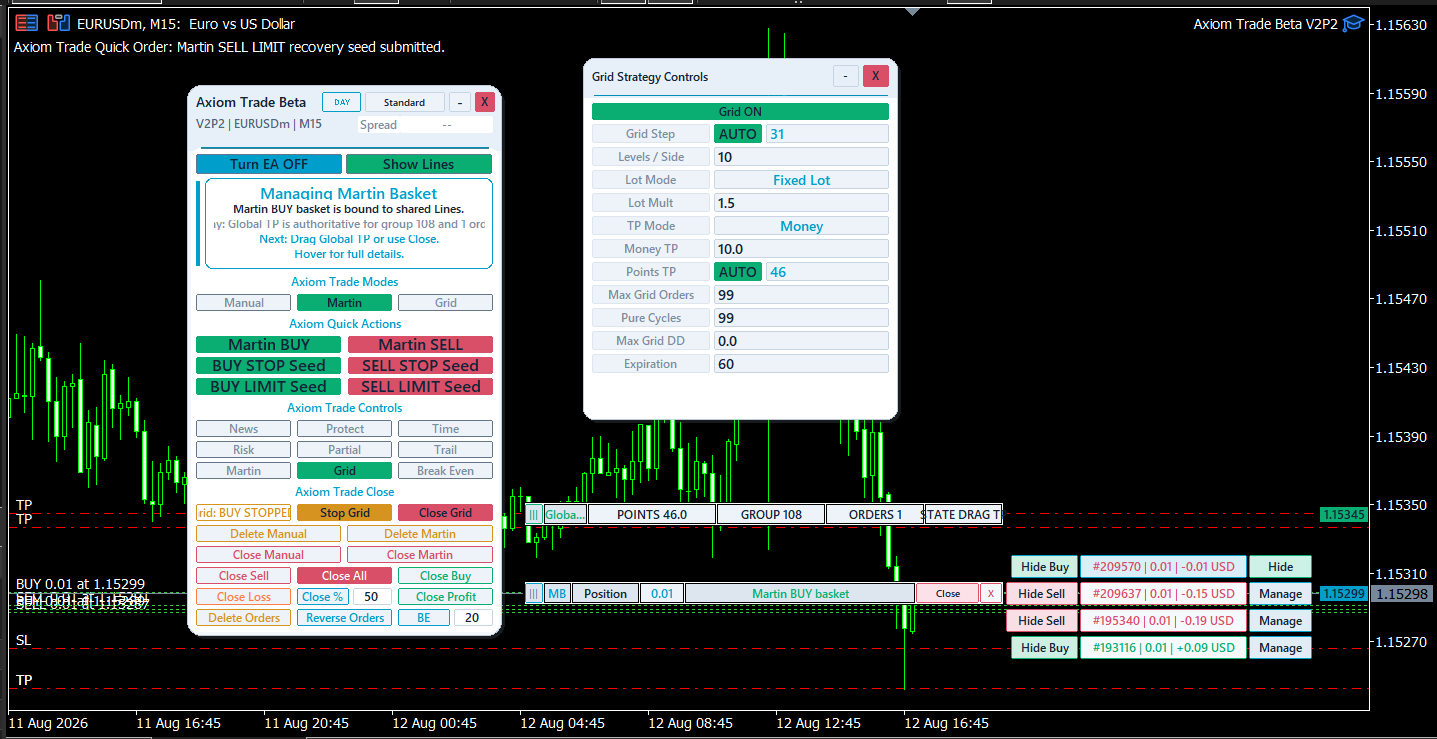
Read the active basket separately from the settings window. This historical 11-12 August 2026 EURUSDm M15 Axiom Trade example shows Managing Martin Basket with Martin mode selected, while a separate Grid Strategy Controls window is open. That window displays Grid ON, Fixed Lot mode and Money TP mode, yet the main panel also shows a stopped grid status. A control window alone is not enough to identify which workflow is active. Review the basket, open orders, shared target and actual strategy status before changing settings. Grid and recovery modes can increase exposure and drawdown; define total risk and a clear loss limit. The values shown are examples, not recommendations. Test on demo first.

https://www.mql5.com/en/market/product/184566
Issam Kassas
Issam Kassas
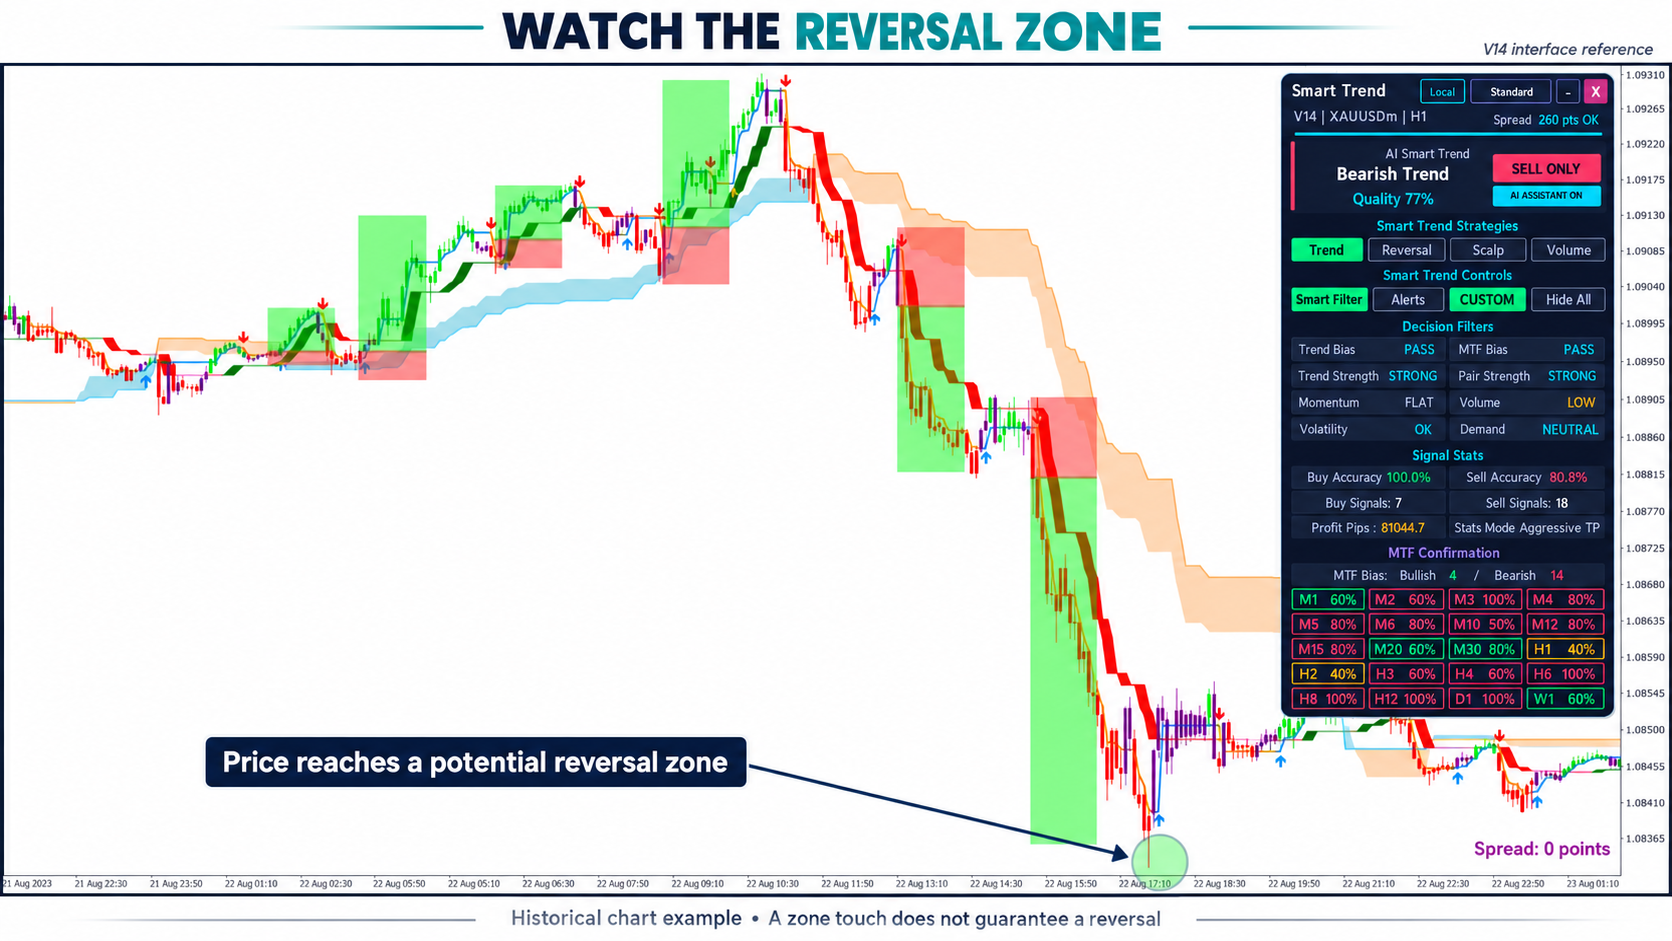
A reversal zone is a place to reassess, not a promise that price will turn. This historical Smart Trend illustration highlights an area near the low after a sharp decline, alongside arrows, colored trend bands and shaded examples. The V14 panel is an interface reference, so its readings should not be treated as synchronized with the background chart. Before planning an entry, check signal timing, nearby structure and where the idea becomes invalid. Use that stop distance to define position risk. Historical accuracy and pip figures are interface statistics, not verified live returns or guarantees. Test settings on demo first.

https://www.mql5.com/en/market/product/103515
Issam Kassas
Issam Kassas
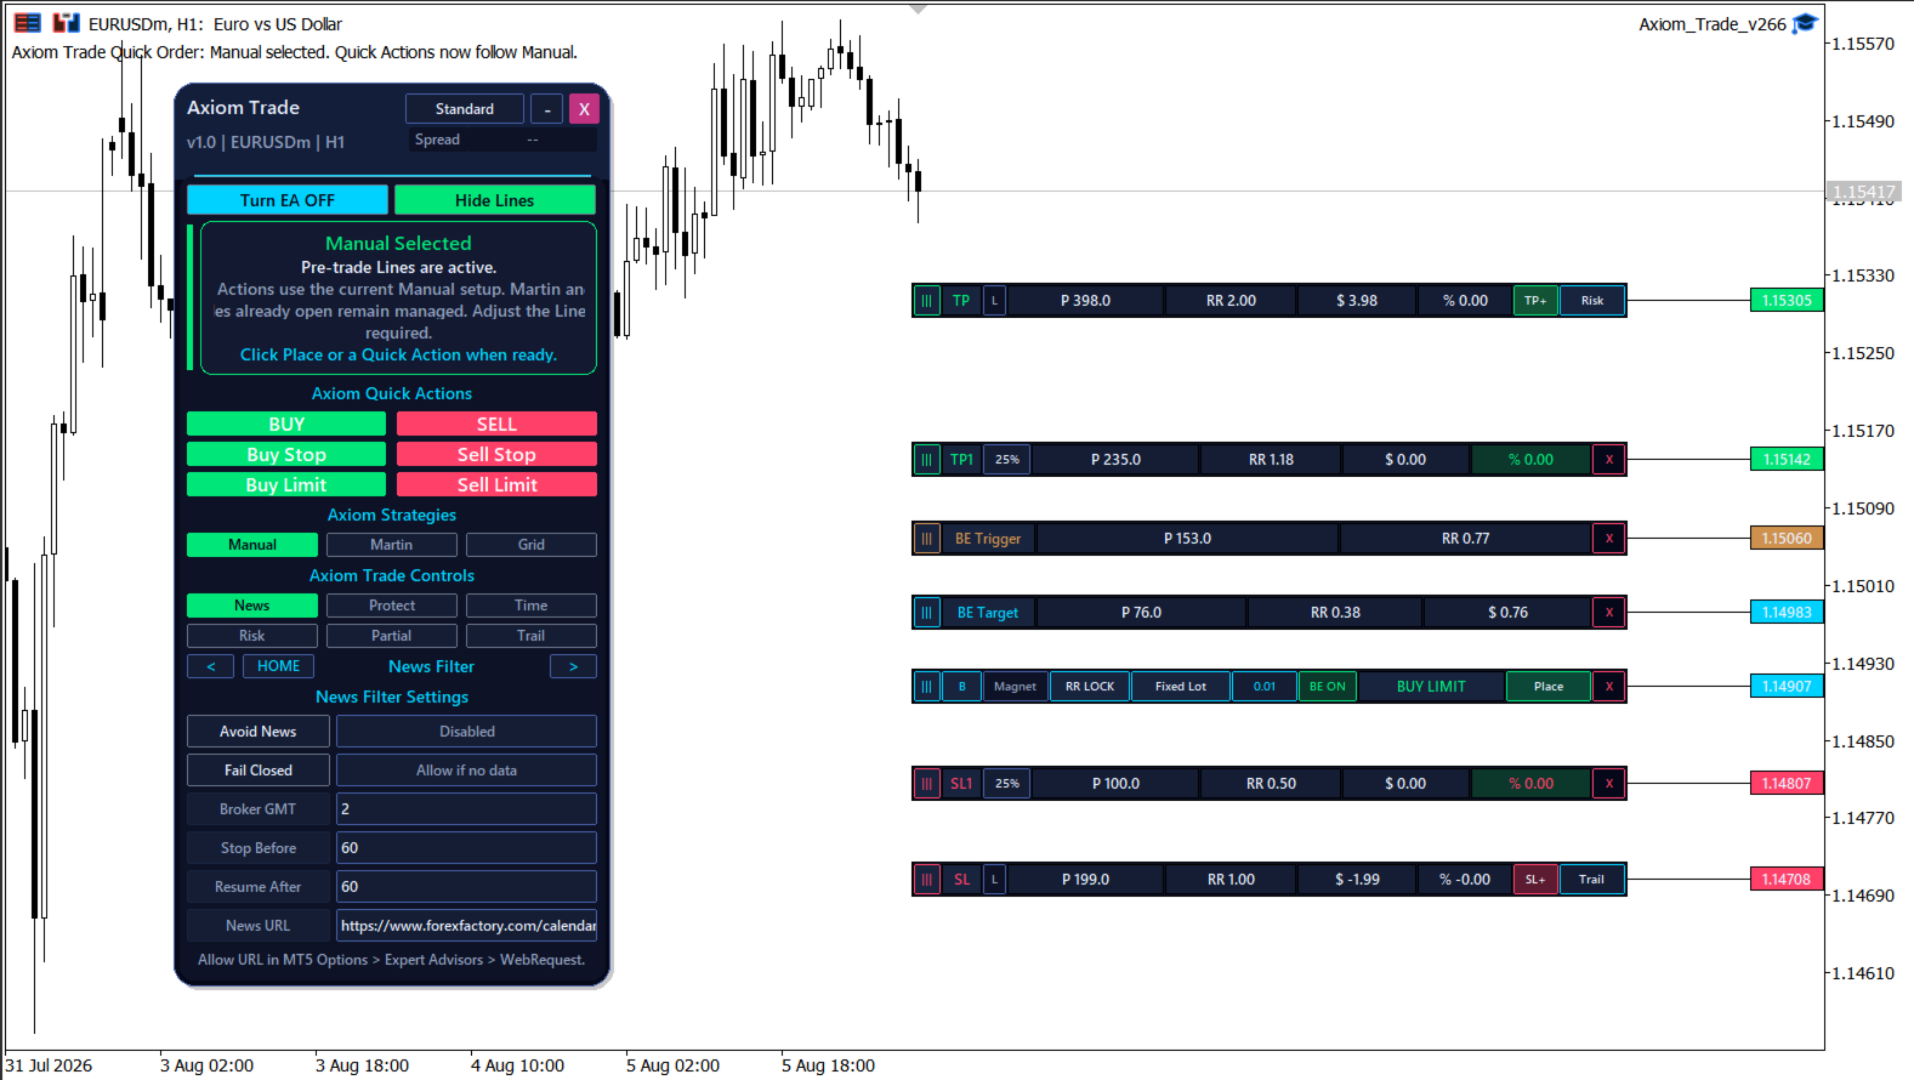
Check the order plan and the filter settings separately. This historical 31 July-5 August 2026 EURUSDm H1 Axiom Trade example shows Manual selected, a BUY LIMIT plan with fixed lot 0.01, a displayed stop and target, and break-even controls. The News Filter page reads Avoid News: Disabled and Allow if no data. A visible news-control tab does not mean news avoidance is active. Before placing an order, review the actual filter state, broker time setting, entry, stop and total risk. The values shown are an example, not recommended settings. Test the configuration on demo first.

https://www.mql5.com/en/market/product/184566