AngleofMA
- Indicadores
- Versión: 1.0
- Activaciones: 10
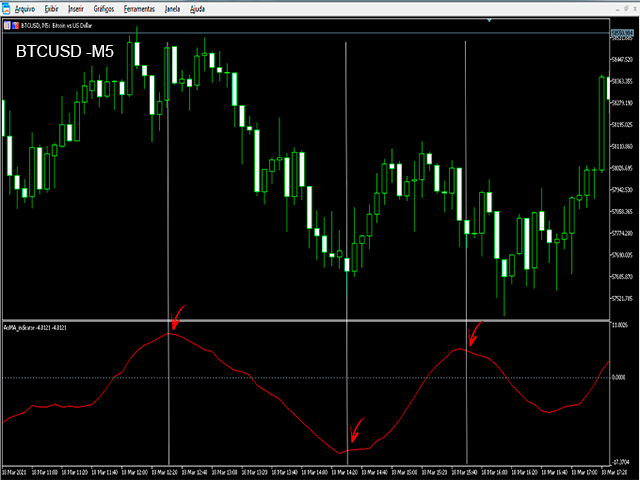
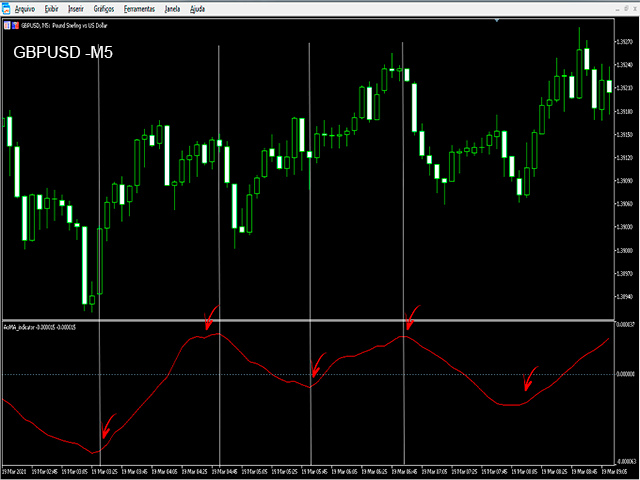
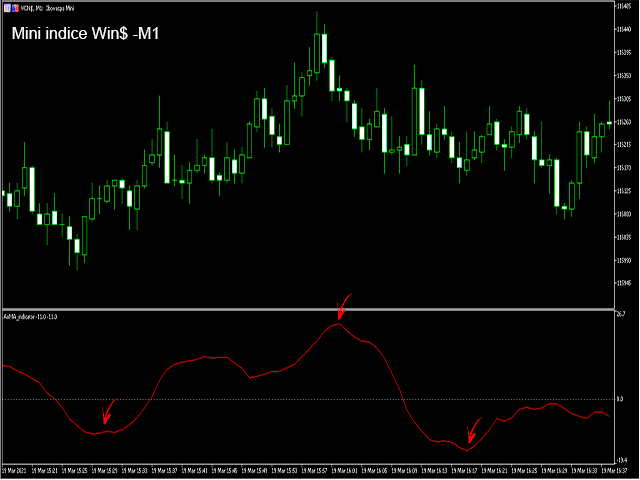
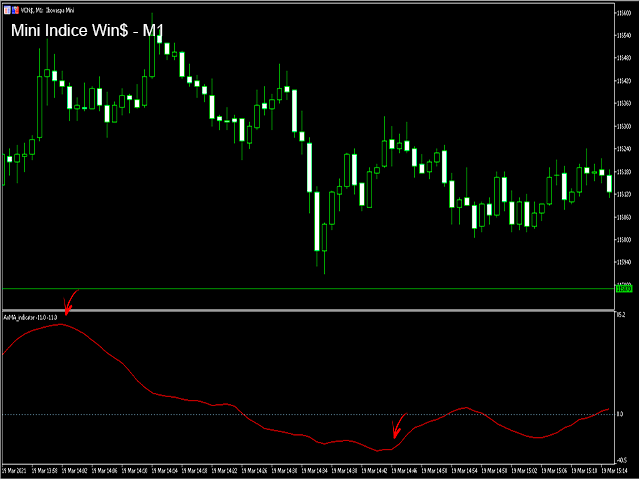
AoMA es un indicador basado en cálculos de geometría analítica, en el que se calcula el ángulo medio del precio de un periodo determinado.
Al ser un potente indicador de puntos de inversión y soportes, los soportes y resistencias se objetivan con la formación de zonas de "meseta" bien definidas.
Puede utilizarse para el seguimiento de tendencias y la anticipación de puntos de cambio de tendencia.
Dispone de dos niveles de periodos, uno corto y otro largo, y los cruces de periodos pueden utilizarse como indicativos de compra y venta, al igual que en las estrategias clásicas de seguimiento de tendencias.
A pesar de anticipar la continuidad y la inversión de la tendencia, el indicador no puede indicar los mejores puntos de entrada y salida, por lo que no debe utilizarse por sí solo como sistema de negociación de seguimiento de tendencias.
Los buffers del indicador están disponibles para su integración con otros EAs y su importación en scripts.
Nombre_del_indicador = AoMA_indicator;
Funciona en forex y activos B3