Zscore Indicator Suite
- Indicadores
- Versión: 1.6
- Actualizado: 4 febrero 2021
- Activaciones: 5

******** 5 INDICADORES EN 1 ***********
En estadística, la puntuación Z nos indica el número de desviaciones estándar en que el valor de una puntuación bruta está por encima o por debajo del valor medio de lo que se observa o mide. En el trading, la puntuación Z nos indica el número de desviaciones estándar en las que el valor del precio está por encima o por debajo de una media móvil elegida. Por ejemplo, un Zscore de 1,5 en un periodo de 20 nos dice que el precio de cierre está actualmente 1,5 x desviaciones estándar por encima de la media móvil de 20 periodos.
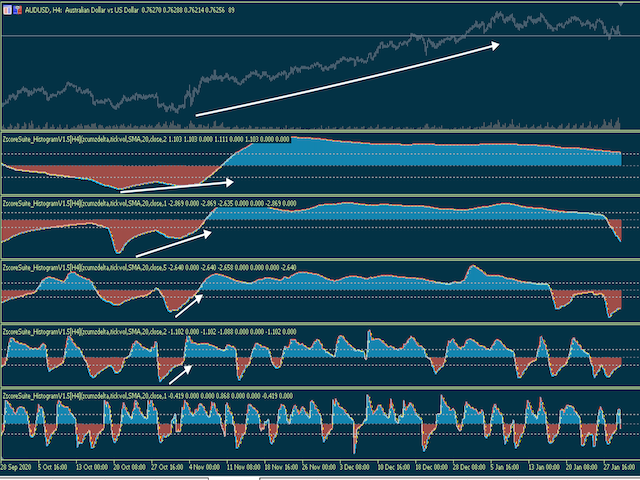
La ZscoreSuite ofrece calcular e ilustrar el Zscore no sólo del Precio, sino también de las Medias Móviles, Volumen, y dos funciones personalizadas Rango (Volatilidad) y Tendencia en forma de un Oscilador combinado con una media móvil del Zscore que sirve como línea de señal para determinar mejor las entradas o salidas cuando estos dos se cruzan.
Ahora están disponibles los siguientes 5 modos:
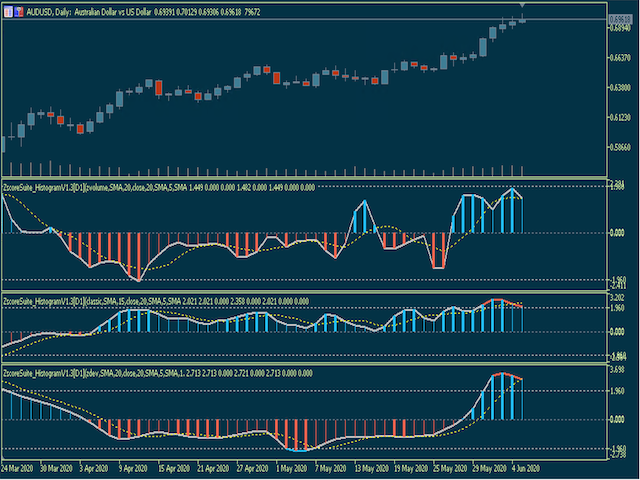
1) 1er ScreenShot ~ Clásico (Calcula el ZScore del Precio), en este modo usted puede ver si el precio está por encima o por debajo del promedio medio (período de su elección) determinado por un valor + o -. El valor en sí representa un multiplicador de la Desviación Estándar. En esencia, le indica cuánto se ha desviado actualmente el precio de dicha media móvil.
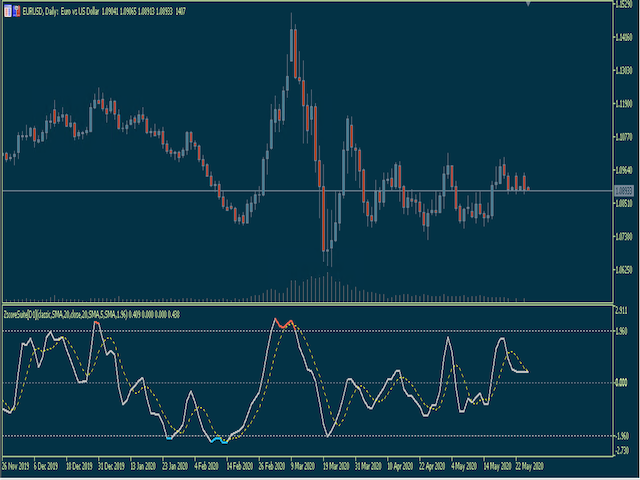
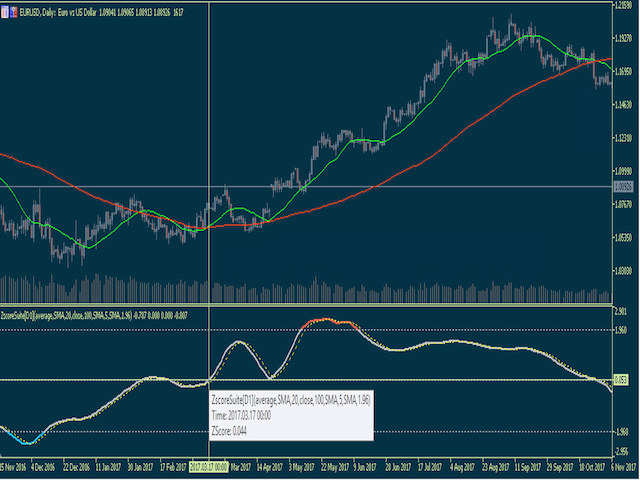
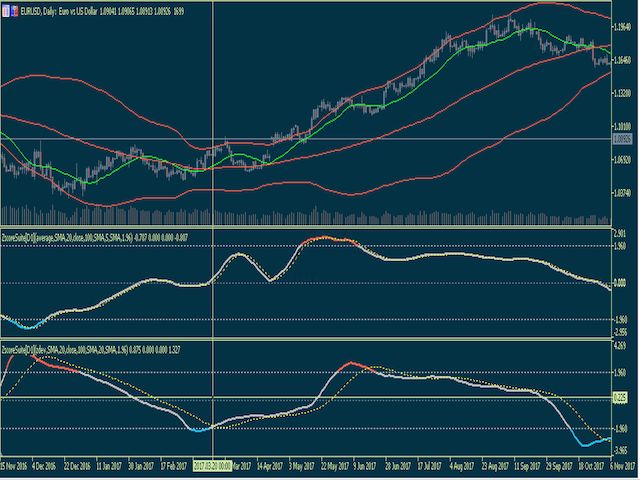
2) 2ª Captura de pantalla ~ ZAverage (Calcula el ZScore de una media, en lugar del precio) en este modo puede ver si una media de su elección (idealmente una media móvil de periodo corto), en lugar del precio, está por encima o por debajo de la media media (una media móvil lenta, periodo de su elección) determinada por un valor + o -. El valor en sí representa un multiplicador de Desviación Estándar. En esencia, le indica cuánto se desvía actualmente una Media Móvil de Periodo Corto de la Media Móvil de Periodo Largo. La idea aquí era eliminar el ruido del precio utilizando una media en lugar del propio Precio. En este modo se pueden identificar fácilmente los Cruces de Medias Móviles ya que cualquier cruce de la línea CERO significa un cruce de las medias.
3) 3ª Captura de Pantalla ~ ZDev (Calcula el ZScore de la Desviación Estándar), en este modo se puede ver si la Desviación Estándar actual está por encima o por debajo de la media promedio de la Desviación Estándar (período de su elección) determinada por un valor + o -. El valor en sí representa un multiplicador de la Desviación Estándar. En esencia, le indica cuánto se desvía actualmente la Desviación Estándar de la Media. Una lectura baja por debajo de -1.00 simula el Bollinger Band Squeeze, un momento de consolidación de precios que está destinado a romperse. Lo ideal es entrar en operaciones cuando la ZDEV está aumentando. Las estrategias en las que el precio sigue una tendencia lateral se beneficiarán cuando el ZDEV disminuya, ya que significa que el precio entra en modo de consolidación.
4) 4to modo ~ ZVolume (Calcula el ZScore de Tick Volume, Volume Delta & Cumulative Volume Delta), este modo sirve como un gran indicador de Volumen ya que te permite ver claramente los picos de Volumen basados en un período de tu elección.
5) 5to modo ~ ZTrend Index, esta es una función hecha a medida que creamos para permitir una clara identificación de una Tendencia si la hay. Por sí solo, este modo es un gran indicador de la fuerza de la tendencia.
Si el concepto de Desviaciones Estándar y ZScore es nuevo para usted, le recomiendo que visite mi sitio web en fxbabatrading.com donde explico en detalle estos y otros conceptos relacionados con el uso de estadísticas en el trading.
Me gustaría dar crédito a: Brian Twomey, FX trader & autor, sin el cual no tendría ni idea de ZScore & estadísticas en el trading y a Igor Durkin, Master MQL developer, sin el cual este proyecto no habría sido completado.
******************** TRADINGVIEW INDICADOR INCLUIDO *********************
NOTA: Aquellos de ustedes que han comprado el indicador. He conseguido portar el código a la plataforma TRADINGVIEW. Si me enviáis un email con el justificante de compra a fxbaba108@gmail.com y la dirección de email registrada en vuestra cuenta de tradingview, puedo daros acceso al indicador para que lo utilicéis también en esa plataforma
Love this set of indicator, especially the custom made trend indicator provided by Ricardo. ZSCORE is very useful