Market Trend Detection
- Indicadores
- Versión: 1.0

Reconocer las tendencias es una de las habilidades analíticas más importantes en el trading.
No sólo los operadores técnicos, los que se inclinan fundamentalmente a hacer la tendencia de divisas como base de análisis para determinar el comercio de entrada.
Sin embargo, aprender a mirar las tendencias de divisas no es tan simple como parece.
Si desea precisión de la señal para estimar la dirección del próximo precio, entonces hay métodos avanzados en el aprendizaje de cómo mirar las tendencias de divisas que usted necesita saber.
Estrategia SIMPLE HOw para leer el mercado de tendencias.
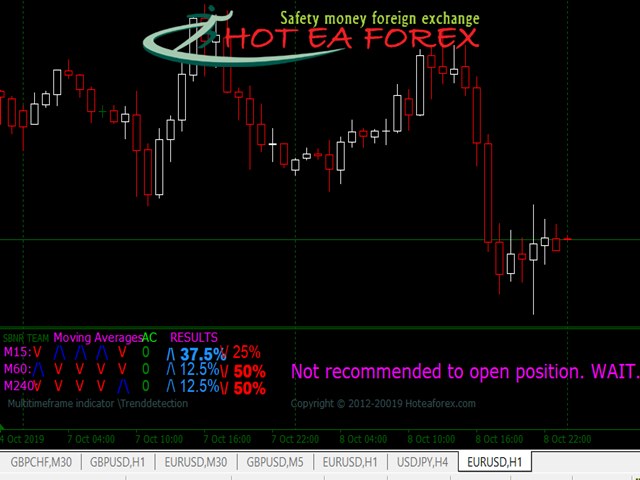
Centrarse en Resultado indicador Detección de tendencias.
Tendencias del mercado alcista / COMPRAR ---> Por encima del 50%.
Las tendencias del mercado bajista / SELL---> Por debajo del 50%
Estrategia moore se puede leer en nuestro blog.
El usuario no ha dejado ningún comentario para su valoración