Currency Timeframe Strength Matrix
- Indicadores
- Versión: 1.7
- Activaciones: 5
¿En qué consiste?
La Matriz de Fortaleza de Divisas en el Marco Temporal es un sencillo y completo mapa de Forex que ofrece una instantánea de lo que está sucediendo en el mercado de divisas en el momento actual. Ilustra las características de fuerza e impulso de cada divisa (AUD, CAD, CHF, EUR, GBP, JPY, NZD, USD) con respecto a diferentes marcos temporales (5 segundos, 1m, 5m, 15, 30m, 1h, 4h, 1d) de forma independiente. La visualización más exclusiva, que abarca análisis de múltiples divisas, múltiples marcos temporales y múltiples tendencias, ¡todo en uno! Y lo hace accediendo simultáneamente a un total de 196 (28 pares x 7 marcos temporales incorporados) fuentes de precios.
¿Cómo utilizarlo?
Útil para todas las estrategias: Los seguidores de tendencias pueden identificar fácilmente las divisas más fuertes y más débiles, emparejarlas y esperar oportunidades de continuación probable. Los operadores contratendenciales pueden interpretar la divisa más fuerte como sobrecomprada y la más débil como sobrevendida, y esperar oportunidades de retrocesos/retrocesos.
¿Cómo se lee?
Es una matriz de 8x8 con divisas (AUD, CAD, CHF, EUR, GBP, JPY, NZD, USD) a lo largo de las columnas y marcos temporales (5s, 1m, 5m, 15m, 30m, 1H, 4H, 1D) a lo largo de las filas; dando 64 cuadros de combinación de marcos temporales de divisas en total.
- Columna 1: AUD
- Columna 2: CAD
- Columna 3: CHF
- Columna 4: EUR
- Columna 5: GBP
- Columna 6: JPY
- Columna 7: NZD
- Columna 8: USD
- Fila 1: 5 segundos
- Fila 2: 1 minuto
- Fila 3: 5 minutos
- Fila 4: 15 minutos
- Fila 5: 30 minutos
- Fila 6: 1 hora
- Fila 7: 4 horas
- Fila 8: 1 día
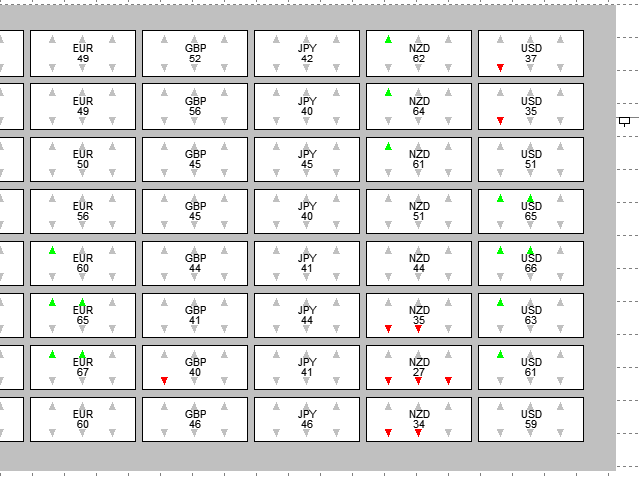
Cada cuadrado combinado tiene 3 punteros ARRIBA y 3 punteros ABAJO y una puntuación en el centro.
- Puntuación: Un número entero entre 0-100. Los cálculos se realizan en tiempo real para agregar y resumir las características de fuerza e impulso de una divisa concreta con respecto a un marco temporal determinado. Una puntuación baja indica debilidad, una puntuación alta indica fortaleza y una puntuación media indica neutralidad.
- Flechas hacia arriba (verde)
- Sin flechas: Poca o ninguna fuerza/momento.
- 1 flecha: Fuerza/momento moderado.
- 2 flechas: Fuerza/momento elevado.
- 3 flechas: Fuerza/momento muy altos.
- Flechas hacia abajo (rojo)
- Sin flechas: Poca o ninguna debilidad/momento.
- 1 flecha: Debilidad/momento moderados.
- 2 flechas: Debilidad/momento elevado.
- 3 flechas: Debilidad/momentum muy altos.
Por ejemplo. La columna USD muestra 2 flechas verdes tanto en la fila 1H como en la fila 4H, pero 1 flecha roja tanto en la fila 5s como en la fila 1m. Esto significa que en el mercado de divisas en general, el USD de forma aislada fue fuerte en los marcos de tiempo H1 y H4, pero tal vez recientemente se estancó y puede estar empezando a debilitarse pronto.
Característica de actualización
- Fila 1: 5s. Se actualiza cada 5 segundos.
- Fila 2: 1m. Se actualiza cada 1 minuto.
- Fila 3: 5m. Actualiza cada 5 minutos.
- Fila 4: 15m. Actualiza cada 15 minutos.
- Fila 5: 30m. Actualiza cada 30 minutos.
- Fila 6: 1H. Actualiza cada 1 hora.
- Fila 7: 4H. Actualiza cada 4 horas.
- Fila 8: Se actualiza cada 1 día.
La razón de este retraso progresivo en la actualización es ayudar a controlar la aparición de falsas rupturas en los marcos de tiempo más altos. Vea los siguientes escenarios para una explicación.
Escenario 1. Se produce una falsa ruptura en el USDJPY cuando el precio realiza un gran movimiento alcista repentino pero retrocede rápidamente.
En este caso, las filas de plazos más cortos le mostrarán las flechas verdes en el USD y las flechas rojas en el JPY porque se actualizan con mucha frecuencia, reflejando así que se está produciendo un movimiento alcista significativo. Sin embargo, las filas de plazos más largos no se actualizarán hasta más tarde. En el momento en que se actualicen, el retroceso ya se habrá producido y, por lo tanto, es probable que las filas de plazos más largos no reflejen este movimiento.
Escenario 2. Una verdadera ruptura ocurre en el USDJPY donde el precio hace un gran movimiento alcista repentino y se mantiene allí por un tiempo.
En este caso, las filas más cortas le mostrarán flechas verdes en el USD y rojas en el JPY porque se actualizan con mucha frecuencia, reflejando así que se está produciendo un movimiento alcista significativo. Las filas de plazos más largos no se actualizarán hasta más tarde. Pero si el movimiento del precio fue lo suficientemente significativo, entonces estas filas probablemente confirmarán la ruptura con las flechas apropiadas y la puntuación cuando se actualicen más tarde.
Parámetros de entrada
- Escala: Controla el tamaño del indicador en su ventana. Por defecto es 1.0, se recomienda no bajar de 0.7.
- Prefijo de moneda: Cualquier carácter especial que aparezca antes de su par de divisas(xxxGBPUSD). Introduzca xxx exactamente como aparece.
- Sufijo de divisa: Cualquier carácter especial que aparezca después del par de divisas (GBPUSDyyy). Introduzca yyy exactamente como aparece.