Draw Pivot Point
- Indicadores
- Versión: 1.0

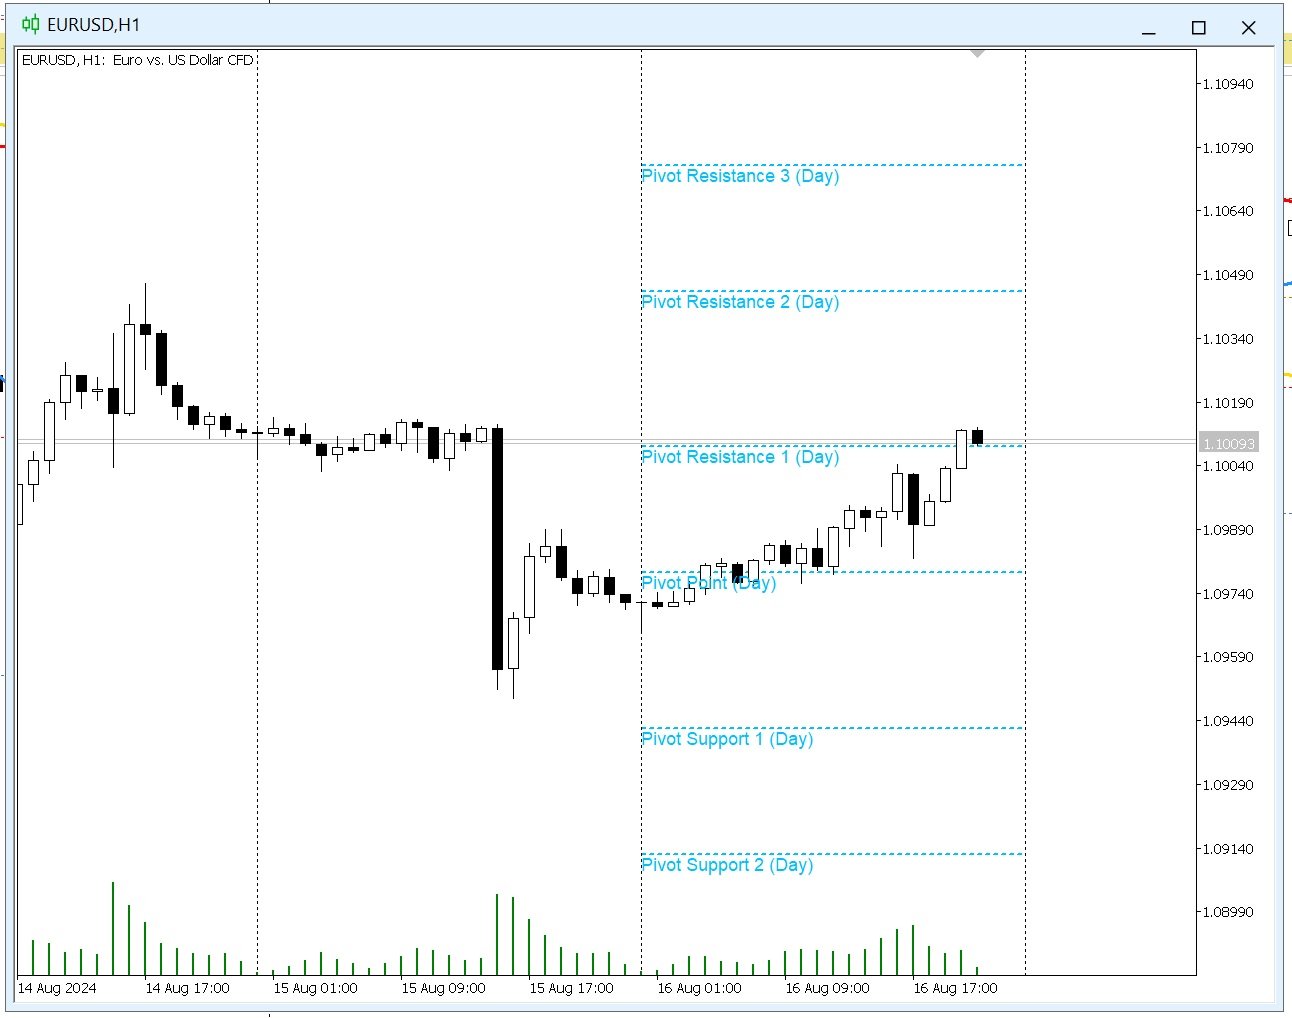
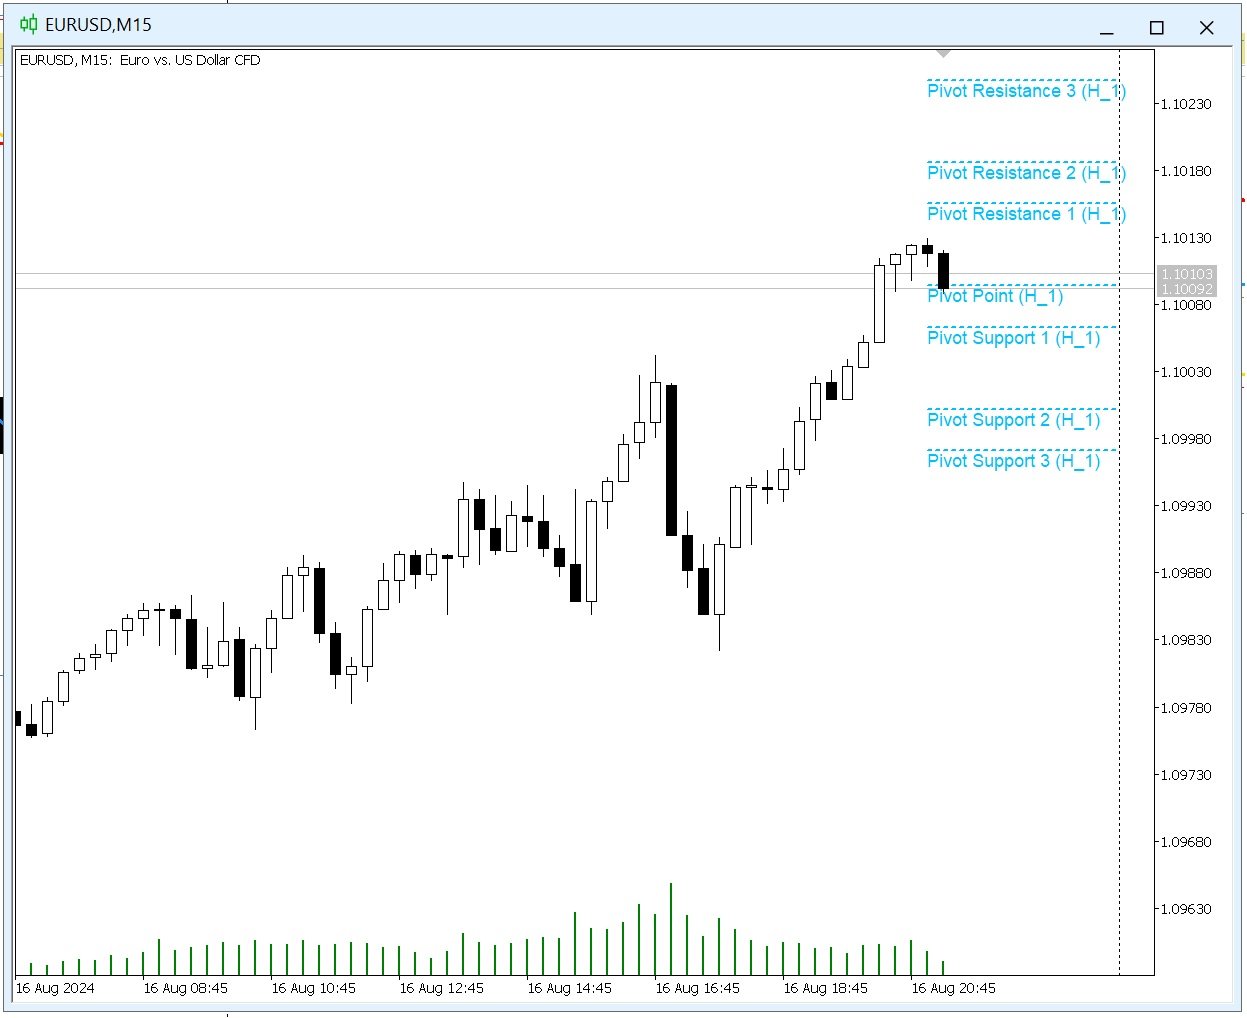
La utilidad dibuja niveles de pivote para el marco temporal seleccionado en el método clásico.
Pivot = (high + close + low) / 3
R1 = (2 * Pivot) - low
S1 = (2 * Pivot) - high
R2 = Pivot + ( high - low )
R3 = high + (2 * (Pivot - low))
S2 = Pivot - (high - low)
S3 = low - (2 * (high - Pivot))
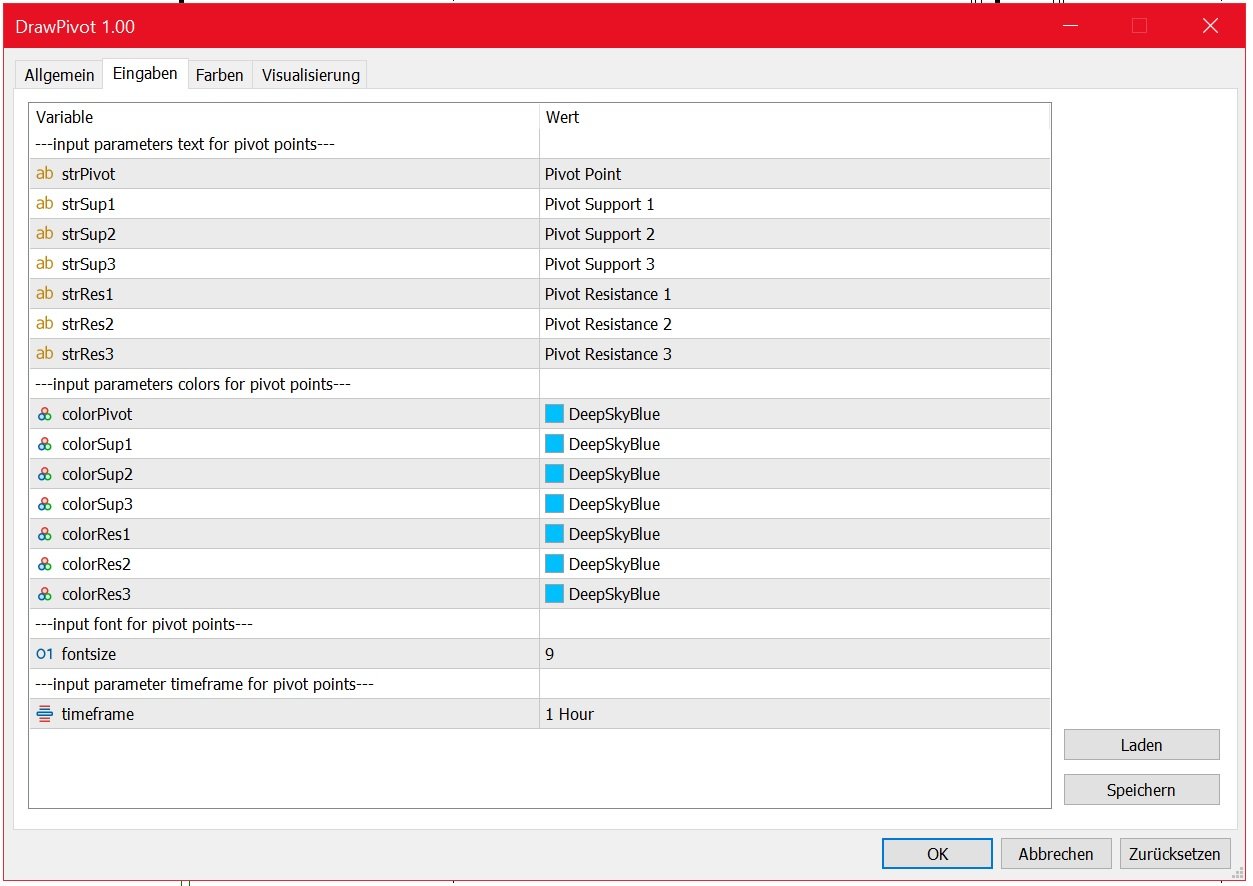
Puede cambiar el marco temporal, los colores y el tamaño de la fuente.
También puede cambiar el texto de los niveles.
Diviértete y dar retroalimentación ...