B3 Rolagem Venda Coberta de Call
- Indicadores
- Versión: 1.0
- Activaciones: 5

Facilite sus decisiones a la hora de lanzar una Covered Call. Este robot le proporciona información que ayuda en la decisión sobre cómo y cuándo rodar su estructura.
Funciona para cualquier activo en el mercado spot que tenga series de opciones autorizadas en B3 (Bolsa de Valores de Brasil). Asocie el robot al activo que desea utilizar para la Covered Call.
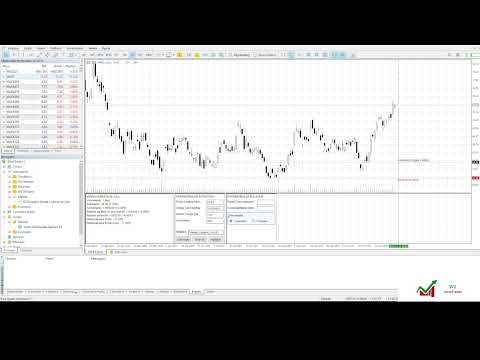
Cómo utilizar el robot:
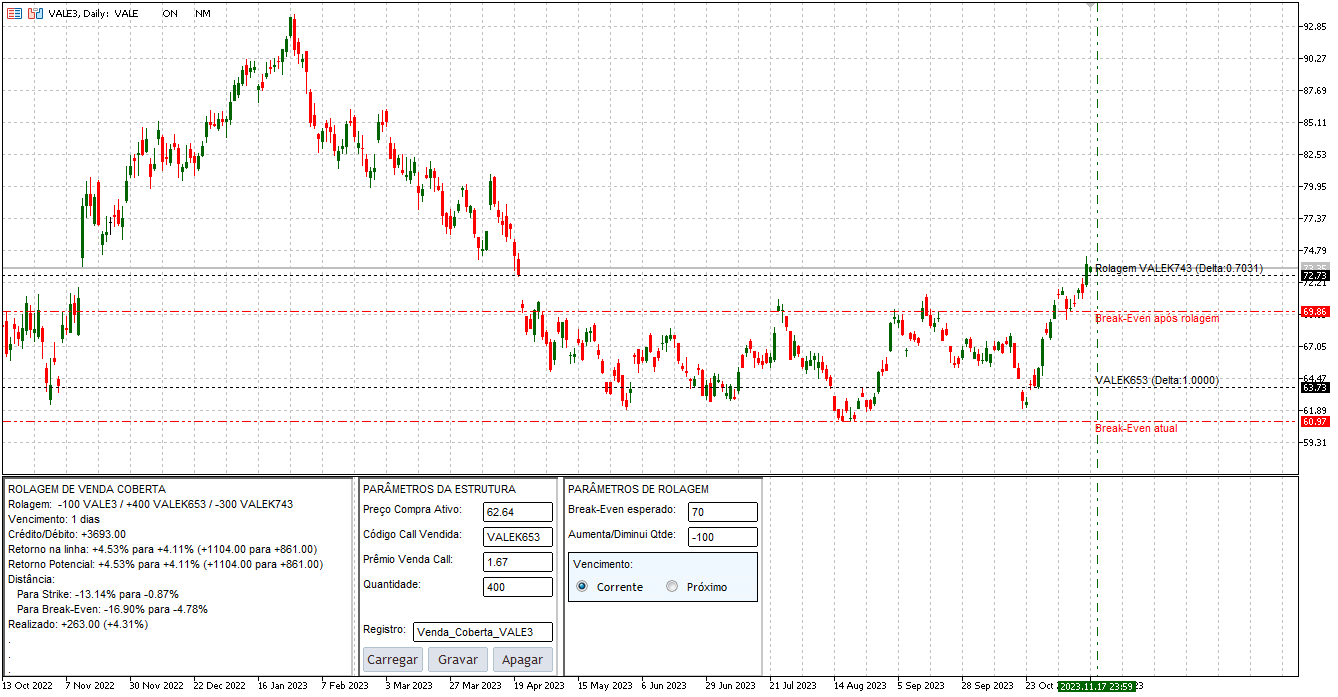
Configure los parámetros de su estructura actual:
- Precio de compra del activo base de su estructura.
- Código de la Call que utilizó para construir su estructura.
- La prima que recibió por la venta de la Call.
- El tamaño de la estructura, definido por su cantidad.
Analice las posibles tiradas definiendo:
- El nuevo punto de equilibrio esperado para su estructura después de rodar.
- La cantidad de acciones y opciones que se añadirán o eliminarán de su estructura tras la renovación.
- El nuevo vencimiento de la estructura, que es una elección entre no cambiar el vencimiento actual o mover el vencimiento de su Call al vencimiento posterior.
Puede cambiar estos parámetros tanto como quiera para analizar la mejor tirada a realizar. Utilice el gráfico de precios para una mejor visión de su estrategia.
*** ATENCIÓN ***
Para que el robot funcione, el servicio que consulta las series autorizadas de opciones B3 debe estar ejecutándose en su terminal. Descargue la utilidad gratuitamente en este enlace.
Instrucciones de instalación en esteenlace.
Instrucciones de uso en este enlace.
Si tienes alguna duda, contacta con nosotros en Telegram.
P.D.: Todos los textos del robot están en portugués brasileño. Háganos saber si usted necesita estas cosas en Inglés. Necesitas operar en la Bolsa B3 de Brasil.