Join our fan page

False Breakups - indicator for MetaTrader 5

- Views:
- 9637
- Rating:
- Published:
-
 You are missing trading opportunities:
- Free trading apps
- Over 8,000 signals for copying
- Economic news for exploring financial markets
Registration Log inYou agree to website policy and terms of use
If you do not have an account, please register -
 Need a robot or indicator based on this code? Order it on Freelance
Go to Freelance
Need a robot or indicator based on this code? Order it on Freelance
Go to Freelance
Indicator documentation "FakeBreaks.mq5"
Overview
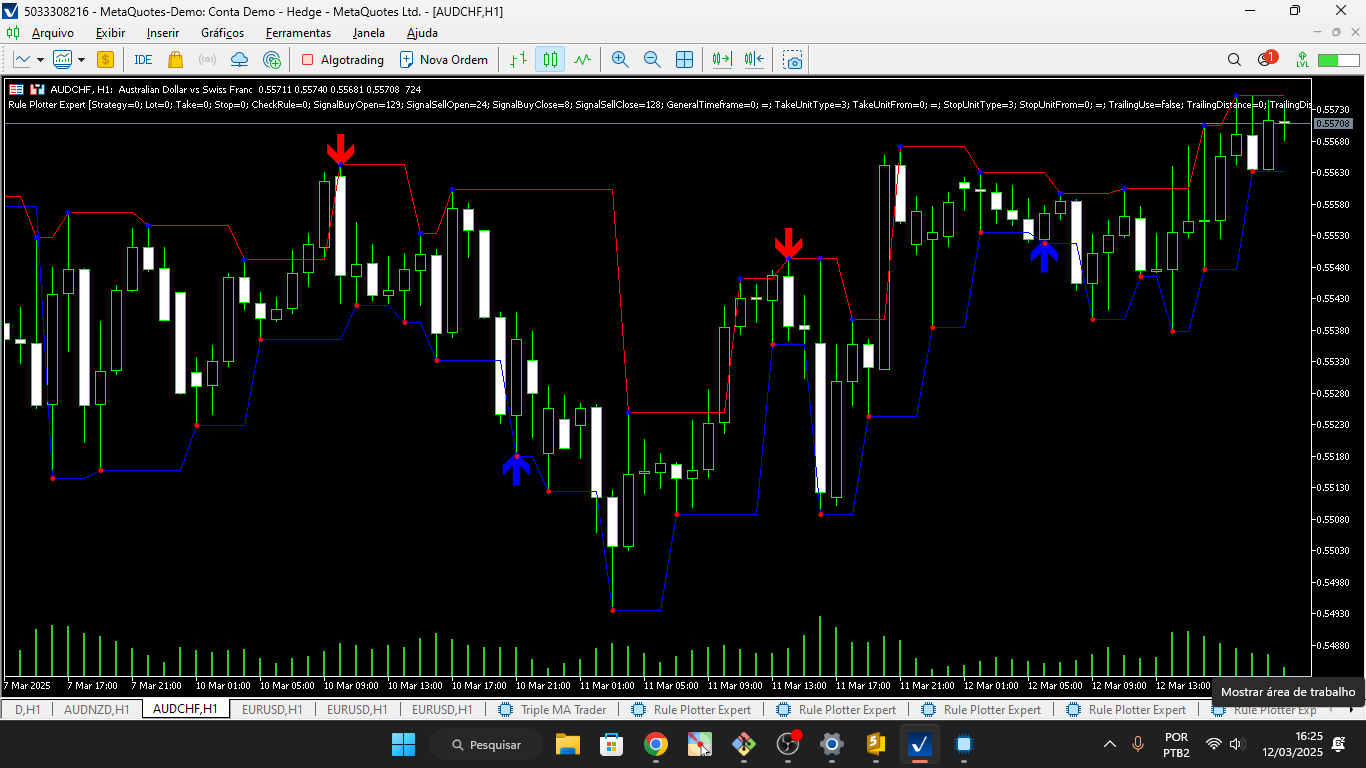
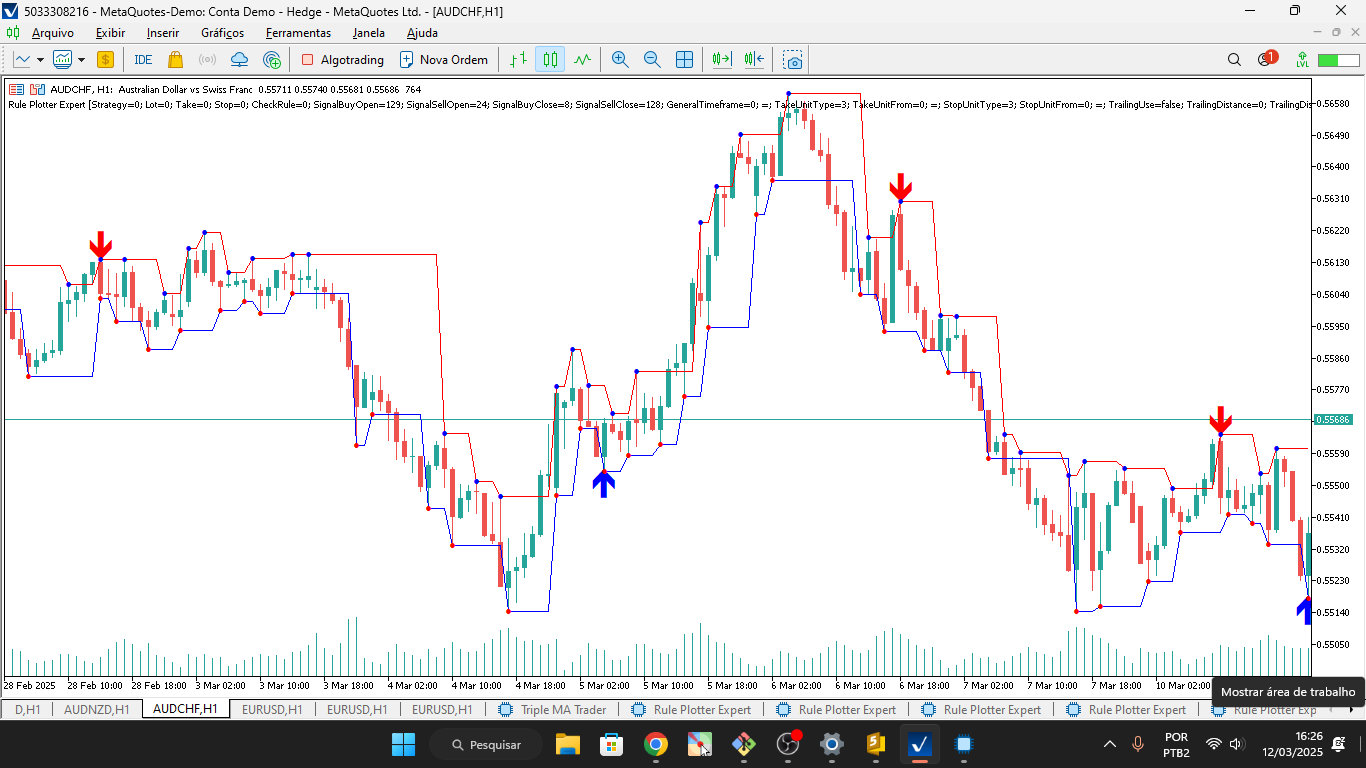
The "False Breakouts.mq5" indicator is designed to identify and mark on the chart:
- Buy Points and Sell Points based on false breakouts of support and resistance.
- Dynamicsupport and resistancelevels.
- Markettops and bottoms.
It uses buffers to store and display this information on the chart, making it easier to visually analyse false breakout patterns.
Code Structure
Indicator Properties
- Indicator Name: FalseBreakouts.mq5
- Version: 1.00
- Display Window: Main chart ( indicator_chart_window ).
Buffers and Plots
The indicator uses 6 buffers to store data and 6 plots to display it on the chart:
- Buy:
- Type: DRAW_ARROW (up arrow).
- Colour: Blue (clrBlue).
- Width: 5.
- Sell:
- Type: DRAW_ARROW (down arrow).
- Colour: Red ( clrRed ).
- Width: 5.
- Support:
- Type: DRAW_LINE (solid line).
- Colour: Blue (clrBlue).
- Resistance:
- Type: DRAW_LINE (continuous line).
- Colour: Red ( clrRed ).
- Bottom:
- Type: DRAW_ARROW (down arrow).
- Colour: Red ( clrRed ).
- Top:
- Type: DRAW_ARROW (up arrow).
- Colour: Blue ( clrBlue ).
Global Variables
- ExtResistancesBuffer[] : Stores the resistance levels.
- ExtSupportsBuffer[] : Stores the support levels.
- ExtTopsBuffer[] : Stores identified tops.
- ExtBottomsBuffer[] : Stores identified bottoms.
- ExtSellBuffer[] : Stores the selling points.
- ExtBuyBuffer[] : Stores the buy points.
Main functions
1. OnInit()
- Purpose: Initialises the indicator and maps the buffers.
- Actions:
- Maps the buffers to the plots.
- Sets empty values ( PLOT_EMPTY_VALUE ) for the buffers.
- Sets the arrows (icons) for Buy and Sell.
- Defines the displacement of the arrows on the graph.
2. OnCalculate()
- Purpose: Calculates and updates the buffers with each new candle or tick.
- Actions:
- Checks for new data to process.
- Initialises the buffers if necessary.
- Identifies tops ( IS_TOP ) and bottoms ( IS_BOTTOM ) based on the high and low prices.
- Updates the resistance, support, top and bottom buffers.
- Calls the IsBuy() and IsSell() functions to identify buy and sell points.
3. IndexNextPoint()
- Purpose: Finds the index of the next valid (non-zero) point in a buffer.
- Use: Used by the IsBuy() and IsSell() functions to identify the most recent reference point.
4. IsBuy()
- Purpose: Checks for a buy signal based on a false break of support.
- Logic:
- Checks whether the current price is above the reference point (support).
- Confirms if there has been a false breakout (price falls below and then returns above support).
- Returns true if the conditions are met.
5. IsSell()
- Purpose: Checks for a sell signal based on a false breakout of resistance.
- Logic:
- Checks whether the current price is below the reference point (resistance).
- Confirms if there has been a false breakout (price rises above and then returns below resistance).
- Returns true if the conditions are met.
Operating Logic
-
Identification of Tops and Bottoms:
- A top is identified when the high of the current candle is higher than the highs of the adjacent candles.
- A bottom is identified when the low of the current candle is lower than the lows of the adjacent candles.
-
Updating Support and Resistance:
- The last identified top is stored as resistance.
- The last identified bottom is stored as support.
-
Buy and Sell Signals:
- A buy signal is generated when the price breaks through a support and then returns above it.
- A sell signal is generated when the price breaks through resistance and then returns below it.
Example of use
- The indicator can be applied to any chart in MetaTrader 5.
- It will display:
- Blue arrows for buy points.
- Red arrows for sell points.
- Blue lines for support.
- Red lines for resistances.
- Additional arrows for tops and bottoms.
Final considerations
- The indicator is useful for traders who trade on the basis of false breakouts of support and resistance.
- It is recommended to test the indicator on different markets and timeframes to validate its effectiveness.
- It can be customised to include sound alerts or notifications when a signal is generated.
Translated from Portuguese by MetaQuotes Ltd.
Original code: https://www.mql5.com/pt/code/56972
Baseline: iMA + ATR Bands
Combines a Moving Average with ATR-based upper and lower bands to act as a trend filter and volatility channel.
Show Positions on Custom Chart (or standard chart) for MT5
This indicator is a utility that shows labelled trade levels on any chart. If you want to replace your native trade levels on a native chart, then turn off "Show trade levels" in your F8 Chart Properties and attach this indicator. If you want to show trade levels on a Custom Chart (where native trade levels cannot be shown), then simply attach this indicator. BaseSymbol - specify the Symbol from which the trade level data will be pulled--handy for unique Custom Symbols. TextBarsBack - specify the number of bars back in history from the current bar where the level labels will be drawn. Note: Although magic number is referenced in the code, it is not presently included in the trade lines. If you're running multiple EA's on the same Symbol, you can edit the code to show magic numbers and then run multiple instances of the indicator on one chart. You can also edit the font sizes and text spacing in the object properties as needed for different display resolutions.
AlphaTrend
It is an indicator used to determine the trend, support and resistance level of the market. When volume data is available, it calculates using MFI, if not, it calculates using RSI. Momentum: RSI and MFI Volatility: ATR
ATR Channels Indicator
The indicator displaying multi level of ATR Channel.