Join our fan page

Divergence Awesome Ocilator - indicator for MetaTrader 5

- Views:
- 6767
- Rating:
- Published:
-
 You are missing trading opportunities:
- Free trading apps
- Over 8,000 signals for copying
- Economic news for exploring financial markets
Registration Log inYou agree to website policy and terms of use
If you do not have an account, please register -
 Need a robot or indicator based on this code? Order it on Freelance
Go to Freelance
Need a robot or indicator based on this code? Order it on Freelance
Go to Freelance
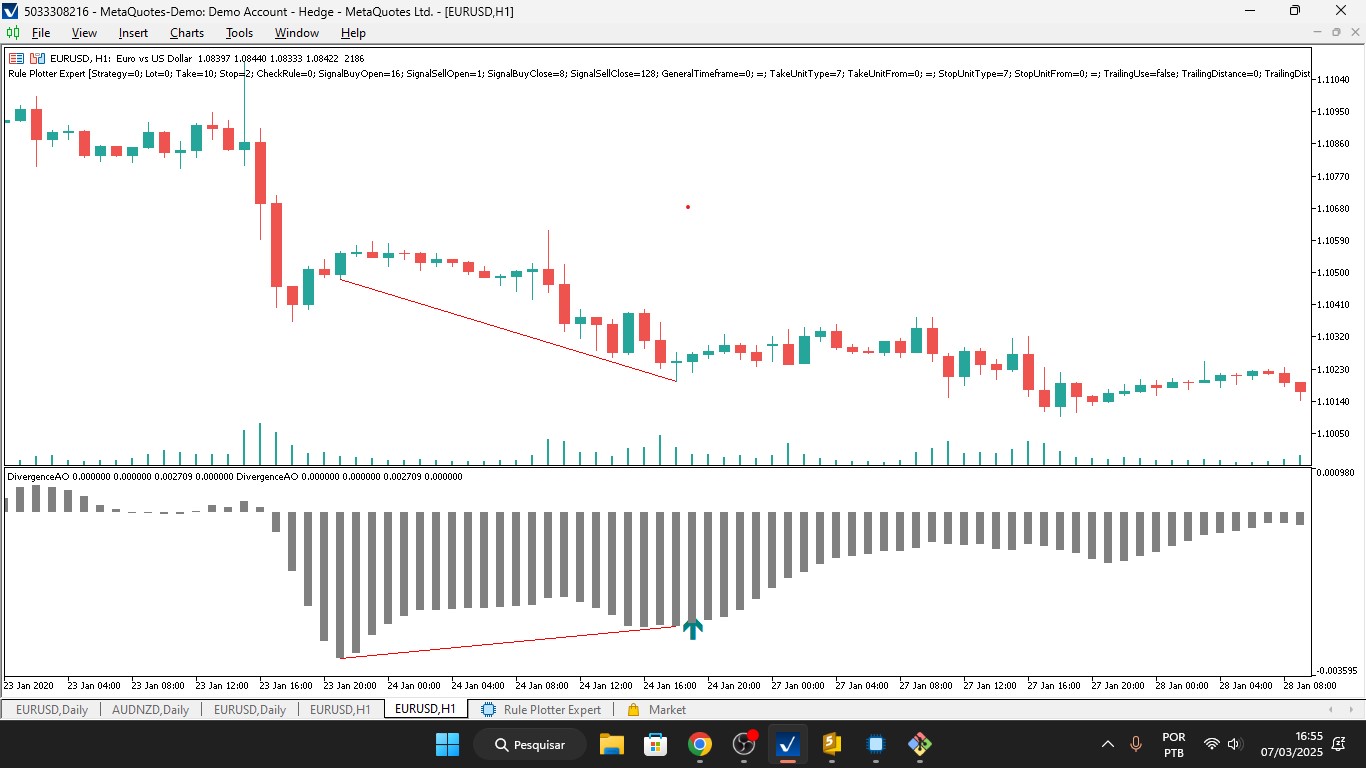
This MQL5 code is a custom indicator designed to detect and visualise divergences between price action and the Awesome Oscillator (AO). Divergences occur when the price movement and the oscillator movement are not aligned, often signalling potential reversals or continuations in the market. The indicator plots buy/sell signals, a histogram of the AO, and trendlines to highlight these divergences.

Key Features of the Indicator:
-
Divergence Detection:
- Detects bullish divergences (price makes lower lows while AO makes higher lows).
- Detects bearish divergences (price makes higher highs while AO makes lower highs).
-
Visualisation:
- Buy/Sell Arrows: Plots arrows on the chart to indicate potential buy or sell signals based on divergences.
- Histogram: Displays the Awesome Oscillator (AO) values as a histogram.
- Trendlines: Draws trendlines on the chart to highlight the divergences between price and AO.
-
Custom Buffers:
- Uses four buffers to store data:
- BuyBuffer and SellBuffer for buy/sell signals.
- HistogramBuffer for AO values.
- PointsCounterBuffer to track aligned points for divergence confirmation.
- Uses four buffers to store data:
-
Dynamic Trendline Drawing:
- Uses CChartObjectTrend to dynamically draw trendlines on the chart for price and AO.
-
Crossing Check:
- Includes a function ( CheckCrossing ) to verify if the price or AO crosses a trendline, which helps confirm or invalidate a divergence.
-
Interpolation:
- Uses linear interpolation ( CalculateIntermediateValue ) to calculate intermediate values between two points, which is used to check for crossings.
How it works:
-
Initialisation:
- The OnInit() function sets up the indicator buffers, assigns properties (e.g., colours, styles), and initializes the Awesome Oscillator (AO) handle.
-
Main Calculation:
- The OnCalculate() function processes price and AO data to detect divergences:
- Identifies bottoms (lower lows) and tops (higher highs) in both price and AO.
- Checks for divergences by comparing price and AO trends.
- Plots buy/sell signals and draws trendlines when a divergence is confirmed.
- The OnCalculate() function processes price and AO data to detect divergences:
-
Divergence Confirmation:
- Uses conditions like IsBullishTrend and IsBearishTrend to confirm divergences.
- Ensures no crossing occurs between the price and AO trendlines to validate the divergence.
-
Dynamic Updates:
- The indicator dynamically updates with each new bar, recalculating divergences and redrawing trendlines as needed.
Key Functions:
-
IsBottom() and IsTop() :
- Detect local minima (bottoms) and maxima (tops) in an array (price or AO).
-
CheckCrossing() :
- Checks if the price or AO crosses a trendline, which can invalidate a divergence.
-
CalculateIntermediateValue() :
- Calculates intermediate values using linear interpolation for trendline analysis.
-
AddUniqueCoordinates() :
- Ensures unique coordinates are added to the array for trendline drawing.
-
TotalAligned() :
- Counts the number of aligned points to confirm divergence strength.
Usage:
- This indicator is useful for traders who rely on divergence strategies to identify potential reversals or continuations in the market.
- It provides visual cues (arrows, trendlines, and histograms) to help traders make informed decisions.
Example Scenario:
- If the price is making lower lows (bearish), but the AO is making higher lows (bullish), a bullish divergence is detected. The indicator will plot a buy arrow and draw trendlines to highlight the divergence.
- Conversely, if the price is making higher highs (bullish), but the AO is making lower highs (bearish), a bearish divergence is detected. The indicator will plot a sell arrow and draw trendlines.
Technical Details:
- Platform: MetaTrader 5 (MT5).
- Language: MQL5.
- Dependencies: Uses the Awesome Oscillator ( iAO ) for calculations.
- Custom Objects: Utilises CChartObjectTrend for drawing trendlines and CArrayInt for managing arrays of coordinates.
This indicator is a powerful tool for traders who want to automate divergence detection and visualisation, saving time and improving accuracy in their trading strategies.
Translated from Portuguese by MetaQuotes Ltd.
Original code: https://www.mql5.com/pt/code/56820
 Partial close Sell Orders
Partially close active sell orders
Partial Close Buy Orders
Script for partially close active buy orders
 Tuyul GAP
Trading Gap Weekend, is it profitable?
 GZIP - Decode
Unpack GZIP archives from *.gz files or responses from sites compressed with this format.