
|
1 year
experience
|
21
products
|
18
demo versions
|
|
2
jobs
|
0
signals
|
0
subscribers
|
The best algorithmic developers aren't just programmers - they're traders who code.
I develop and code custom trading strategies, automation tools and custom software across multiple platforms and languages, including TradingView (Pine Script), MetaTrader 5 (MQL5), Python and other modern development frameworks.
Looking for a quantitative developer role.
I can turn trading strategies into fully functional systems.
Extensive experience with Linux (Gentoo, Debian) and Unix systems (FreeBSD, OpenBSD)
I’m available for projects.
You can ask for me directly in the Freelance section.
How Observation Changes Outcomes :
In quantum mechanics, when light (or electrons) passes through two slits, it creates an interference pattern on the screen behind them.
Each particle seems to go through both slits at once, existing in a super position of all possible paths and the resulting pattern reflects the probabilities of where the particle could land.
If you try to measure which slit the particle goes through, the interference pattern disappears.
Observing the particle forces it into a definite state - it goes through one slit or the other.
The act of measurement collapses the wave function and fundamentally changes the outcome.
Before you check a trade, it’s in super position.
From a statistical perspective, your trade has a probability of winning or losing based on your system but you don’t yet know the outcome.
The trade is evolving naturally, just like a quantum system.
The moment you look at it, your observation collapses the “trade wave function” into a definite state - good or bad, winning or losing.
That observation triggers an emotional reaction — stress, fear, or overconfidence—which can cause you to break your plan, over-leverage, or revenge trade.
Just like in quantum mechanics, the act of measurement affects the system.
If you hadn’t looked, the system would have continued evolving naturally and you would have followed your plan without emotional interference.
This analogy mirrors the quantum concept perfectly - observation changes the outcome, not because the market changed, but because your interaction with it changed your behavior.
In other words, checking too often destroys the natural probabilistic outcome of your system, just like measuring the slit destroys the interference pattern.
The trade itself hasn’t changed; your observation changed how you interact with it, which changes the outcome.
Final Thoughts:
Traders, you know what I’m talking about — in a demo, you can leave your strategy untouched for days, weeks, even months.
The moment it goes live, you start checking too often, micromanaging your trades, and suddenly your observation is affecting the outcome
I develop and code custom trading strategies, automation tools and custom software across multiple platforms and languages, including TradingView (Pine Script), MetaTrader 5 (MQL5), Python and other modern development frameworks.
Looking for a quantitative developer role.
I can turn trading strategies into fully functional systems.
Extensive experience with Linux (Gentoo, Debian) and Unix systems (FreeBSD, OpenBSD)
I’m available for projects.
You can ask for me directly in the Freelance section.
How Observation Changes Outcomes :
In quantum mechanics, when light (or electrons) passes through two slits, it creates an interference pattern on the screen behind them.
Each particle seems to go through both slits at once, existing in a super position of all possible paths and the resulting pattern reflects the probabilities of where the particle could land.
If you try to measure which slit the particle goes through, the interference pattern disappears.
Observing the particle forces it into a definite state - it goes through one slit or the other.
The act of measurement collapses the wave function and fundamentally changes the outcome.
Before you check a trade, it’s in super position.
From a statistical perspective, your trade has a probability of winning or losing based on your system but you don’t yet know the outcome.
The trade is evolving naturally, just like a quantum system.
The moment you look at it, your observation collapses the “trade wave function” into a definite state - good or bad, winning or losing.
That observation triggers an emotional reaction — stress, fear, or overconfidence—which can cause you to break your plan, over-leverage, or revenge trade.
Just like in quantum mechanics, the act of measurement affects the system.
If you hadn’t looked, the system would have continued evolving naturally and you would have followed your plan without emotional interference.
This analogy mirrors the quantum concept perfectly - observation changes the outcome, not because the market changed, but because your interaction with it changed your behavior.
In other words, checking too often destroys the natural probabilistic outcome of your system, just like measuring the slit destroys the interference pattern.
The trade itself hasn’t changed; your observation changed how you interact with it, which changes the outcome.
Final Thoughts:
Traders, you know what I’m talking about — in a demo, you can leave your strategy untouched for days, weeks, even months.
The moment it goes live, you start checking too often, micromanaging your trades, and suddenly your observation is affecting the outcome


Jason Smith
Jason Smith
2026.08.01
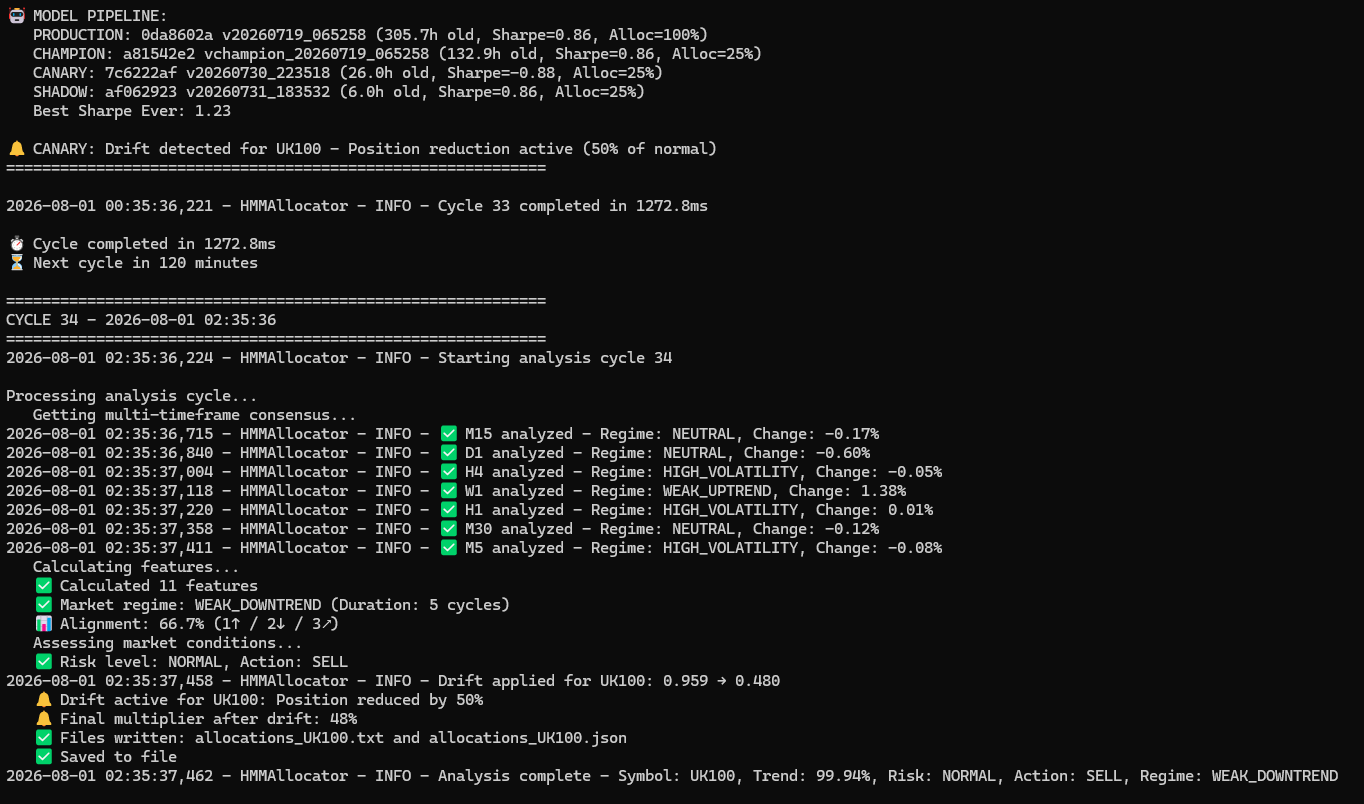
Markov comes with a powerful trading bot designed to execute trades based on the HMM signals it generates.
Jason Smith
2026.08.01
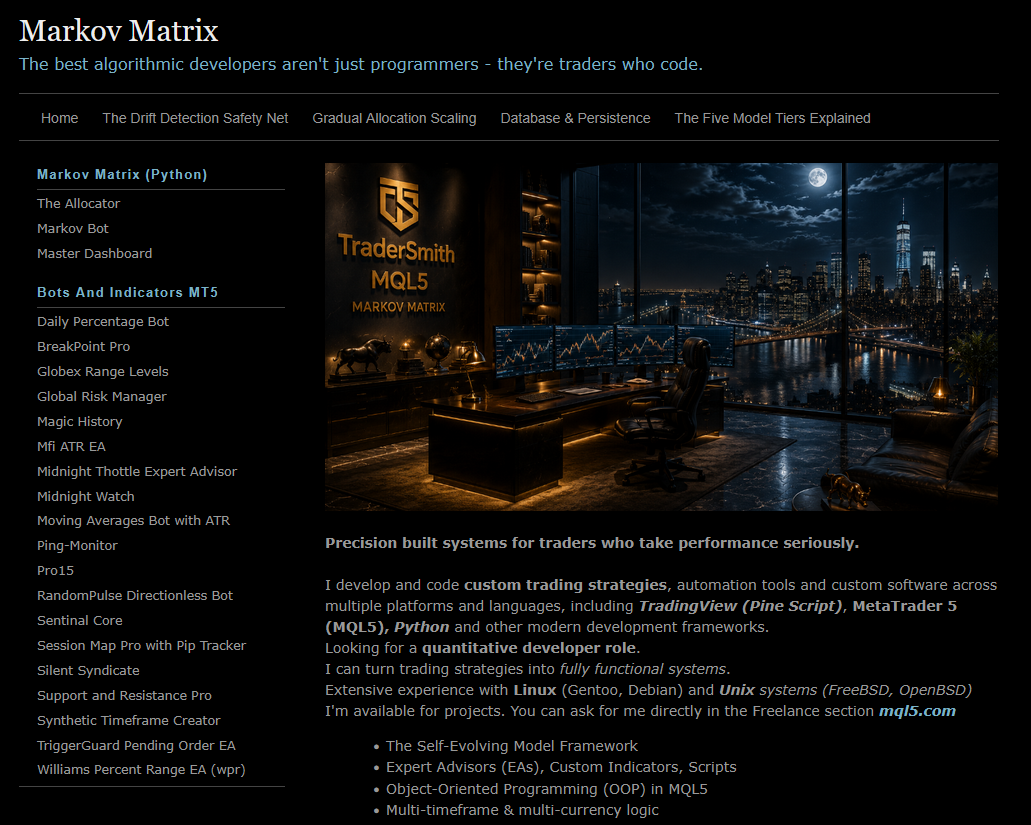
I’m not sure what the best way to handle the sale. I’ll probably need to use the freelance section to manage the Python side of the project while using the MQL5 Marketplace for the MT5 Expert Advisor
Jason Smith
Jason Smith
2026.07.31
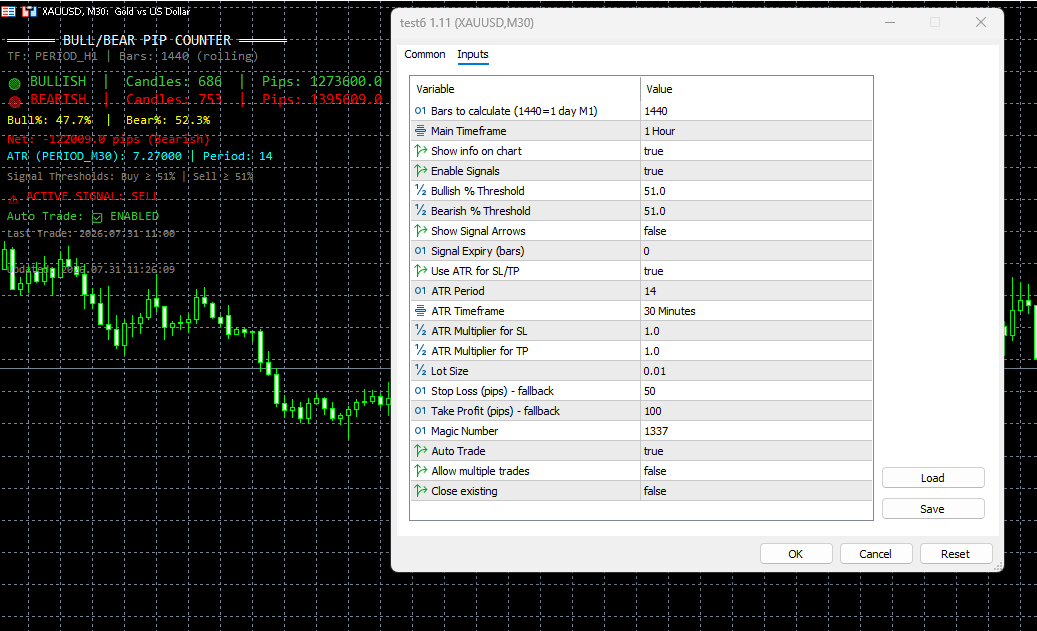
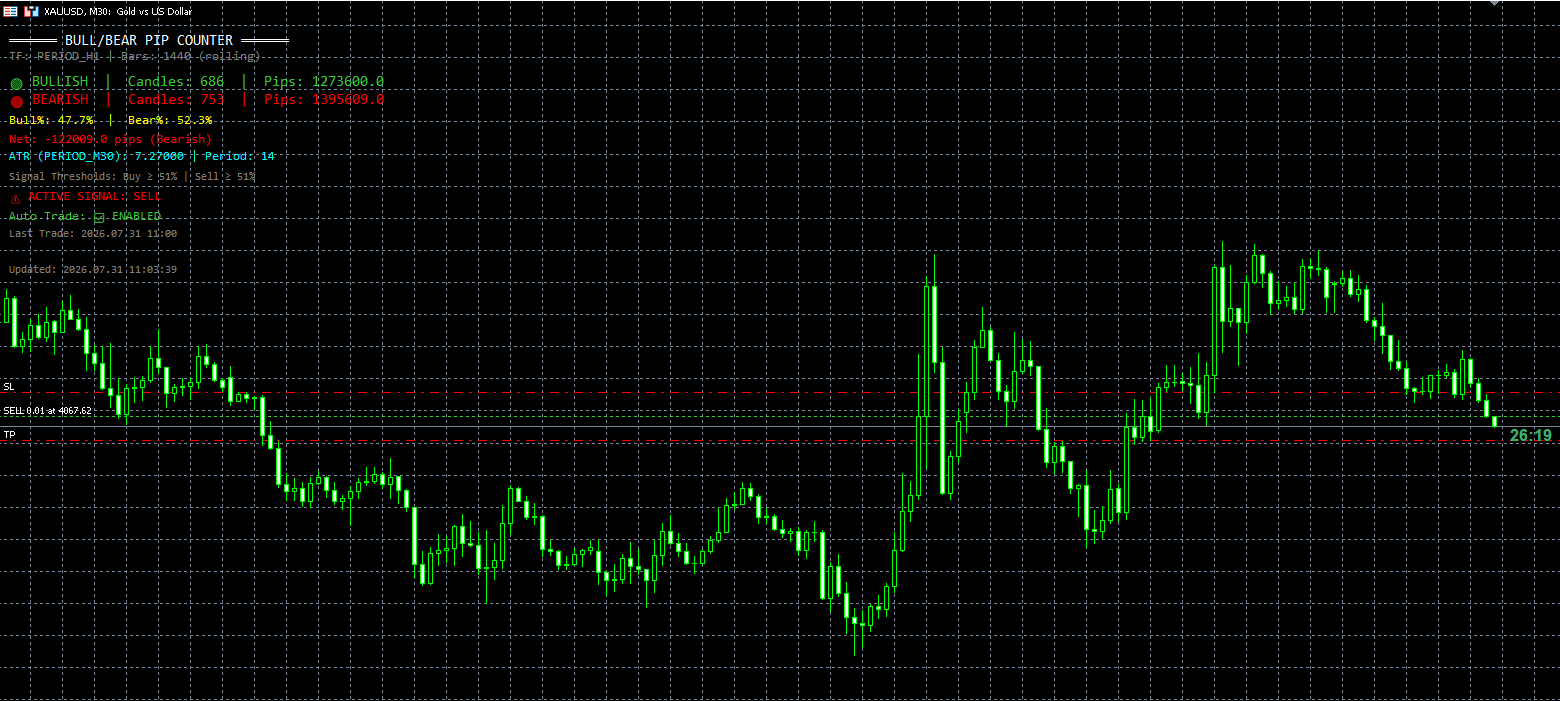
I have another fully featured bot (Alligator) that I was considering making the source code freely available through the CodeBase here on MQL5.
Jason Smith
Jason Smith
2026.07.31
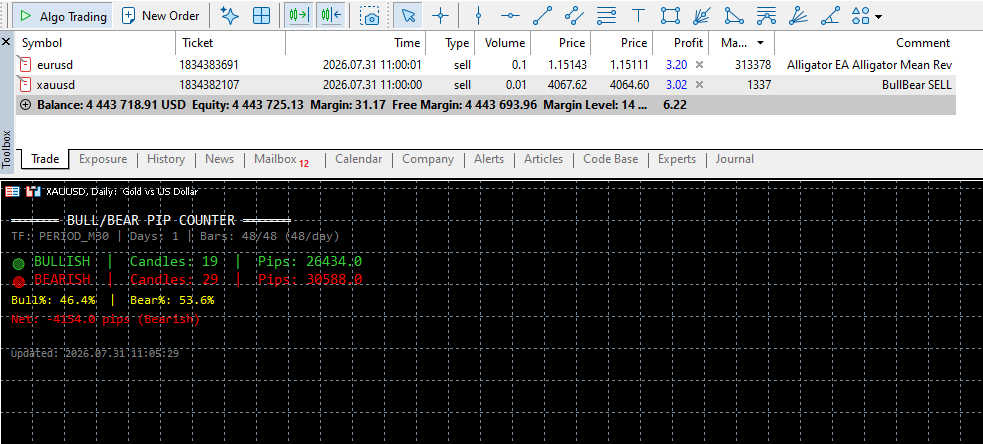
I have more products ready to upload, but I'm not quite ready to get around to it yet.
Jason Smith
Jason Smith
2026.07.31
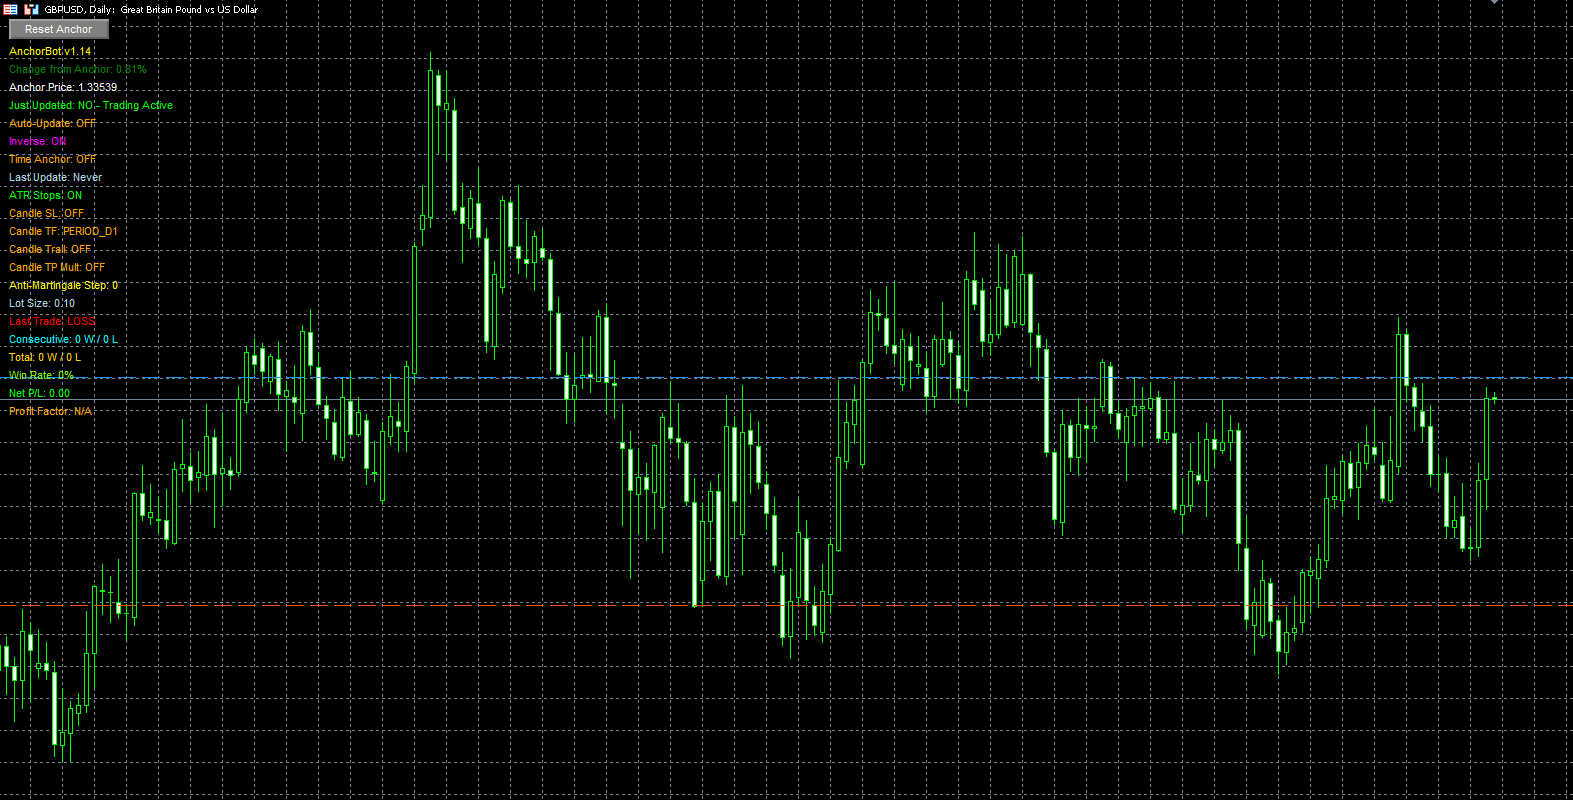
I designed and developed this indicator from the ground up, and the EA version turned out really well.
Jason Smith
Jason Smith
2026.07.31
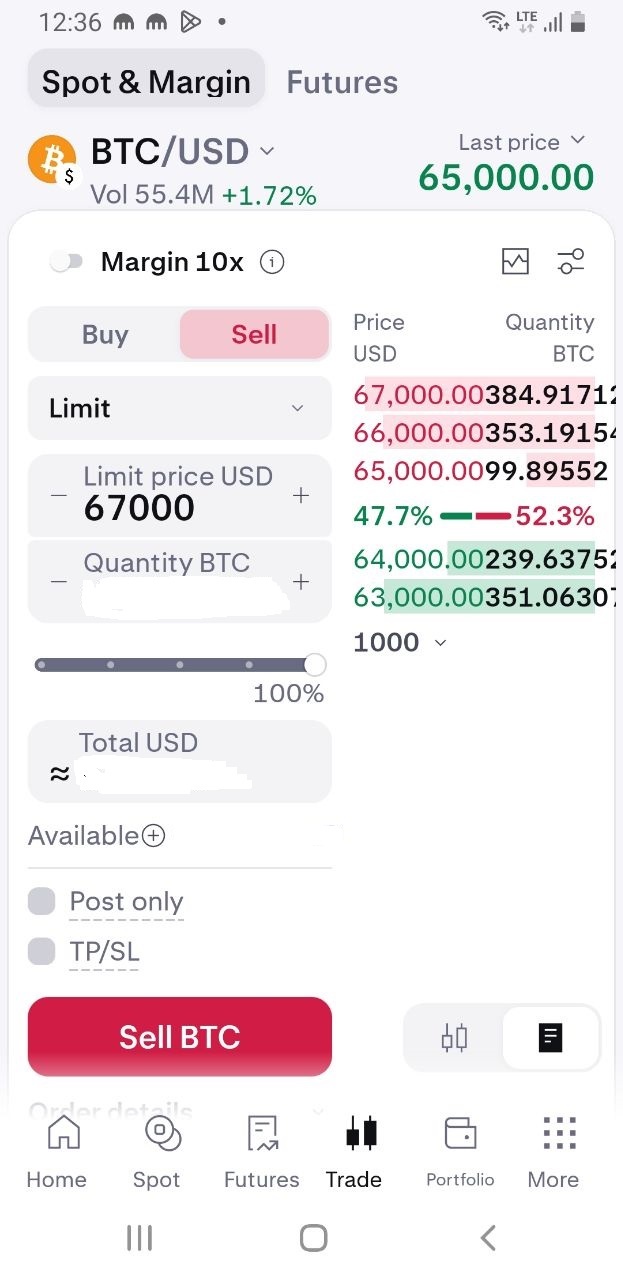
Anchor Bot has been uploaded and has successfully passed all verification checks. The only thing left to do is hit the publish button.
Jason Smith

Show all comments (4)
Conor Mcnamara
2026.07.30
in what way do you convert the currency? through online banking? why do use multiple terminals to monitor the currencies - doesn't it show everything in marketwatch?
Jason Smith
2026.07.30
To convert the currencies, you can use Kraken Pro. It offers more advanced trading tools, lower fees in many cases, and a better experience for placing and managing trades.
Kraken is primarily a cryptocurrency exchange, but it also lets you convert one currency to another within the platform. For example, you can convert GBP to USD or exchange one cryptocurrency for another
Kraken is primarily a cryptocurrency exchange, but it also lets you convert one currency to another within the platform. For example, you can convert GBP to USD or exchange one cryptocurrency for another
Jason Smith
2026.07.30
Regarding the 8 MT5 terminals, we use them to create a currency strength heat map. It's a bit too much to explain in a comment box, so give me a little time and I'll put together a proper post showing exactly how it works. I also have a unique way of using trade copiers that I haven't seen anyone else use. I'll try to cover that in a separate post as well.
Jason Smith
Jason Smith
2026.07.30
I came from the gutter, 100%. I’ve faced challenges, made mistakes, learned from them, and kept pushing forward. If I can improve, overcome obstacles, and build something better for myself, then you can too. No matter where you start, your future is shaped by the choices you make and the effort you put in every day.
Jason Smith
Jason Smith
2026.07.30
Life would get boring without constantly trying to improve, learn, and move forward. Progress and new challenges are what keep things interesting.
Jason Smith
2026.07.30
My goal is to understand the markets so well that I can trade them consistently and confidently. I want financial freedom—not just for myself, but so I can help others.
Jason Smith
Jason Smith
2026.07.30
Getting fed up with Bitcoin and spot trading, so I’m looking for something new to explore.
I’ll keep you updated on how it goes.
I’ll keep you updated on how it goes.
Jason Smith
2026.07.30
I haven’t fully got my head around it yet or figured out exactly how to do it successfully, but I think I have an edge. I just need to work out the correct way to execute it. Fees and costs are going to be an important factor, and you need to use Kraken Pro for it.
Jason Smith
2026.07.30
My plan is simple. I have a unique way of analysing currency groups rather than just looking at individual pairs. I can see all the pairs within a group and track how they move relative to each other over time, almost like a live heat map that updates on the fly.
This allows me to spot relationships, strength, weakness, and potential opportunities across the whole currency group rather than focusing on one pair at a time. Example: Start with £1,000 GBP and move through a currency cycle: GBP → CHF → JPY → GBP → USD The idea is to convert GBP into CHF, then CHF into Japanese yen, then convert the yen back into GBP, and finally move into USD. By tracking the relationships between these currencies, I can look for pricing differences or opportunities within the currency group.
This allows me to spot relationships, strength, weakness, and potential opportunities across the whole currency group rather than focusing on one pair at a time. Example: Start with £1,000 GBP and move through a currency cycle: GBP → CHF → JPY → GBP → USD The idea is to convert GBP into CHF, then CHF into Japanese yen, then convert the yen back into GBP, and finally move into USD. By tracking the relationships between these currencies, I can look for pricing differences or opportunities within the currency group.
Jason Smith
Jason Smith
2026.07.29
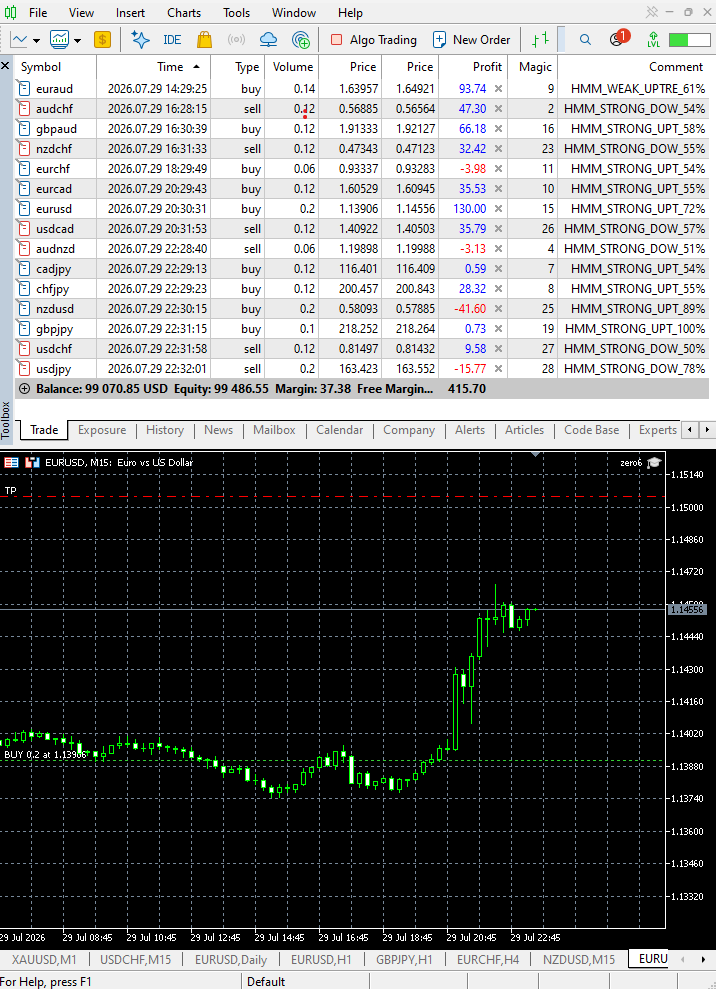
At the start of each trading week, the Markov bots remain inactive until 02:30 GMT. They then trade automatically without interruption until 21:30 GMT on Friday.
Jason Smith
·
2
Jason Smith
2026.07.29
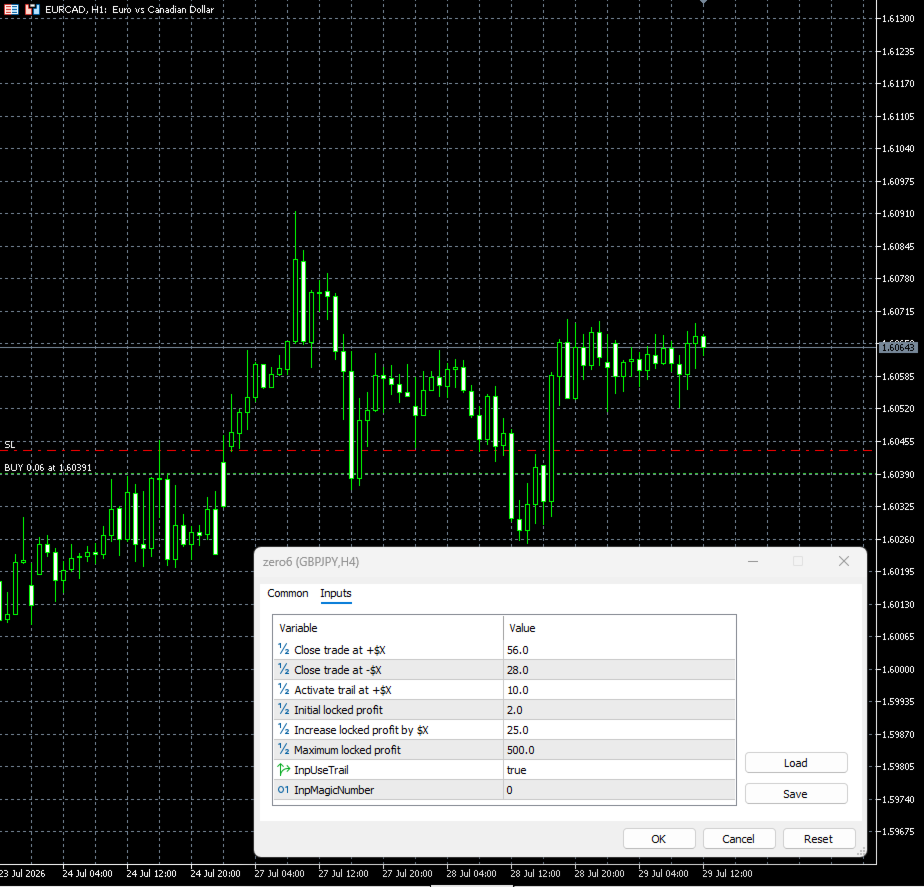
Professional Risk Management Tool Take full control of your trades with a powerful, fully customizable risk management tool designed to protect profits, limit losses, and automate trade management.
Jason Smith
2026.07.29
I haven't published it yet (it will be priced at $99), but if any of you traders would like a free copy, let me know and I'll be happy to help you out.
Jason Smith
2026.07.29
Give this post a like, then send me a DM to get your free download. I can temporarily switch it from $99 to free just for you, so you can download it at no cost.
Jason Smith
Jason Smith
2026.07.29
If oil declines, AI/data centers consume huge amounts of electricity and water, and robots become widespread, what happens to society?
Jason Smith
2026.07.29
The people who understand those shifts early — energy, computing, automation, finance, demographics — are often the ones best positioned to adapt.
Jason Smith
·
1
Jason Smith
2026.07.29
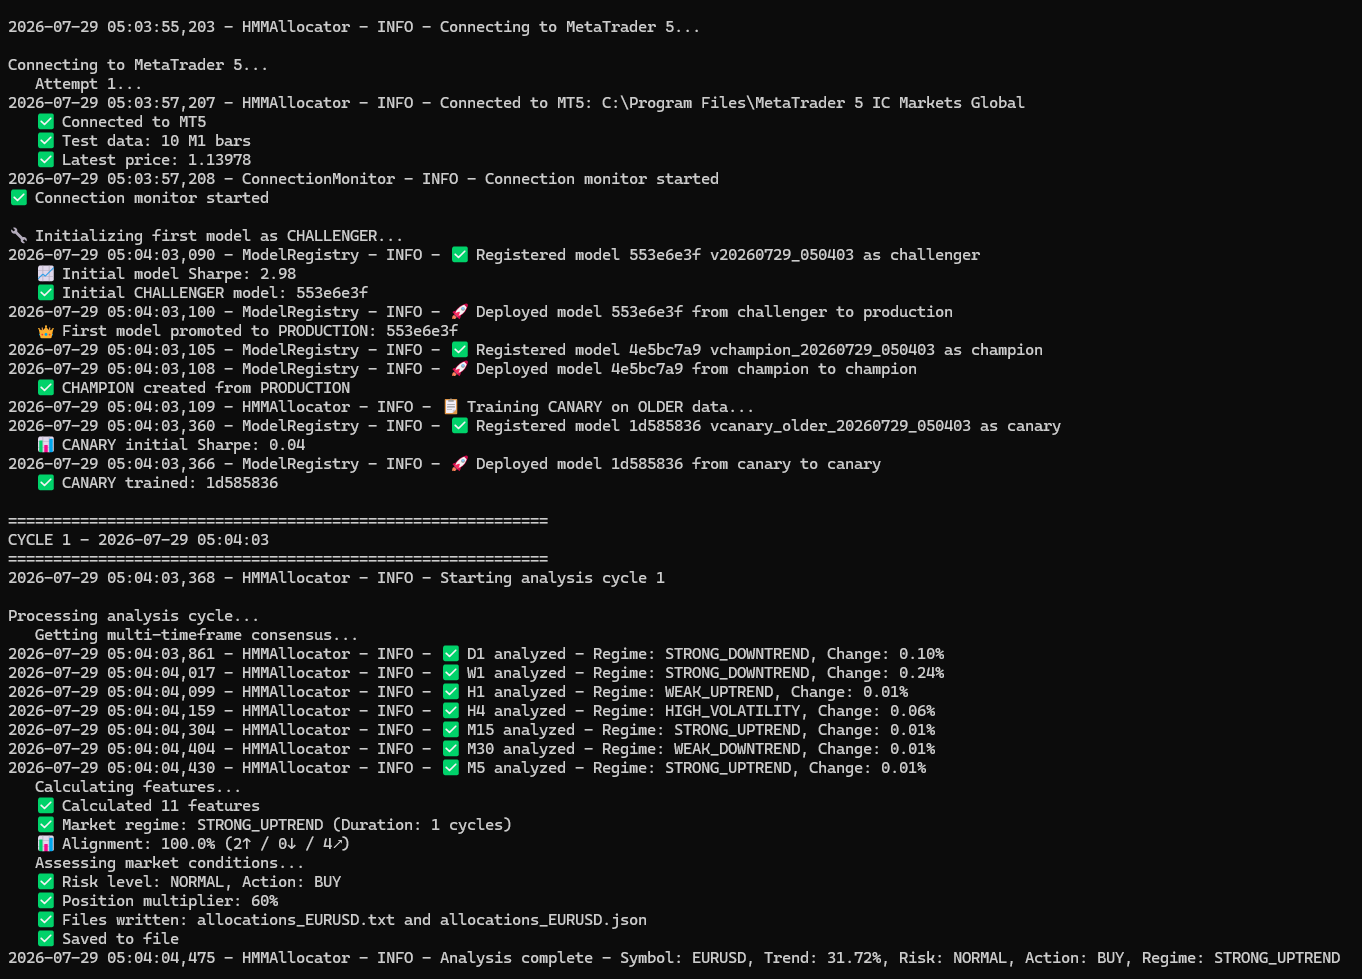
The HMM regime labels are being ignored for alignment purposes. They're just informational. The actual trading decision uses the percentage change alignment.