|
1 year
experience
|
22
products
|
15
demo versions
|
|
2
jobs
|
0
signals
|
0
subscribers
|
The best algorithmic developers aren't just programmers - they're traders who code.
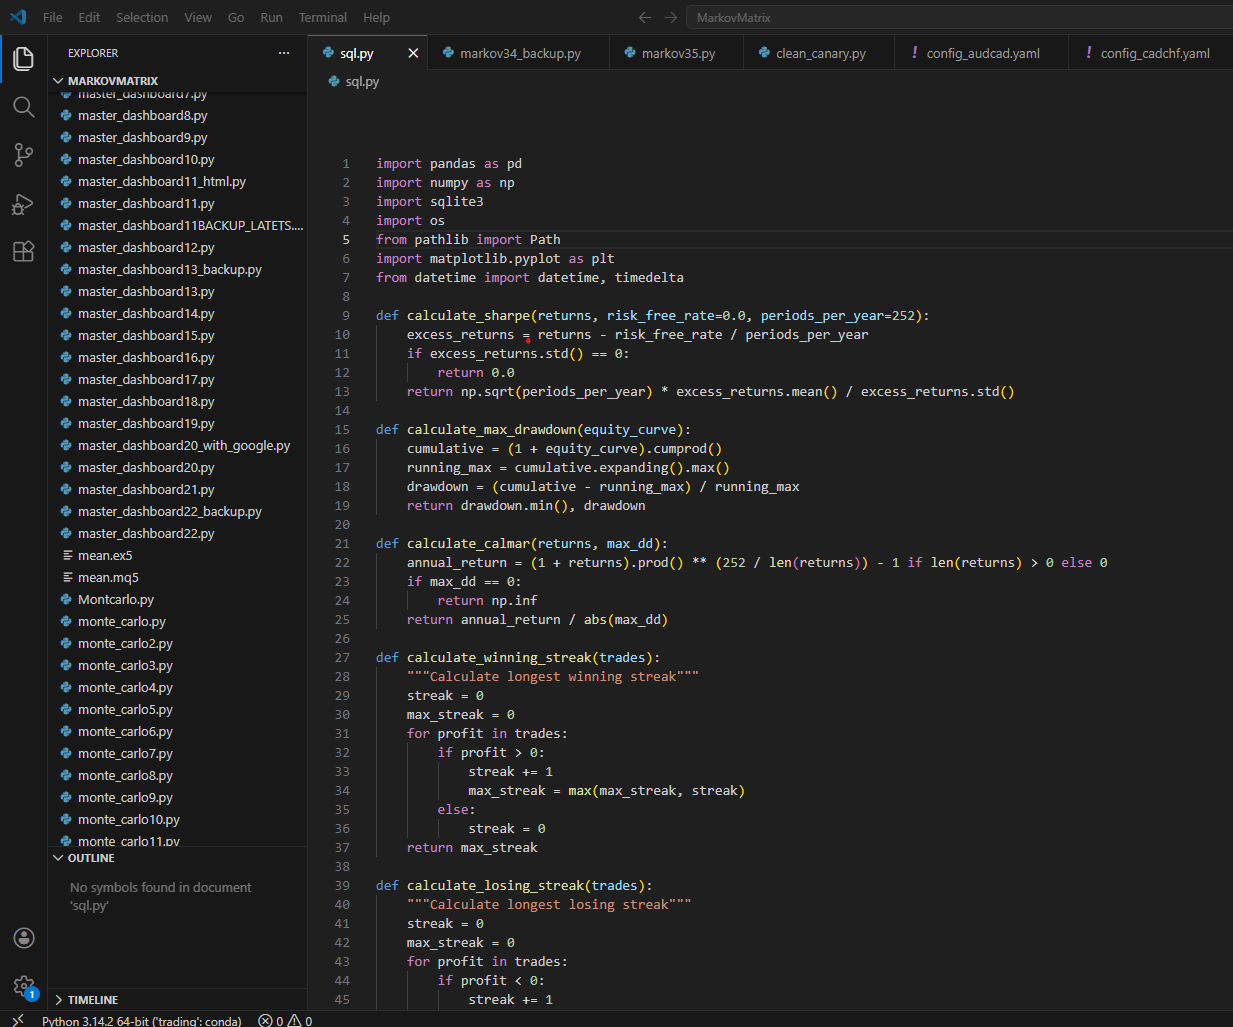
I develop and code custom trading strategies, automation tools and custom software across multiple platforms and languages, including TradingView (Pine Script), MetaTrader 5 (MQL5), Python and other modern development frameworks.
Looking for a quantitative developer role.
I can turn trading strategies into fully functional systems.
Extensive experience with Linux (Gentoo, Debian) and Unix systems (FreeBSD, OpenBSD)
I’m available for projects.You can ask for me directly in the Freelance section.
How Observation Changes Outcomes :
In quantum mechanics, when light (or electrons) passes through two slits, it creates an interference pattern on the screen behind them.
Each particle seems to go through both slits at once, existing in a super position of all possible paths and the resulting pattern reflects the probabilities of where the particle could land.
If you try to measure which slit the particle goes through, the interference pattern disappears.
Observing the particle forces it into a definite state - it goes through one slit or the other.
The act of measurement collapses the wave function and fundamentally changes the outcome.
Before you check a trade, it’s in super position.
From a statistical perspective, your trade has a probability of winning or losing based on your system but you don’t yet know the outcome.
The trade is evolving naturally, just like a quantum system.
The moment you look at it, your observation collapses the “trade wave function” into a definite state - good or bad, winning or losing.
That observation triggers an emotional reaction — stress, fear, or overconfidence—which can cause you to break your plan, over-leverage, or revenge trade.
Just like in quantum mechanics, the act of measurement affects the system.
If you hadn’t looked, the system would have continued evolving naturally and you would have followed your plan without emotional interference.
This analogy mirrors the quantum concept perfectly - observation changes the outcome, not because the market changed, but because your interaction with it changed your behavior.
In other words, checking too often destroys the natural probabilistic outcome of your system, just like measuring the slit destroys the interference pattern.
The trade itself hasn’t changed; your observation changed how you interact with it, which changes the outcome.
Final Thoughts:
Traders, you know what I’m talking about — in a demo, you can leave your strategy untouched for days, weeks, even months.
The moment it goes live, you start checking too often, micromanaging your trades, and suddenly your observation is affecting the outcome.

Jason Smith
Jason Smith
2026.04.28
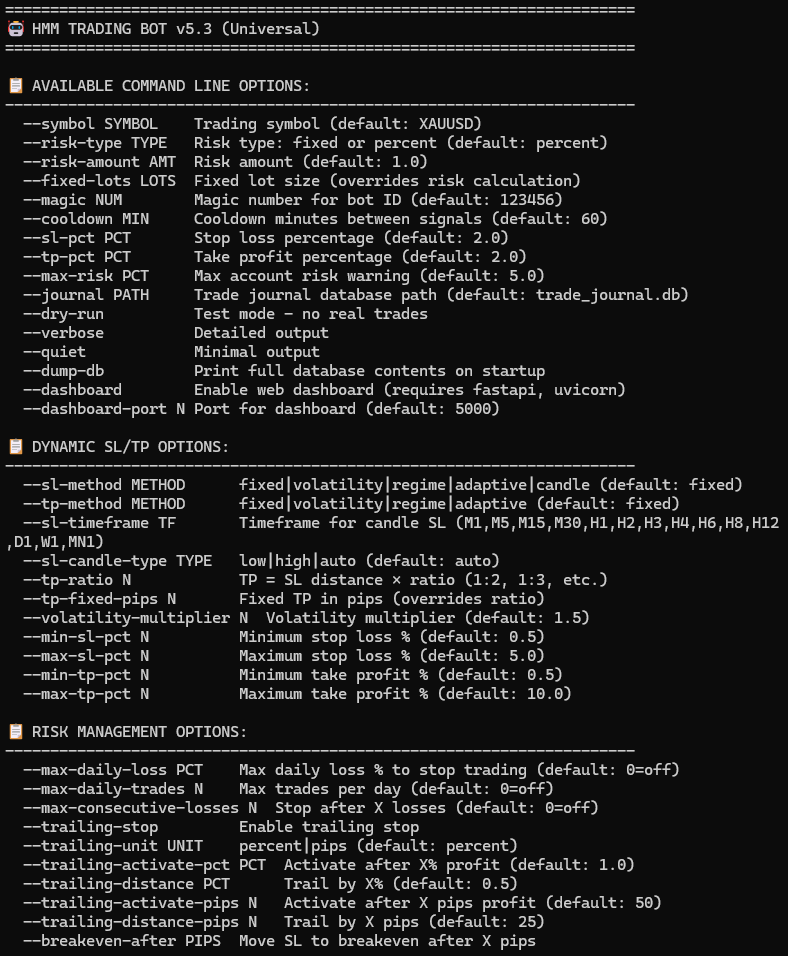
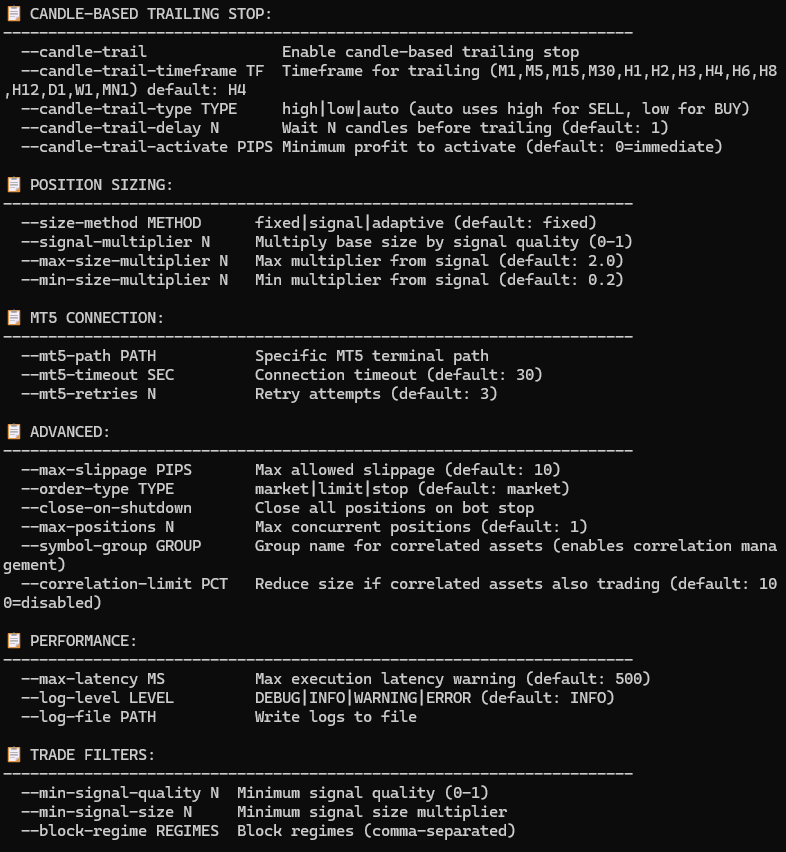
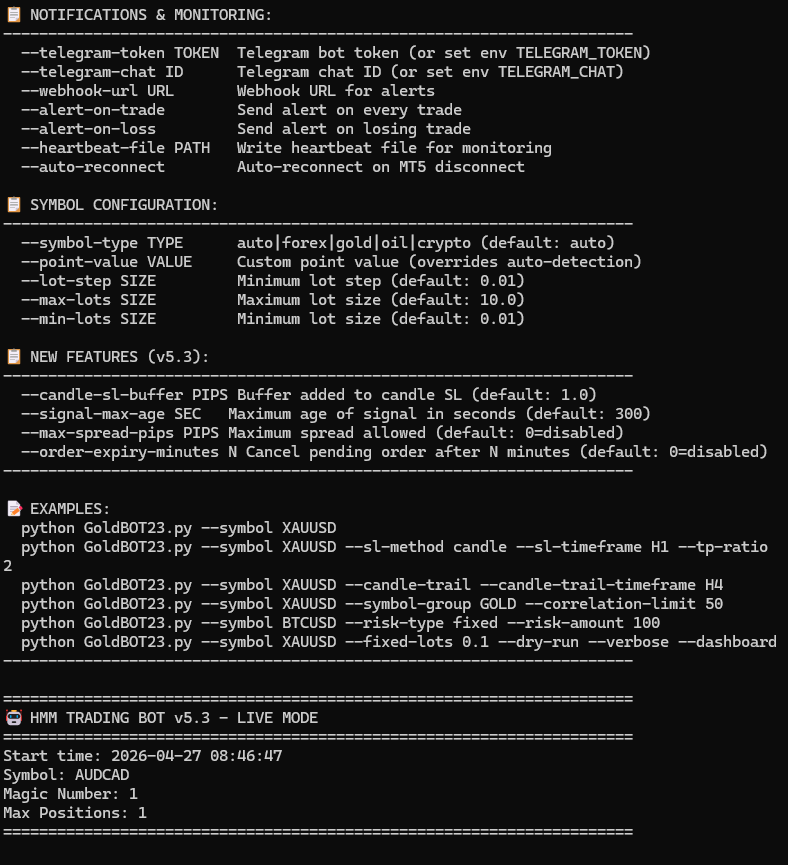
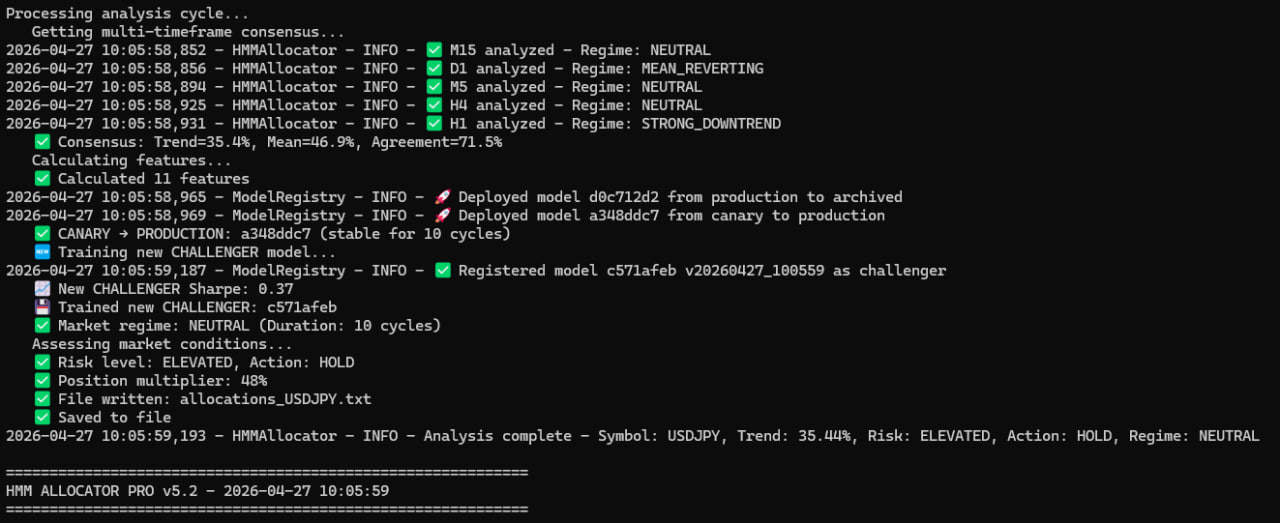
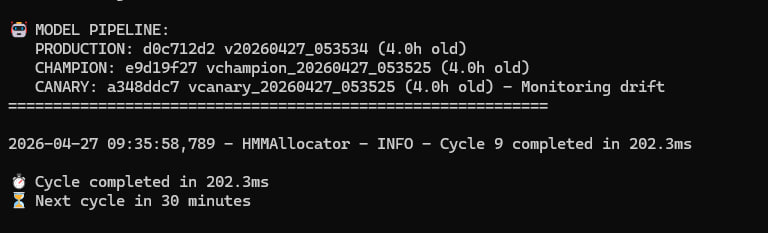
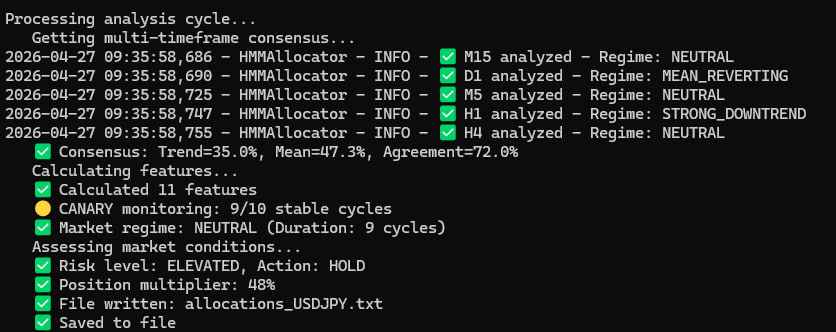
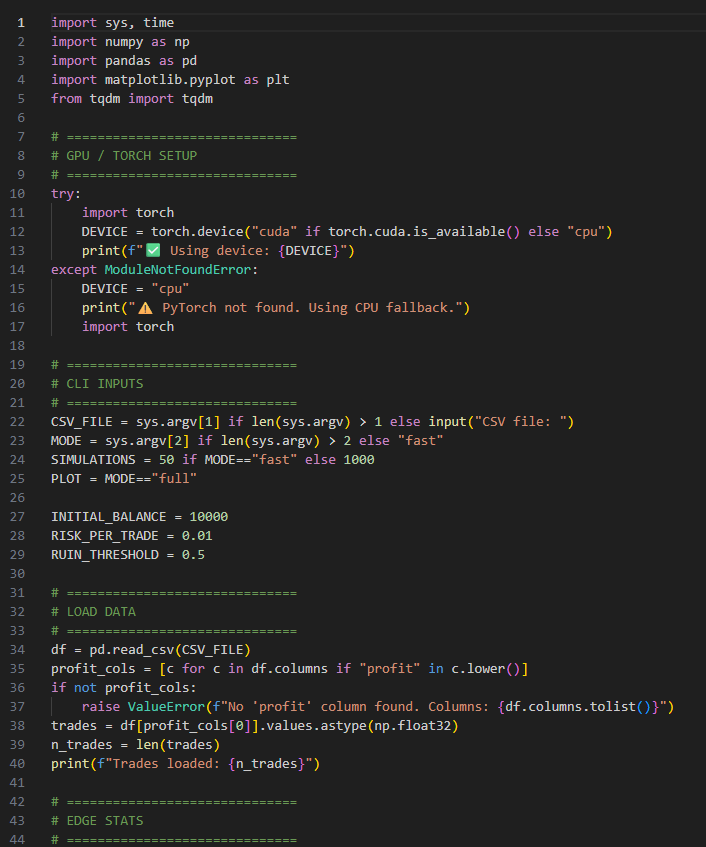
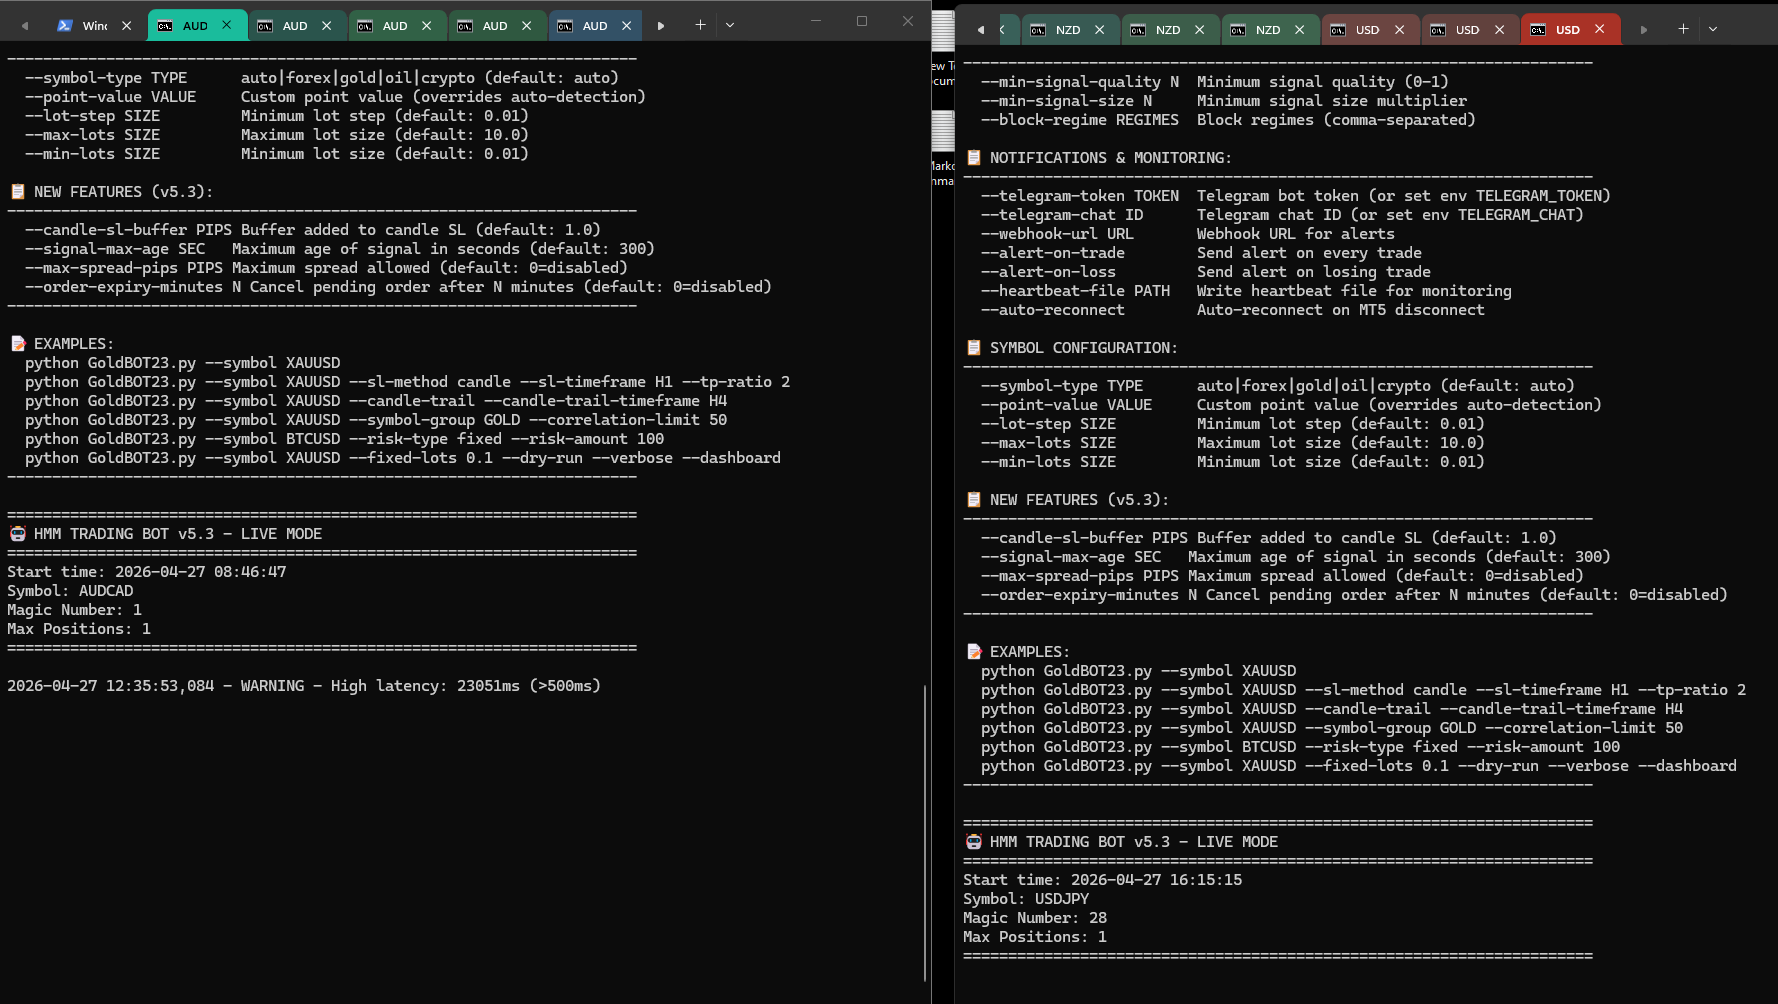
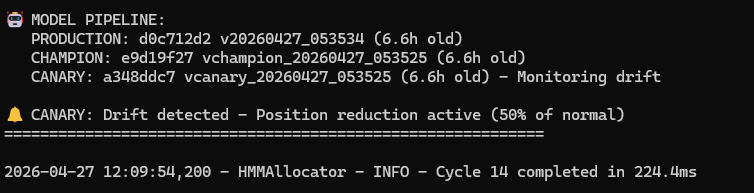
Still in beta and nearly ready for sale. The bot doesn’t even have a proper name yet. It originally started as a gold-only system, which is where the name came from, and the version number reflects how many iterations, upgrades, and debug cycles it’s gone through since those early “goldbot” builds. What I have now could be the final version, but I still need to finish testing all the CLI flags before confirming that.

Jason Smith
Jason Smith
2026.04.27
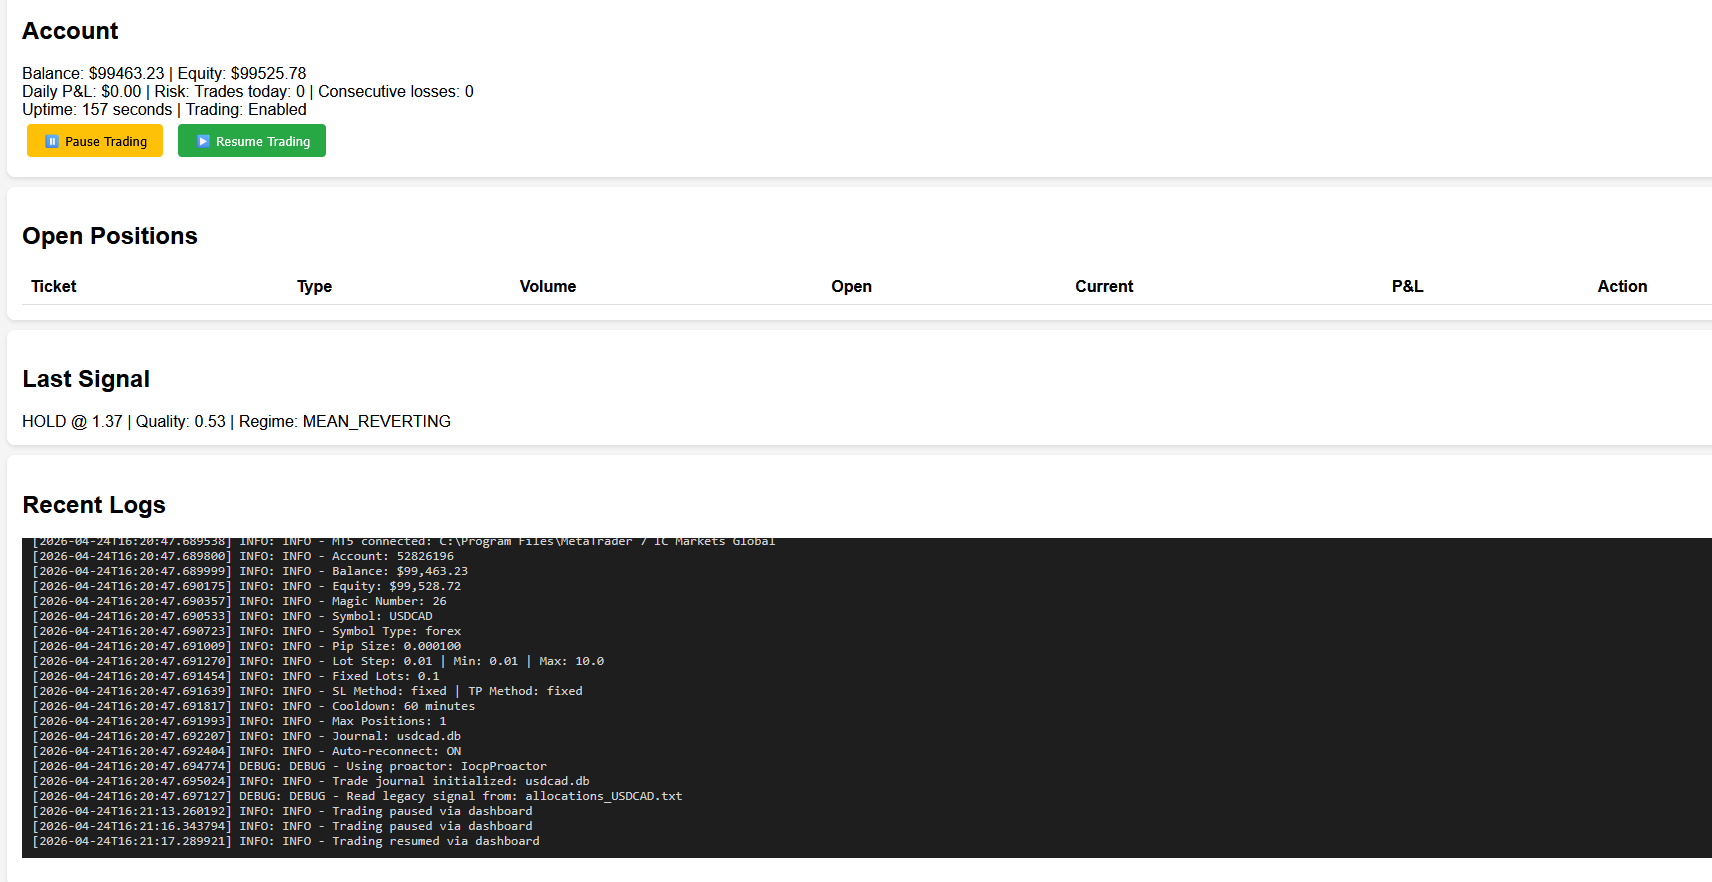
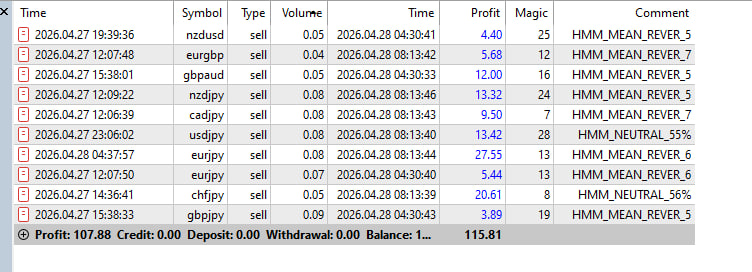
Includes full instructions and ongoing support, along with a comprehensive PDF guide explaining how to use the system and customise it to trade a wide range of assets, including indices, oil, gold, Bitcoin, stocks, and more.