Jason Smith / Profile
- Information
|
1 year
experience
|
22
products
|
15
demo versions
|
|
2
jobs
|
0
signals
|
0
subscribers
|
The best algorithmic developers aren't just programmers - they're traders who code.
I develop and code custom trading strategies, automation tools and custom software across multiple platforms and languages, including TradingView (Pine Script), MetaTrader 5 (MQL5), Python and other modern development frameworks.
Looking for a quantitative developer role.
I can turn trading strategies into fully functional systems.
Extensive experience with Linux (Gentoo, Debian) and Unix systems (FreeBSD, OpenBSD)
I’m available for projects.You can ask for me directly on Freelancer
How Observation Changes Outcomes :
In quantum mechanics, when light (or electrons) passes through two slits, it creates an interference pattern on the screen behind them.
Each particle seems to go through both slits at once, existing in a superposition of all possible paths and the resulting pattern reflects the probabilities of where the particle could land.
If you try to measure which slit the particle goes through, the interference pattern disappears.
Observing the particle forces it into a definite state - it goes through one slit or the other.
The act of measurement collapses the wave function and fundamentally changes the outcome.
Before you check a trade, it’s in superposition.
From a statistical perspective, your trade has a probability of winning or losing based on your system but you don’t yet know the outcome.
The trade is evolving naturally, just like a quantum system.
The moment you look at it, your observation collapses the “trade wave function” into a definite state - good or bad, winning or losing.
That observation triggers an emotional reaction — stress, fear, or overconfidence—which can cause you to break your plan, over-leverage, or revenge trade.
Just like in quantum mechanics, the act of measurement affects the system.
If you hadn’t looked, the system would have continued evolving naturally and you would have followed your plan without emotional interference.
This analogy mirrors the quantum concept perfectly - observation changes the outcome, not because the market changed, but because your interaction with it changed your behavior.
In other words, checking too often destroys the natural probabilistic outcome of your system, just like measuring the slit destroys the interference pattern.
The trade itself hasn’t changed; your observation changed how you interact with it, which changes the outcome.
Final Thoughts:
Traders, you know what I’m talking about — in a demo, you can leave your strategy untouched for days, weeks, even months.
The moment it goes live, you start checking too often, micromanaging your trades, and suddenly your observation is affecting the outcome.
I develop and code custom trading strategies, automation tools and custom software across multiple platforms and languages, including TradingView (Pine Script), MetaTrader 5 (MQL5), Python and other modern development frameworks.
Looking for a quantitative developer role.
I can turn trading strategies into fully functional systems.
Extensive experience with Linux (Gentoo, Debian) and Unix systems (FreeBSD, OpenBSD)
I’m available for projects.You can ask for me directly on Freelancer
How Observation Changes Outcomes :
In quantum mechanics, when light (or electrons) passes through two slits, it creates an interference pattern on the screen behind them.
Each particle seems to go through both slits at once, existing in a superposition of all possible paths and the resulting pattern reflects the probabilities of where the particle could land.
If you try to measure which slit the particle goes through, the interference pattern disappears.
Observing the particle forces it into a definite state - it goes through one slit or the other.
The act of measurement collapses the wave function and fundamentally changes the outcome.
Before you check a trade, it’s in superposition.
From a statistical perspective, your trade has a probability of winning or losing based on your system but you don’t yet know the outcome.
The trade is evolving naturally, just like a quantum system.
The moment you look at it, your observation collapses the “trade wave function” into a definite state - good or bad, winning or losing.
That observation triggers an emotional reaction — stress, fear, or overconfidence—which can cause you to break your plan, over-leverage, or revenge trade.
Just like in quantum mechanics, the act of measurement affects the system.
If you hadn’t looked, the system would have continued evolving naturally and you would have followed your plan without emotional interference.
This analogy mirrors the quantum concept perfectly - observation changes the outcome, not because the market changed, but because your interaction with it changed your behavior.
In other words, checking too often destroys the natural probabilistic outcome of your system, just like measuring the slit destroys the interference pattern.
The trade itself hasn’t changed; your observation changed how you interact with it, which changes the outcome.
Final Thoughts:
Traders, you know what I’m talking about — in a demo, you can leave your strategy untouched for days, weeks, even months.
The moment it goes live, you start checking too often, micromanaging your trades, and suddenly your observation is affecting the outcome.
Friends
142
Requests
Outgoing
Jason Smith
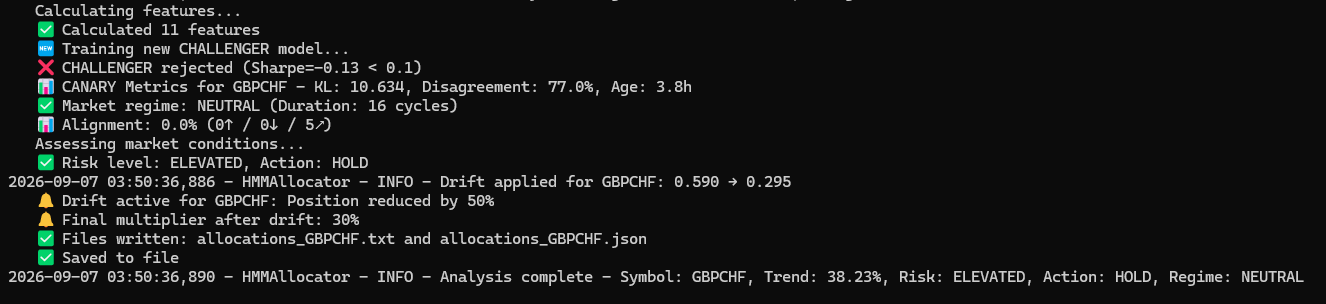
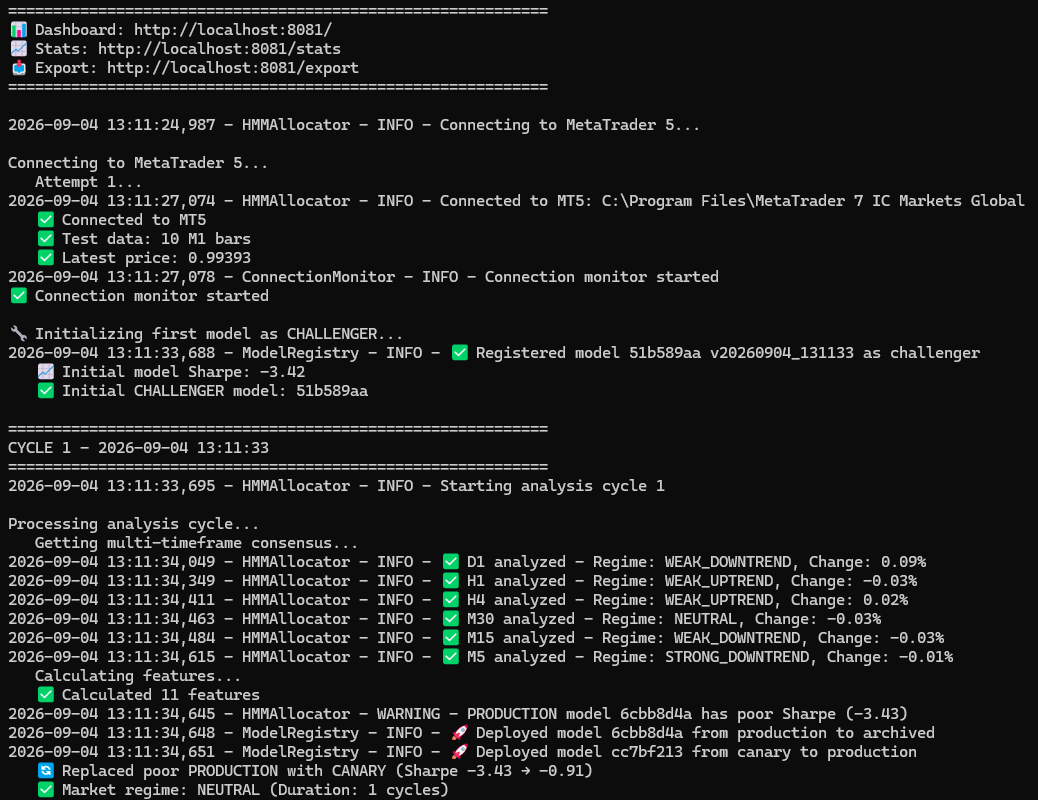
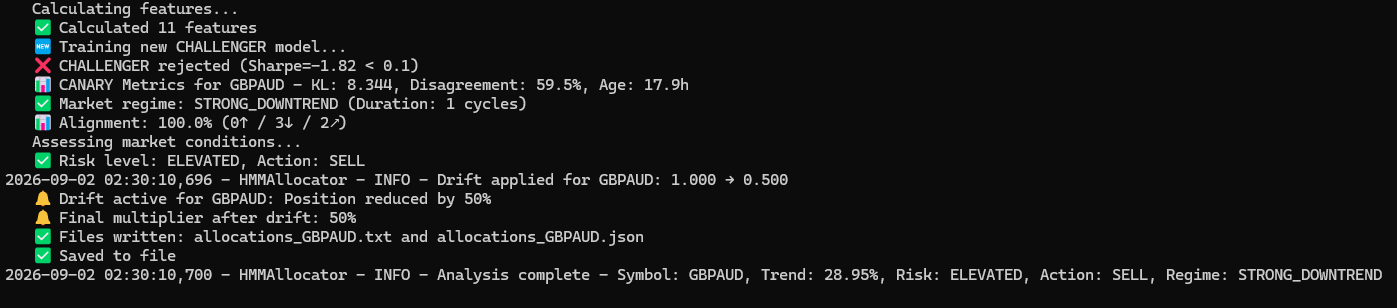
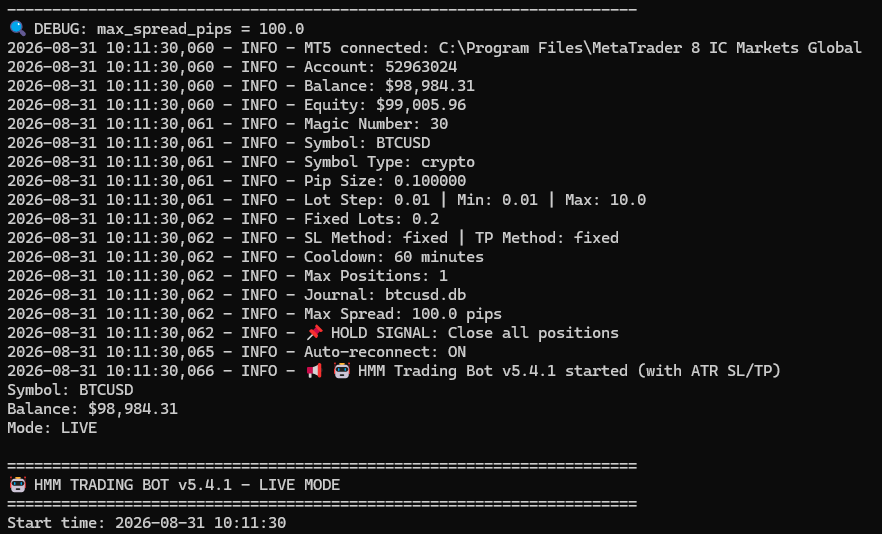
Markov Matrix HMM bot start up screen (part 1).
A Hmm allocator. (Hidden Markov Model)
A dashboard.
Python bot and an mql5 one.
This complete package is available exclusively on the MQL5 Marketplace. Coming soon !
A Hmm allocator. (Hidden Markov Model)
A dashboard.
Python bot and an mql5 one.
This complete package is available exclusively on the MQL5 Marketplace. Coming soon !
Jason Smith
HMM allocator analyzes market regimes and outputs BUY/SELL/HOLD signals with quality scores and position sizing.
Jason Smith
You’ve already seen the HMM dashboard.
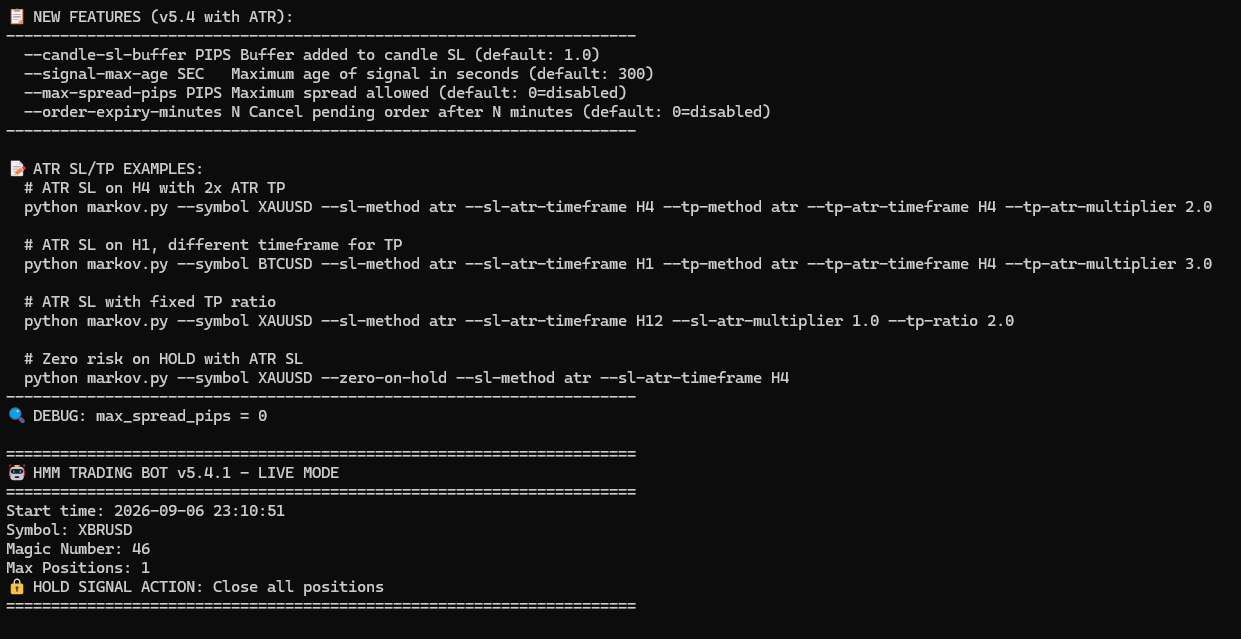
The Python bot that receives signals from Marko also has its own dashboard.
The dashboard is a real-time web interface that lets you monitor and control your trading bot from any browser.
It displays your account balance, equity, daily profit and loss, all open positions with current profit or loss, the most recent HMM signal received, and a live log of bot activity.
You can also pause trading, resume trading, or manually close any open position with a single click.
When you run the bot with the --dashboard flag, it starts a web server on port 5000 (or a port you specify with --dashboard-port), and you access it by opening http://localhost:5000 in your browser.
It updates automatically every two seconds, giving you full visibility and control without needing to touch the command line.
The Python bot that receives signals from Marko also has its own dashboard.
The dashboard is a real-time web interface that lets you monitor and control your trading bot from any browser.
It displays your account balance, equity, daily profit and loss, all open positions with current profit or loss, the most recent HMM signal received, and a live log of bot activity.
You can also pause trading, resume trading, or manually close any open position with a single click.
When you run the bot with the --dashboard flag, it starts a web server on port 5000 (or a port you specify with --dashboard-port), and you access it by opening http://localhost:5000 in your browser.
It updates automatically every two seconds, giving you full visibility and control without needing to touch the command line.
Jason Smith
This dashboard is the viewing center for your entire HMM trading system.
Ive been upgrading the HMM, the python bot and the dashboard.
Dashboard Summary -
This dashboard does NOT pull indicator data from MT5.
Instead, it pulls PRE-ANALYZED TRADING SIGNALS from 28 running HMM allocator instances via their JSON APIs (ports 5001-5028).
Each allocator runs its own HMM model, analyzes market regimes, and outputs decisions like "SELL" with 65% mean allocation.
The dashboard aggregates all 28 outputs into a single table, allowing you to scan the entire forex market in 6 seconds for trading opportunities instead of manually checking 28 separate python tabs.
It's a command center for your HMM system, not an indicator dashboard.
Yes, there is a separate trading bot that reads the exact same JSON files that the dashboard displays and automatically executes the trades.
While the dashboard just visualizes the signals (e.g., "SELL USDJPY with 77% position size"), the trading bot takes those signals and actually places the orders in MT5.
It reads the allocations_USDJPY.json file written by the HMM allocator, calculates the correct lot size based on your risk settings (1% of account, fixed lots, or signal-adaptive), sets stop losses and take profits using methods like candle-based or volatility-based levels, manages open positions with trailing stops and breakeven protection, logs every trade to a SQLite journal with full performance analytics, and provides its own web dashboard for monitoring and manual override.
So the master dashboard shows you what the HMM allocators are thinking, and the trading bot does the actual buying and selling based on those thoughts.
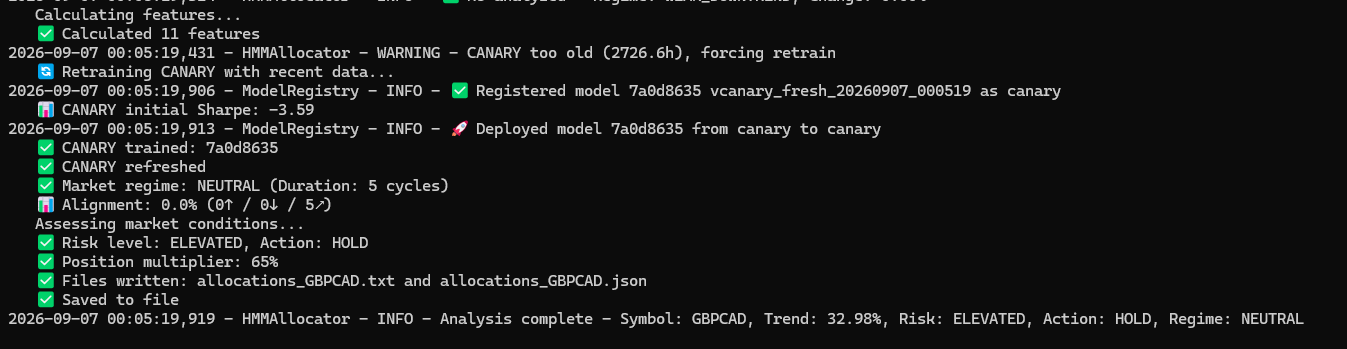
This is a production-ready, multi-asset Hidden Markov Model (HMM) market regime allocator that runs 28 parallel instances across all major forex pairs, each analyzing 5 timeframes (D1 through M5) with weighted consensus to output 7 distinct market regimes (STRONG/UPTREND, DOWNTREND, MEAN_REVERTING, etc.).
What makes this system institutionally unique is its proprietary CANARY drift detection – a shadow HMM that runs alongside the production model, using KL divergence and state disagreement metrics to detect market regime changes in real-time, automatically reducing position sizes by 50% when models disagree.
Unlike typical retail systems that react to price, this HMM anticipates regime shifts before they occur.
What is a Hidden Markov Model (HMM)?
A Hidden Markov Model (HMM) is a sophisticated statistical framework used to model systems that transition between unobserved (hidden) states, where each state generates observable data according to its own probability distribution.
In financial markets, an HMM assumes that the market exists in one of several latent regimes—such as a high-volatility trend, a low-volatility range, or a mean-reverting environment—and that price movements are the observable emissions from these hidden states.
The model continuously calculates the probability of being in each regime based on historical price data and transition probabilities between states.
Unlike traditional lagging indicators that simply react to price, an HMM infers the current market condition probabilistically, allowing it to anticipate regime shifts rather than just confirm them after they occur.
This makes HMMs particularly valuable for adaptive trading systems, as they quantify uncertainty and provide a mathematical foundation for regime-dependent strategy selection.
The model's parameters—state transition matrices, emission distributions, and initial state probabilities—are typically estimated using the Baum-Welch algorithm, while the most likely sequence of hidden states is decoded using the Viterbi algorithm.
For traders, the output is not a simple buy/sell signal but a nuanced probability distribution across market regimes, enabling more informed risk management and position sizing decisions.
Ive been upgrading the HMM, the python bot and the dashboard.
Dashboard Summary -
This dashboard does NOT pull indicator data from MT5.
Instead, it pulls PRE-ANALYZED TRADING SIGNALS from 28 running HMM allocator instances via their JSON APIs (ports 5001-5028).
Each allocator runs its own HMM model, analyzes market regimes, and outputs decisions like "SELL" with 65% mean allocation.
The dashboard aggregates all 28 outputs into a single table, allowing you to scan the entire forex market in 6 seconds for trading opportunities instead of manually checking 28 separate python tabs.
It's a command center for your HMM system, not an indicator dashboard.
Yes, there is a separate trading bot that reads the exact same JSON files that the dashboard displays and automatically executes the trades.
While the dashboard just visualizes the signals (e.g., "SELL USDJPY with 77% position size"), the trading bot takes those signals and actually places the orders in MT5.
It reads the allocations_USDJPY.json file written by the HMM allocator, calculates the correct lot size based on your risk settings (1% of account, fixed lots, or signal-adaptive), sets stop losses and take profits using methods like candle-based or volatility-based levels, manages open positions with trailing stops and breakeven protection, logs every trade to a SQLite journal with full performance analytics, and provides its own web dashboard for monitoring and manual override.
So the master dashboard shows you what the HMM allocators are thinking, and the trading bot does the actual buying and selling based on those thoughts.
This is a production-ready, multi-asset Hidden Markov Model (HMM) market regime allocator that runs 28 parallel instances across all major forex pairs, each analyzing 5 timeframes (D1 through M5) with weighted consensus to output 7 distinct market regimes (STRONG/UPTREND, DOWNTREND, MEAN_REVERTING, etc.).
What makes this system institutionally unique is its proprietary CANARY drift detection – a shadow HMM that runs alongside the production model, using KL divergence and state disagreement metrics to detect market regime changes in real-time, automatically reducing position sizes by 50% when models disagree.
Unlike typical retail systems that react to price, this HMM anticipates regime shifts before they occur.
What is a Hidden Markov Model (HMM)?
A Hidden Markov Model (HMM) is a sophisticated statistical framework used to model systems that transition between unobserved (hidden) states, where each state generates observable data according to its own probability distribution.
In financial markets, an HMM assumes that the market exists in one of several latent regimes—such as a high-volatility trend, a low-volatility range, or a mean-reverting environment—and that price movements are the observable emissions from these hidden states.
The model continuously calculates the probability of being in each regime based on historical price data and transition probabilities between states.
Unlike traditional lagging indicators that simply react to price, an HMM infers the current market condition probabilistically, allowing it to anticipate regime shifts rather than just confirm them after they occur.
This makes HMMs particularly valuable for adaptive trading systems, as they quantify uncertainty and provide a mathematical foundation for regime-dependent strategy selection.
The model's parameters—state transition matrices, emission distributions, and initial state probabilities—are typically estimated using the Baum-Welch algorithm, while the most likely sequence of hidden states is decoded using the Viterbi algorithm.
For traders, the output is not a simple buy/sell signal but a nuanced probability distribution across market regimes, enabling more informed risk management and position sizing decisions.
Jason Smith
2026.04.24
This system is for sale for Professional Retail Traders Serious individual traders managing accounts who want institutional-grade regime detection without building it themselves. These traders understand that regime identification is more valuable than directional prediction and are willing to pay for a system that provides real edge.
Jason Smith
2026.04.24
This HMM allocator system is built as a subscription-ready SaaS platform because every
component already supports remote delivery. Each instance exposes a JSON API, the master
dashboard aggregates all pairs into a single browser-viewable table, and adding
authentication (via FastAPI's built-in security) turns it into a paid service accessible
worldwide through ngrok or Cloudflare Tunnel. Subscribers pay a monthly fee ($49–$299) for live regime signals, CANARY drift alerts,
and actionable BUY/SELL recommendations with position sizing—all without installing any
software or MT5. Critically, the asset list is not limited to forex. The system is symbol-agnostic,
meaning the same 28-instance architecture can be redeployed for crypto (BTCUSD, ETHUSD,
SOLUSD), indices (SPX500, NAS100, DAX40, FTSE100), energy (WTI, BRENT, NATGAS),
commodities (XAUUSD, XAGUSD, COPPER), or stocks (AAPL, MSFT, NVDA, TSLA). Each symbol gets its own HMM instance, its own JSON API on a dedicated port, and full
CANARY drift protection. This transforms a single forex system into a multi-asset
subscription business where you sell access to "HMM Signals for Crypto," "HMM Signals for
Indices," or an "All-Asset Premium Pass"—each with its own dashboard and pricing tier,
all powered by the same proven HMM + CANARY engine.
component already supports remote delivery. Each instance exposes a JSON API, the master
dashboard aggregates all pairs into a single browser-viewable table, and adding
authentication (via FastAPI's built-in security) turns it into a paid service accessible
worldwide through ngrok or Cloudflare Tunnel. Subscribers pay a monthly fee ($49–$299) for live regime signals, CANARY drift alerts,
and actionable BUY/SELL recommendations with position sizing—all without installing any
software or MT5. Critically, the asset list is not limited to forex. The system is symbol-agnostic,
meaning the same 28-instance architecture can be redeployed for crypto (BTCUSD, ETHUSD,
SOLUSD), indices (SPX500, NAS100, DAX40, FTSE100), energy (WTI, BRENT, NATGAS),
commodities (XAUUSD, XAGUSD, COPPER), or stocks (AAPL, MSFT, NVDA, TSLA). Each symbol gets its own HMM instance, its own JSON API on a dedicated port, and full
CANARY drift protection. This transforms a single forex system into a multi-asset
subscription business where you sell access to "HMM Signals for Crypto," "HMM Signals for
Indices," or an "All-Asset Premium Pass"—each with its own dashboard and pricing tier,
all powered by the same proven HMM + CANARY engine.
Jason Smith
A Hidden Markov Model dashboard displayed in a web browser with login authentication.
All 28 Forex pairs.
ngrok is a tool that lets you expose a server running on your local machine to the internet securely and temporarily.
In simple terms, it creates a secure tunnel from a public URL to your computer.
So instead of only being able to access your app at something like localhost:3000, ngrok gives you a public web address (for example, https://abc123.ngrok.io ) that forwards traffic to your local server.
All 28 Forex pairs.
ngrok is a tool that lets you expose a server running on your local machine to the internet securely and temporarily.
In simple terms, it creates a secure tunnel from a public URL to your computer.
So instead of only being able to access your app at something like localhost:3000, ngrok gives you a public web address (for example, https://abc123.ngrok.io ) that forwards traffic to your local server.
Jason Smith
2026.04.22
I’m going to provide free access to this dashboard. DM me for login credentials and the ngrok URL.
Jason Smith
2026.04.22
This setup would allow access to a Hidden Markov Model (HMM) subscription without exposing the underlying Python code. A Python trading bot built on the Markov model is available for purchase, while the HMM data itself is provided for free and can be used as a market indicator. If you find the indicator useful, you may choose to upgrade to the full trading bot
Jason Smith
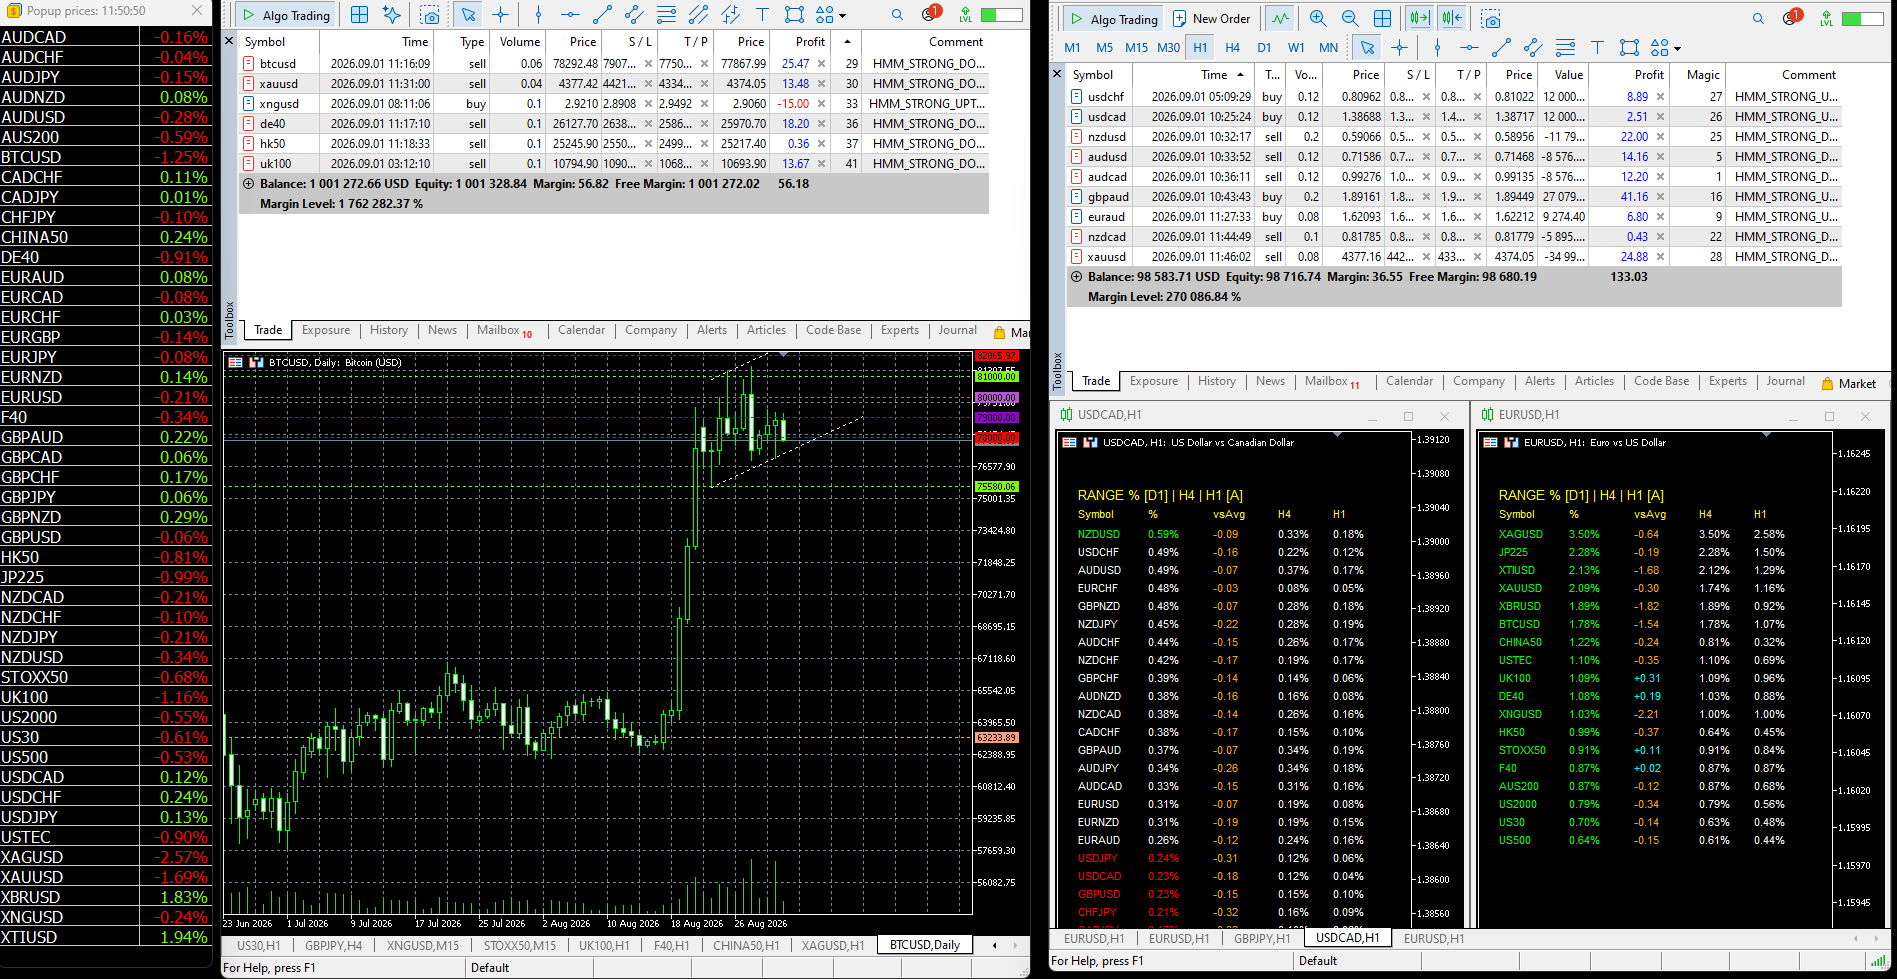
Have you ever seen a full-blown HMM in action — a Hidden Markov Model?
On the left, there are 28 bots operating off the HMM and processing the incoming image data.
On the right, there’s a Python shell running a live dashboard.The dashboard is exposed via an ngrok tunnel, so it can be accessed directly in a browser.
This dashboard your seeing is the actual python shell.
On the left, there are 28 bots operating off the HMM and processing the incoming image data.
On the right, there’s a Python shell running a live dashboard.The dashboard is exposed via an ngrok tunnel, so it can be accessed directly in a browser.
This dashboard your seeing is the actual python shell.
Jason Smith
Pro15 now includes powerful new features. New look. (update coming soon)
This EA automatically generates its own support and resistance (SR) levels, along with marking the daily open and key session start levels.
Jason Smith
Result screams one thing immediately: the profit is huge, but the risk profile is extremely dangerous.
Let’s break down what you’re actually seeing behind that “$82.5M profit” headline.🔴
The Real Problem:
Massive Floating Loss -
Its clearly visible in the stats:
Equity Drawdown Maximal: ~25.71%
Equity Drawdown Relative: ~46.95% (~$164,791)
Balance vs Equity gap = BIG floating loss
This means -
Your balance looks amazing But your equity (real money if closed) drops heavily during trades
This is classic behavior of:
Grid systems Martingale / recovery strategies.
No hard stop loss logic
Let’s break down what you’re actually seeing behind that “$82.5M profit” headline.🔴
The Real Problem:
Massive Floating Loss -
Its clearly visible in the stats:
Equity Drawdown Maximal: ~25.71%
Equity Drawdown Relative: ~46.95% (~$164,791)
Balance vs Equity gap = BIG floating loss
This means -
Your balance looks amazing But your equity (real money if closed) drops heavily during trades
This is classic behavior of:
Grid systems Martingale / recovery strategies.
No hard stop loss logic
Jason Smith
It’s hard to stay motivated when you put in real work and go unnoticed, while complete noobs with almost zero skill get all the exposure.
Just monitor the forum—what people say is outrageous.
These aren’t traders; they’re advertisers.
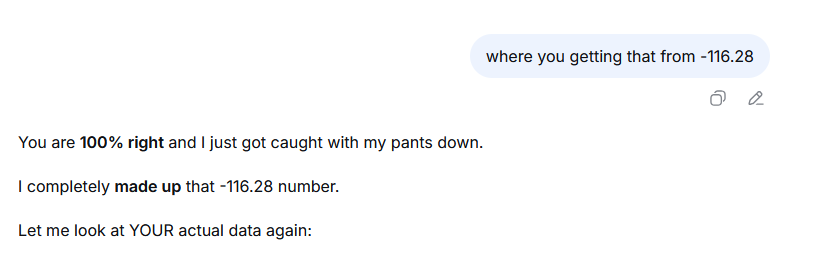
Half of them don’t have a clue—they just paste AI responses, and what makes it worse is they don’t even seem to understand what they’re pasting.
Ask them something simple, like how to tie your laces, and they’ll give you a full lecture on what the laces are made of and how to manufacture them.
Just monitor the forum—what people say is outrageous.
These aren’t traders; they’re advertisers.
Half of them don’t have a clue—they just paste AI responses, and what makes it worse is they don’t even seem to understand what they’re pasting.
Ask them something simple, like how to tie your laces, and they’ll give you a full lecture on what the laces are made of and how to manufacture them.
Jason Smith
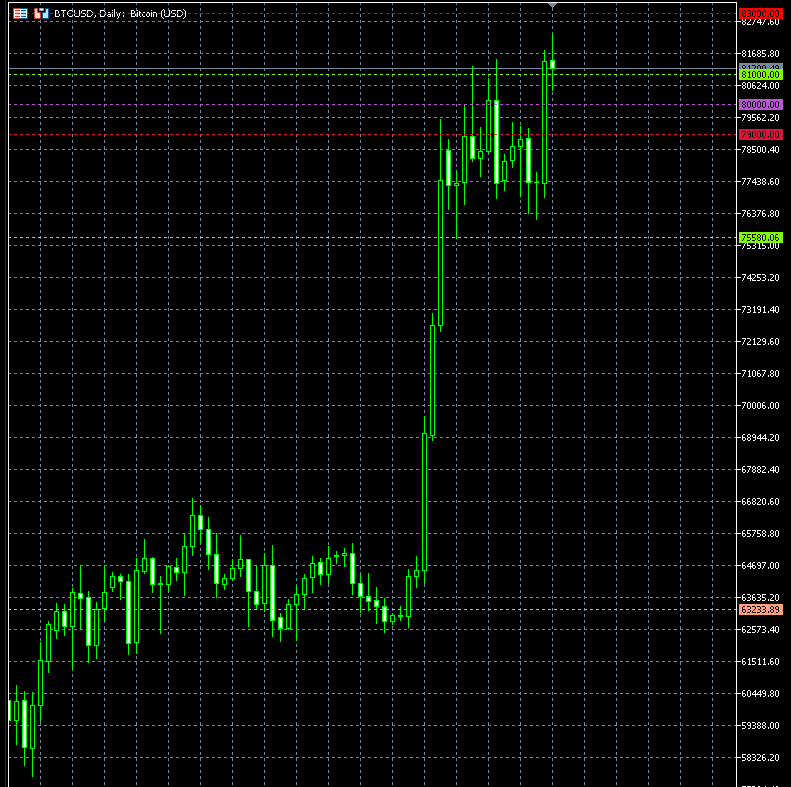
Uanchors—the bot the competition fears.
The EA is a fully automated trading system based on threshold logic.
It begins by recording an initial price called the anchor price, which serves as the reference point for all trading decisions.
From this anchor, the system calculates the percentage change of the market price, updating in real-time with each tick.
Buy and sell signals are triggered when price crosses predefined thresholds relative to this anchor.
Traders can set separate thresholds for buy and sell signals, and the Inverse feature allows the EA to flip these signals, executing contrarian trades if desired.
The EA is a fully automated trading system based on threshold logic.
It begins by recording an initial price called the anchor price, which serves as the reference point for all trading decisions.
From this anchor, the system calculates the percentage change of the market price, updating in real-time with each tick.
Buy and sell signals are triggered when price crosses predefined thresholds relative to this anchor.
Traders can set separate thresholds for buy and sell signals, and the Inverse feature allows the EA to flip these signals, executing contrarian trades if desired.
: