
|
1 year
experience
|
22
products
|
15
demo versions
|
|
2
jobs
|
0
signals
|
0
subscribers
|
The best algorithmic developers aren't just programmers - they're traders who code.
I develop and code custom trading strategies, automation tools and custom software across multiple platforms and languages, including TradingView (Pine Script), MetaTrader 5 (MQL5), Python and other modern development frameworks.
Looking for a quantitative developer role.
I can turn trading strategies into fully functional systems.
Extensive experience with Linux (Gentoo, Debian) and Unix systems (FreeBSD, OpenBSD)
I’m available for projects.You can ask for me directly in the Freelance section.
How Observation Changes Outcomes :
In quantum mechanics, when light (or electrons) passes through two slits, it creates an interference pattern on the screen behind them.
Each particle seems to go through both slits at once, existing in a super position of all possible paths and the resulting pattern reflects the probabilities of where the particle could land.
If you try to measure which slit the particle goes through, the interference pattern disappears.
Observing the particle forces it into a definite state - it goes through one slit or the other.
The act of measurement collapses the wave function and fundamentally changes the outcome.
Before you check a trade, it’s in super position.
From a statistical perspective, your trade has a probability of winning or losing based on your system but you don’t yet know the outcome.
The trade is evolving naturally, just like a quantum system.
The moment you look at it, your observation collapses the “trade wave function” into a definite state - good or bad, winning or losing.
That observation triggers an emotional reaction — stress, fear, or overconfidence—which can cause you to break your plan, over-leverage, or revenge trade.
Just like in quantum mechanics, the act of measurement affects the system.
If you hadn’t looked, the system would have continued evolving naturally and you would have followed your plan without emotional interference.
This analogy mirrors the quantum concept perfectly - observation changes the outcome, not because the market changed, but because your interaction with it changed your behavior.
In other words, checking too often destroys the natural probabilistic outcome of your system, just like measuring the slit destroys the interference pattern.
The trade itself hasn’t changed; your observation changed how you interact with it, which changes the outcome.
Final Thoughts:
Traders, you know what I’m talking about — in a demo, you can leave your strategy untouched for days, weeks, even months.
The moment it goes live, you start checking too often, micromanaging your trades, and suddenly your observation is affecting the outcome.

Jason Smith
Jason Smith
2026.04.24
This system is for sale for Professional Retail Traders Serious individual traders managing accounts who want institutional-grade regime detection without building it themselves. These traders understand that regime identification is more valuable than directional prediction and are willing to pay for a system that provides real edge.
Jason Smith
2026.04.24
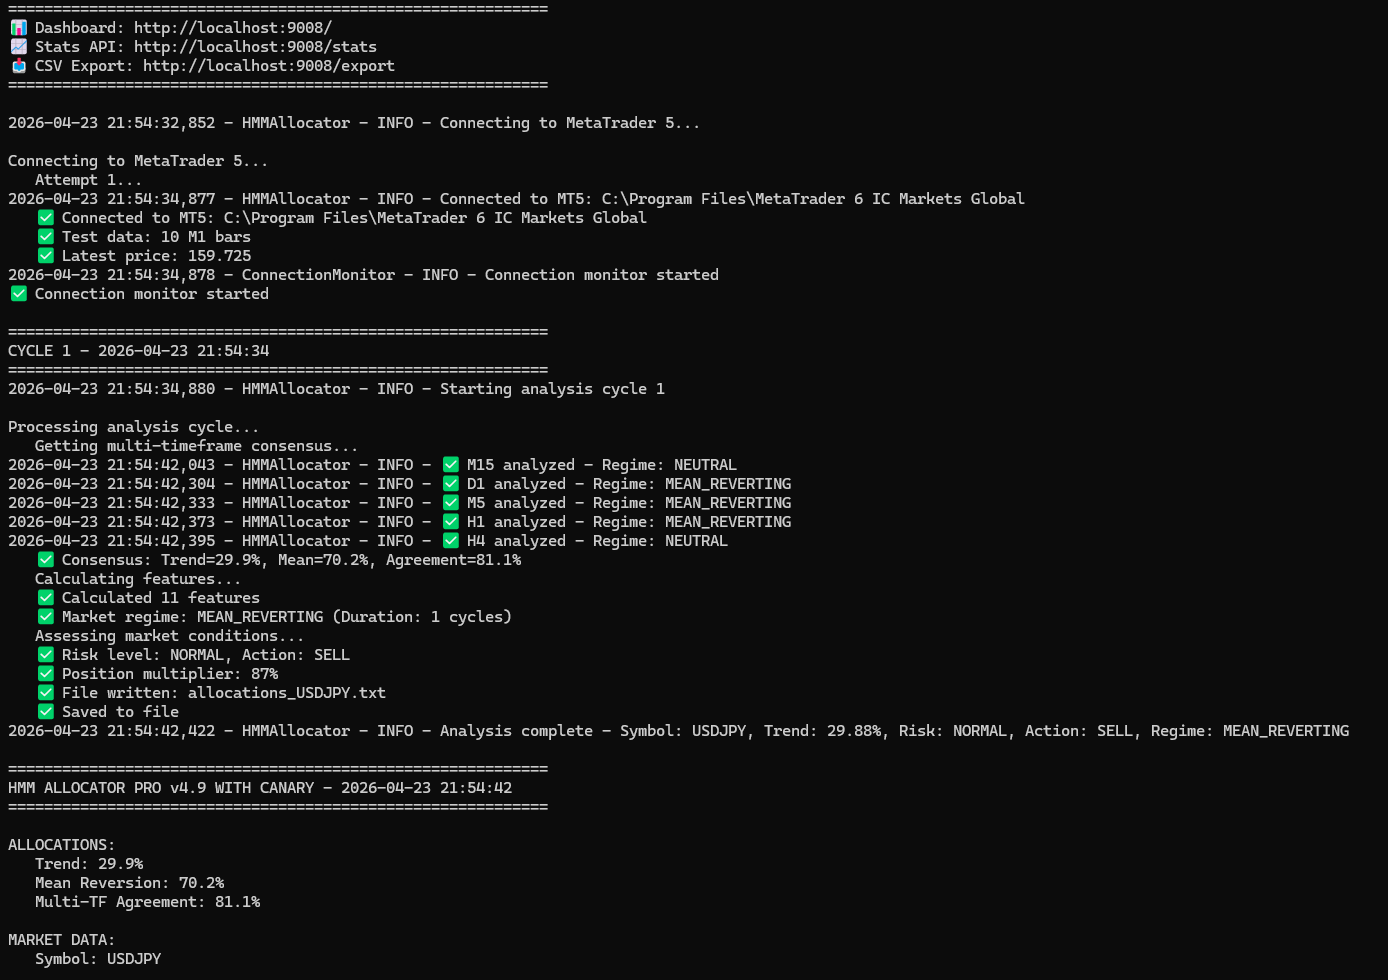
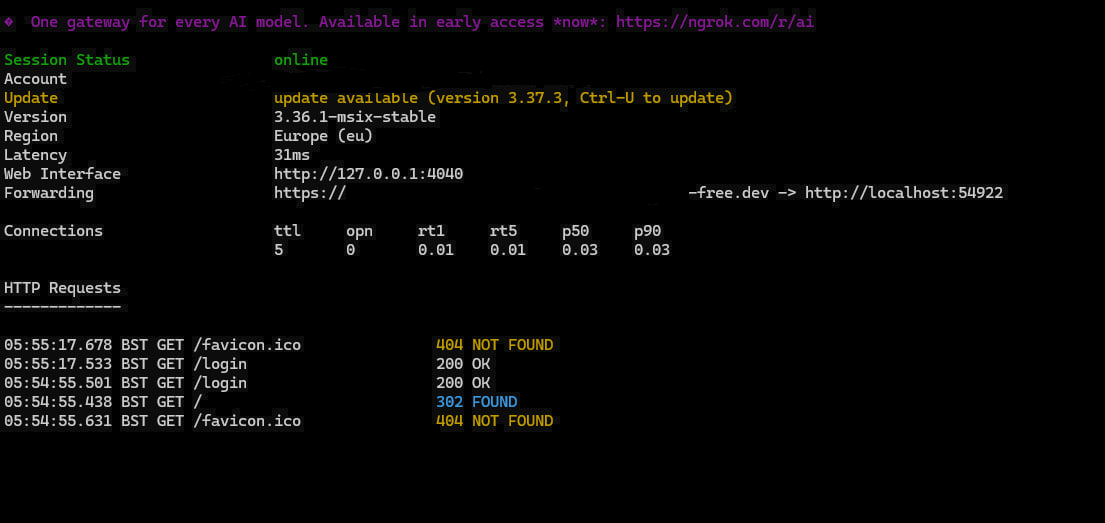
This HMM allocator system is built as a subscription-ready SaaS platform because every
component already supports remote delivery. Each instance exposes a JSON API, the master
dashboard aggregates all pairs into a single browser-viewable table, and adding
authentication (via FastAPI's built-in security) turns it into a paid service accessible
worldwide through ngrok or Cloudflare Tunnel. Subscribers pay a monthly fee ($49–$299) for live regime signals, CANARY drift alerts,
and actionable BUY/SELL recommendations with position sizing—all without installing any
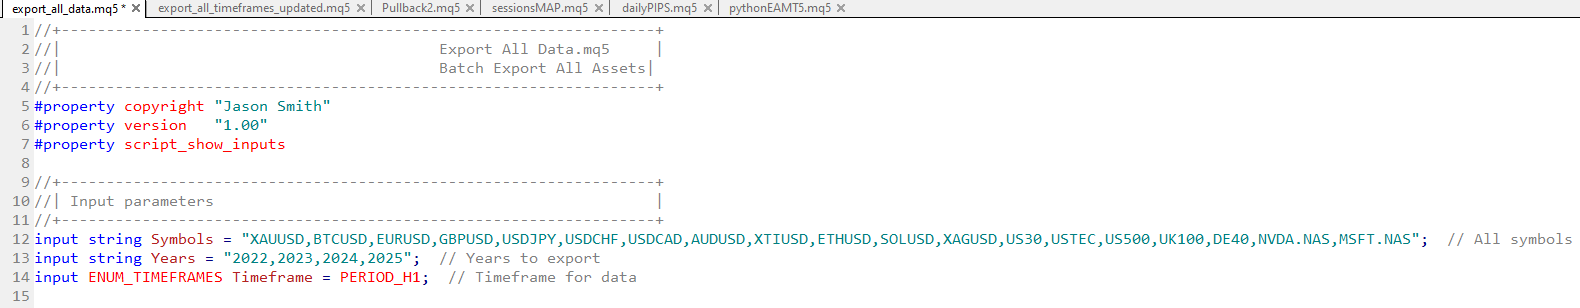
software or MT5. Critically, the asset list is not limited to forex. The system is symbol-agnostic,
meaning the same 28-instance architecture can be redeployed for crypto (BTCUSD, ETHUSD,
SOLUSD), indices (SPX500, NAS100, DAX40, FTSE100), energy (WTI, BRENT, NATGAS),
commodities (XAUUSD, XAGUSD, COPPER), or stocks (AAPL, MSFT, NVDA, TSLA). Each symbol gets its own HMM instance, its own JSON API on a dedicated port, and full
CANARY drift protection. This transforms a single forex system into a multi-asset
subscription business where you sell access to "HMM Signals for Crypto," "HMM Signals for
Indices," or an "All-Asset Premium Pass"—each with its own dashboard and pricing tier,
all powered by the same proven HMM + CANARY engine.
component already supports remote delivery. Each instance exposes a JSON API, the master
dashboard aggregates all pairs into a single browser-viewable table, and adding
authentication (via FastAPI's built-in security) turns it into a paid service accessible
worldwide through ngrok or Cloudflare Tunnel. Subscribers pay a monthly fee ($49–$299) for live regime signals, CANARY drift alerts,
and actionable BUY/SELL recommendations with position sizing—all without installing any
software or MT5. Critically, the asset list is not limited to forex. The system is symbol-agnostic,
meaning the same 28-instance architecture can be redeployed for crypto (BTCUSD, ETHUSD,
SOLUSD), indices (SPX500, NAS100, DAX40, FTSE100), energy (WTI, BRENT, NATGAS),
commodities (XAUUSD, XAGUSD, COPPER), or stocks (AAPL, MSFT, NVDA, TSLA). Each symbol gets its own HMM instance, its own JSON API on a dedicated port, and full
CANARY drift protection. This transforms a single forex system into a multi-asset
subscription business where you sell access to "HMM Signals for Crypto," "HMM Signals for
Indices," or an "All-Asset Premium Pass"—each with its own dashboard and pricing tier,
all powered by the same proven HMM + CANARY engine.
Jason Smith
Jason Smith
2026.04.22
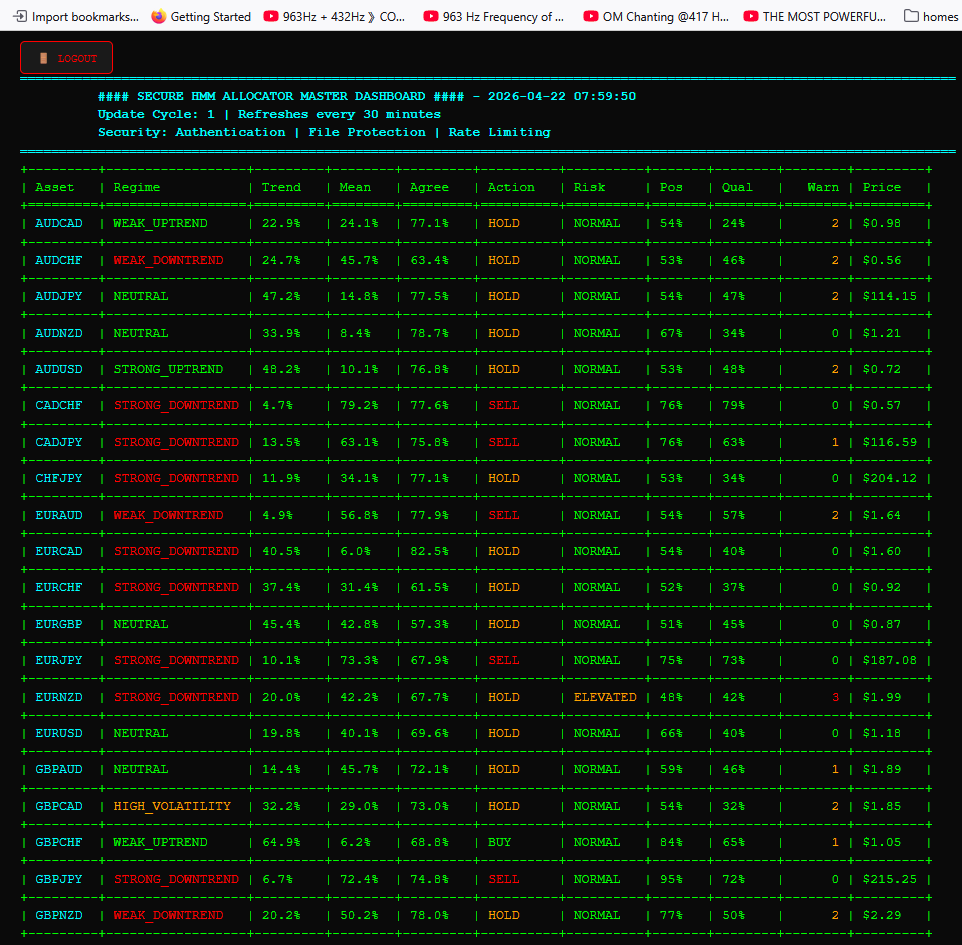
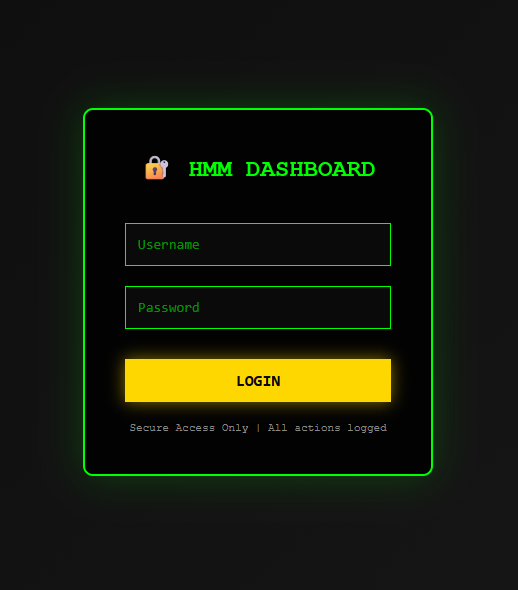
I’m going to provide free access to this dashboard. DM me for login credentials and the ngrok URL.
Jason Smith
2026.04.22
This setup would allow access to a Hidden Markov Model (HMM) subscription without exposing the underlying Python code. A Python trading bot built on the Markov model is available for purchase, while the HMM data itself is provided for free and can be used as a market indicator. If you find the indicator useful, you may choose to upgrade to the full trading bot
Jason Smith
Jason Smith
2026.04.07
I think I’m going to log off for now before I say something I regret. I’m feeling pretty frustrated with the marketplace and struggling to see how some of the other sellers are getting so much traction.
Bans with no clear explanation. Five-star reviews not showing. Even four-star reviews hidden just because the product moved from free to premium. It’s honestly outrageous.
Bans with no clear explanation. Five-star reviews not showing. Even four-star reviews hidden just because the product moved from free to premium. It’s honestly outrageous.
Jason Smith
2026.04.07
The moderators have taken over the forum, spreading low-quality information and outright misinformation. Shame on them.
The other day, they claimed that all EAs on this platform are useless and that you should only buy from active forum members. Yet, if I try to participate—even just answering a question about random things. Even showing music i listen to when they do a poll — I get banned for “self-promotion.” Is this marketplace truly fair, or is it rigged?
If your trying to become a seller. Don't bother
Jason Smith

Jason Smith
2026.04.04
Treat your men as you would your own beloved sons, and they will follow you into the deepest valley.— Sun Tzu
Jason Smith
2026.04.04
Every step forward could trigger hidden dangers — you walk carefully because betrayal is everywhere.
Recognize manipulation and treachery before it reaches the battlefield — sometimes the best defense is awareness. In fact I think we'd be fooling ourselves.
If we had an audience this large and didn't realize that there were some enemies present
Recognize manipulation and treachery before it reaches the battlefield — sometimes the best defense is awareness. In fact I think we'd be fooling ourselves.
If we had an audience this large and didn't realize that there were some enemies present
Jason Smith
Jason Smith
2026.04.04
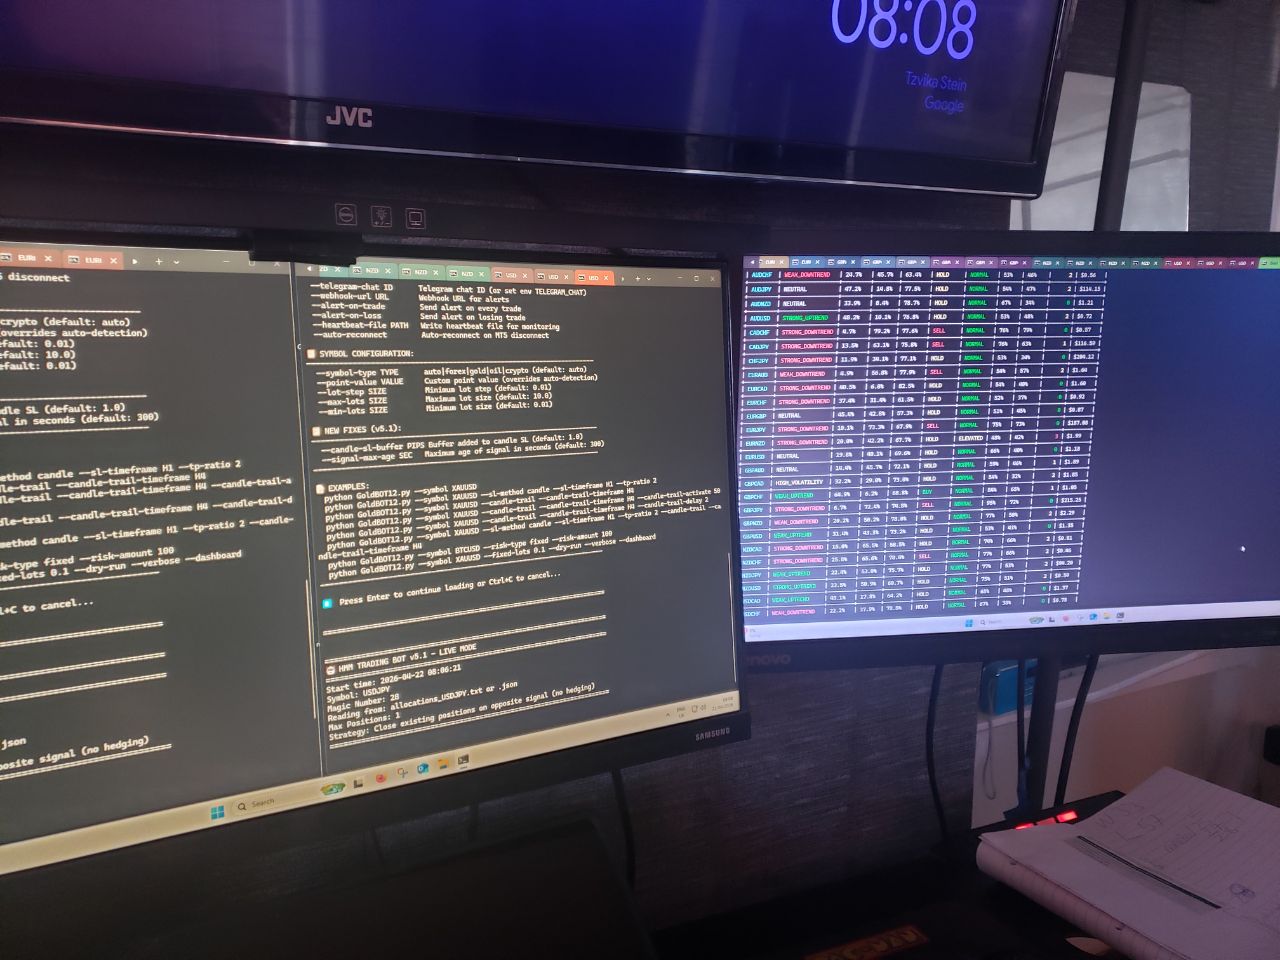
The Python dashboard runs in one shell, ngrok runs in another shell, and a browser connects remotely.


Jason Smith

Jason Smith
2026.04.03
Never came off it, though I came close a few times.
I’ve done over 12,000 miles on this bike.
You can get a bit reckless sometimes and it definitely gets risky when you’re bored or tired.
I’ve done over 12,000 miles on this bike.
You can get a bit reckless sometimes and it definitely gets risky when you’re bored or tired.
Jason Smith
Jason Smith
2026.04.03
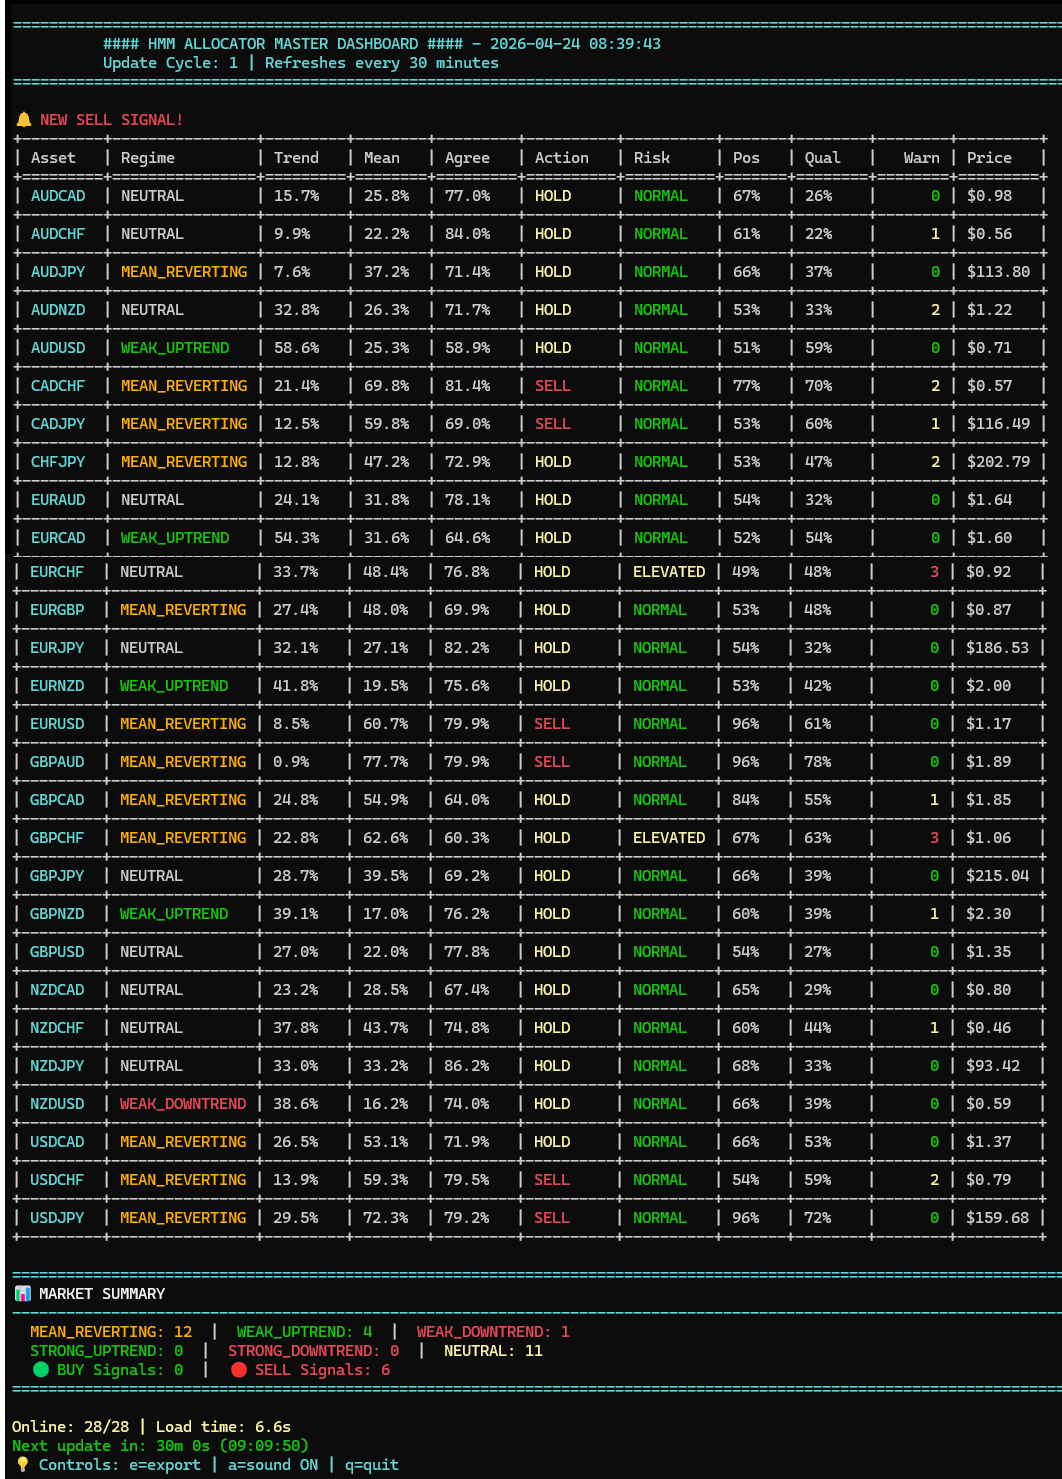
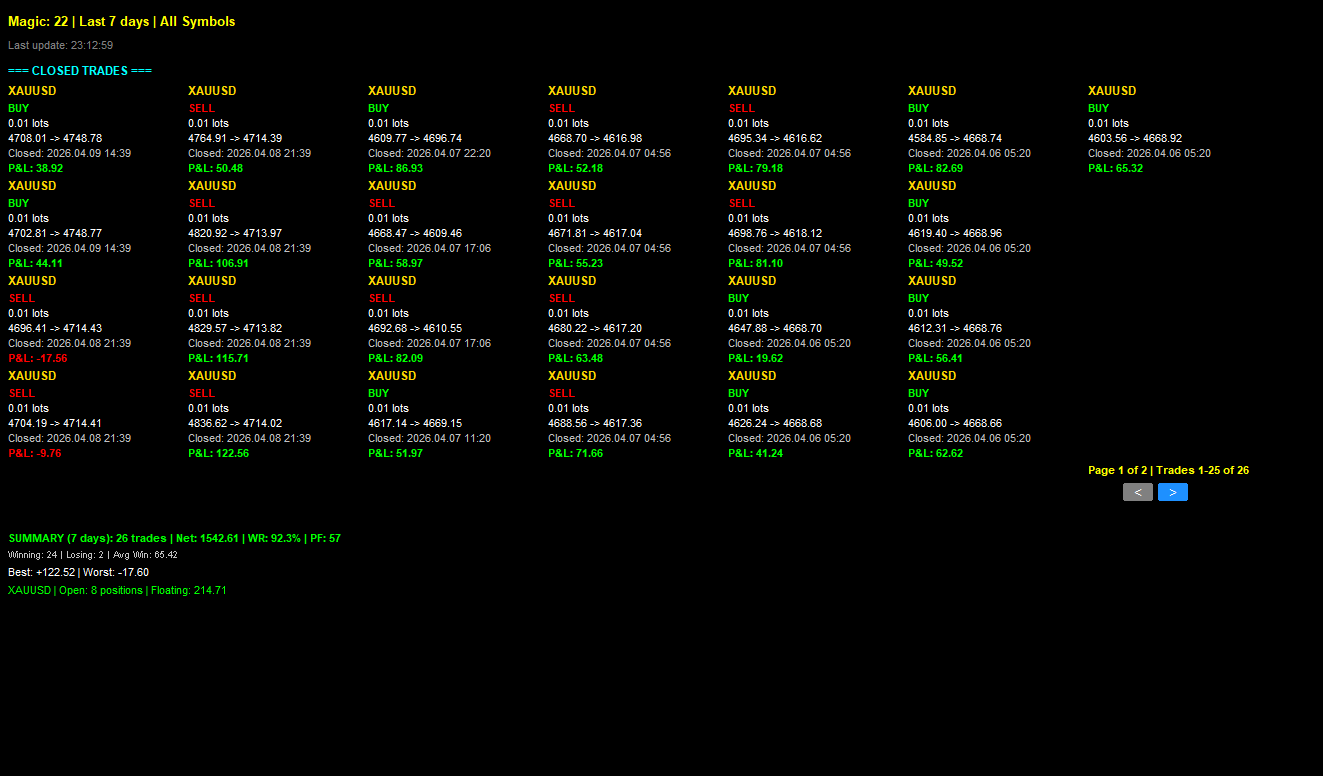
If your login is successful, you will see the dashboard just as shown below - the same full table of all 19 assets with all the colors, formatting, and real-time updates, exactly like the terminal display but in your browser.
Jason Smith
2026.04.03
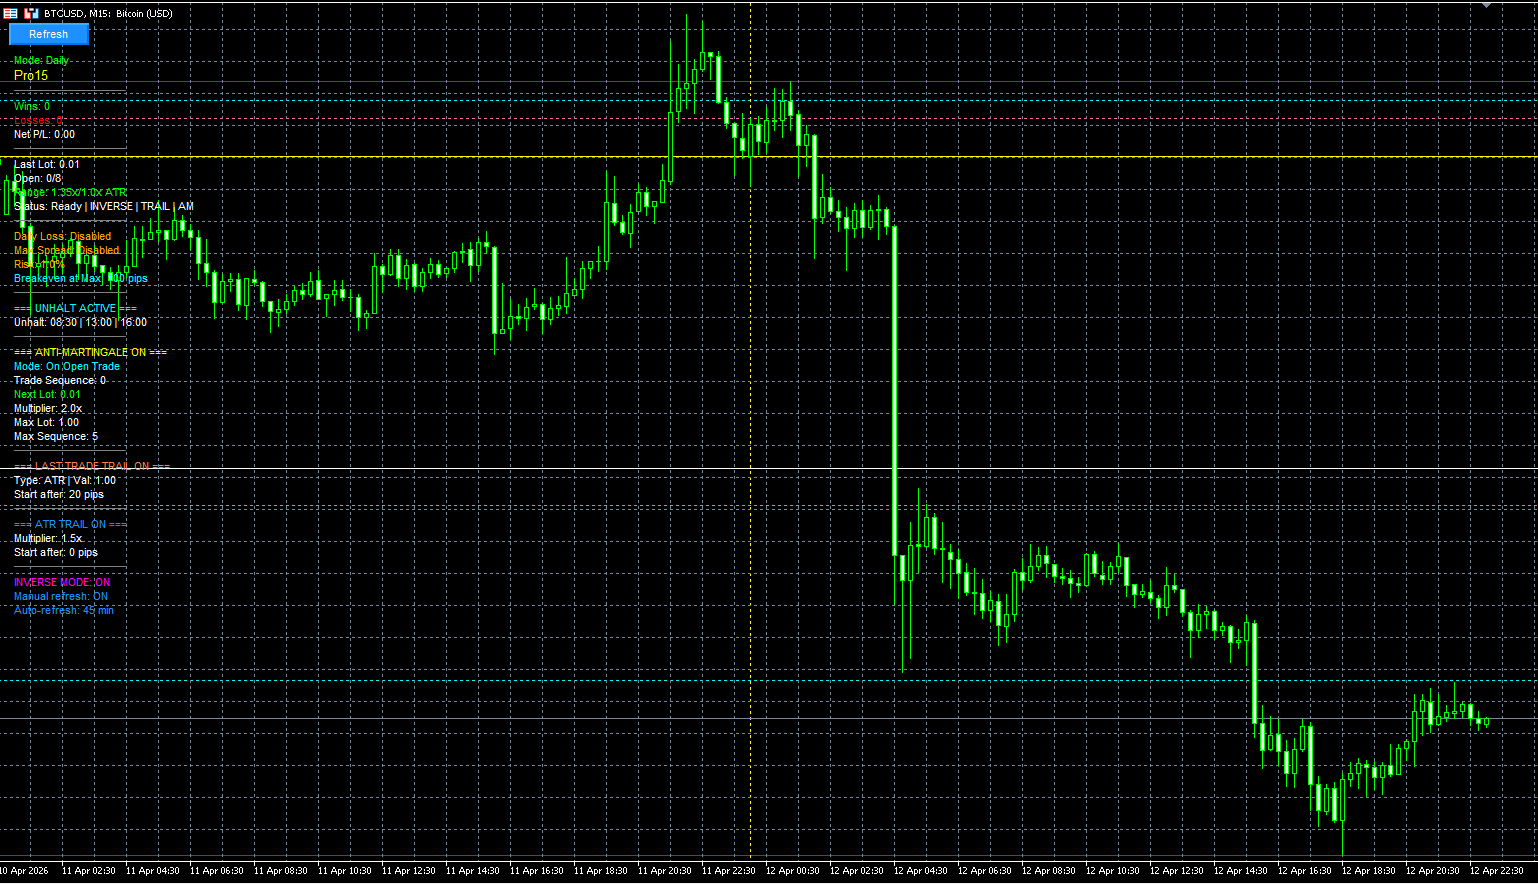
Traders can pick your own asset list and a bot that can trade from the endpoint remotely.
A trading bot connects remotely to your HMM endpoints and reads the signals in real-time - Action (BUY/SELL/HOLD), Risk level, Position multiplier, Signal quality. Remote access means you can run the bot on a server, VPS, or even a Raspberry Pi, and control it from anywhere via web interface or API.
A trading bot connects remotely to your HMM endpoints and reads the signals in real-time - Action (BUY/SELL/HOLD), Risk level, Position multiplier, Signal quality. Remote access means you can run the bot on a server, VPS, or even a Raspberry Pi, and control it from anywhere via web interface or API.