Jason Smith / Profile
- Information
|
1 year
experience
|
21
products
|
18
demo versions
|
|
2
jobs
|
0
signals
|
0
subscribers
|
The best algorithmic developers aren't just programmers - they're traders who code.
I develop and code custom trading strategies, automation tools and custom software across multiple platforms and languages, including TradingView (Pine Script), MetaTrader 5 (MQL5), Python and other modern development frameworks.
Looking for a quantitative developer role.
I can turn trading strategies into fully functional systems.
Extensive experience with Linux (Gentoo, Debian) and Unix systems (FreeBSD, OpenBSD)
I’m available for projects.
You can ask for me directly in the Freelance section.
How Observation Changes Outcomes :
In quantum mechanics, when light (or electrons) passes through two slits, it creates an interference pattern on the screen behind them.
Each particle seems to go through both slits at once, existing in a super position of all possible paths and the resulting pattern reflects the probabilities of where the particle could land.
If you try to measure which slit the particle goes through, the interference pattern disappears.
Observing the particle forces it into a definite state - it goes through one slit or the other.
The act of measurement collapses the wave function and fundamentally changes the outcome.
Before you check a trade, it’s in super position.
From a statistical perspective, your trade has a probability of winning or losing based on your system but you don’t yet know the outcome.
The trade is evolving naturally, just like a quantum system.
The moment you look at it, your observation collapses the “trade wave function” into a definite state - good or bad, winning or losing.
That observation triggers an emotional reaction — stress, fear, or overconfidence—which can cause you to break your plan, over-leverage, or revenge trade.
Just like in quantum mechanics, the act of measurement affects the system.
If you hadn’t looked, the system would have continued evolving naturally and you would have followed your plan without emotional interference.
This analogy mirrors the quantum concept perfectly - observation changes the outcome, not because the market changed, but because your interaction with it changed your behavior.
In other words, checking too often destroys the natural probabilistic outcome of your system, just like measuring the slit destroys the interference pattern.
The trade itself hasn’t changed; your observation changed how you interact with it, which changes the outcome.
Final Thoughts:
Traders, you know what I’m talking about — in a demo, you can leave your strategy untouched for days, weeks, even months.
The moment it goes live, you start checking too often, micromanaging your trades, and suddenly your observation is affecting the outcome
I develop and code custom trading strategies, automation tools and custom software across multiple platforms and languages, including TradingView (Pine Script), MetaTrader 5 (MQL5), Python and other modern development frameworks.
Looking for a quantitative developer role.
I can turn trading strategies into fully functional systems.
Extensive experience with Linux (Gentoo, Debian) and Unix systems (FreeBSD, OpenBSD)
I’m available for projects.
You can ask for me directly in the Freelance section.
How Observation Changes Outcomes :
In quantum mechanics, when light (or electrons) passes through two slits, it creates an interference pattern on the screen behind them.
Each particle seems to go through both slits at once, existing in a super position of all possible paths and the resulting pattern reflects the probabilities of where the particle could land.
If you try to measure which slit the particle goes through, the interference pattern disappears.
Observing the particle forces it into a definite state - it goes through one slit or the other.
The act of measurement collapses the wave function and fundamentally changes the outcome.
Before you check a trade, it’s in super position.
From a statistical perspective, your trade has a probability of winning or losing based on your system but you don’t yet know the outcome.
The trade is evolving naturally, just like a quantum system.
The moment you look at it, your observation collapses the “trade wave function” into a definite state - good or bad, winning or losing.
That observation triggers an emotional reaction — stress, fear, or overconfidence—which can cause you to break your plan, over-leverage, or revenge trade.
Just like in quantum mechanics, the act of measurement affects the system.
If you hadn’t looked, the system would have continued evolving naturally and you would have followed your plan without emotional interference.
This analogy mirrors the quantum concept perfectly - observation changes the outcome, not because the market changed, but because your interaction with it changed your behavior.
In other words, checking too often destroys the natural probabilistic outcome of your system, just like measuring the slit destroys the interference pattern.
The trade itself hasn’t changed; your observation changed how you interact with it, which changes the outcome.
Final Thoughts:
Traders, you know what I’m talking about — in a demo, you can leave your strategy untouched for days, weeks, even months.
The moment it goes live, you start checking too often, micromanaging your trades, and suddenly your observation is affecting the outcome
Friends
201
Requests
Outgoing
Jason Smith
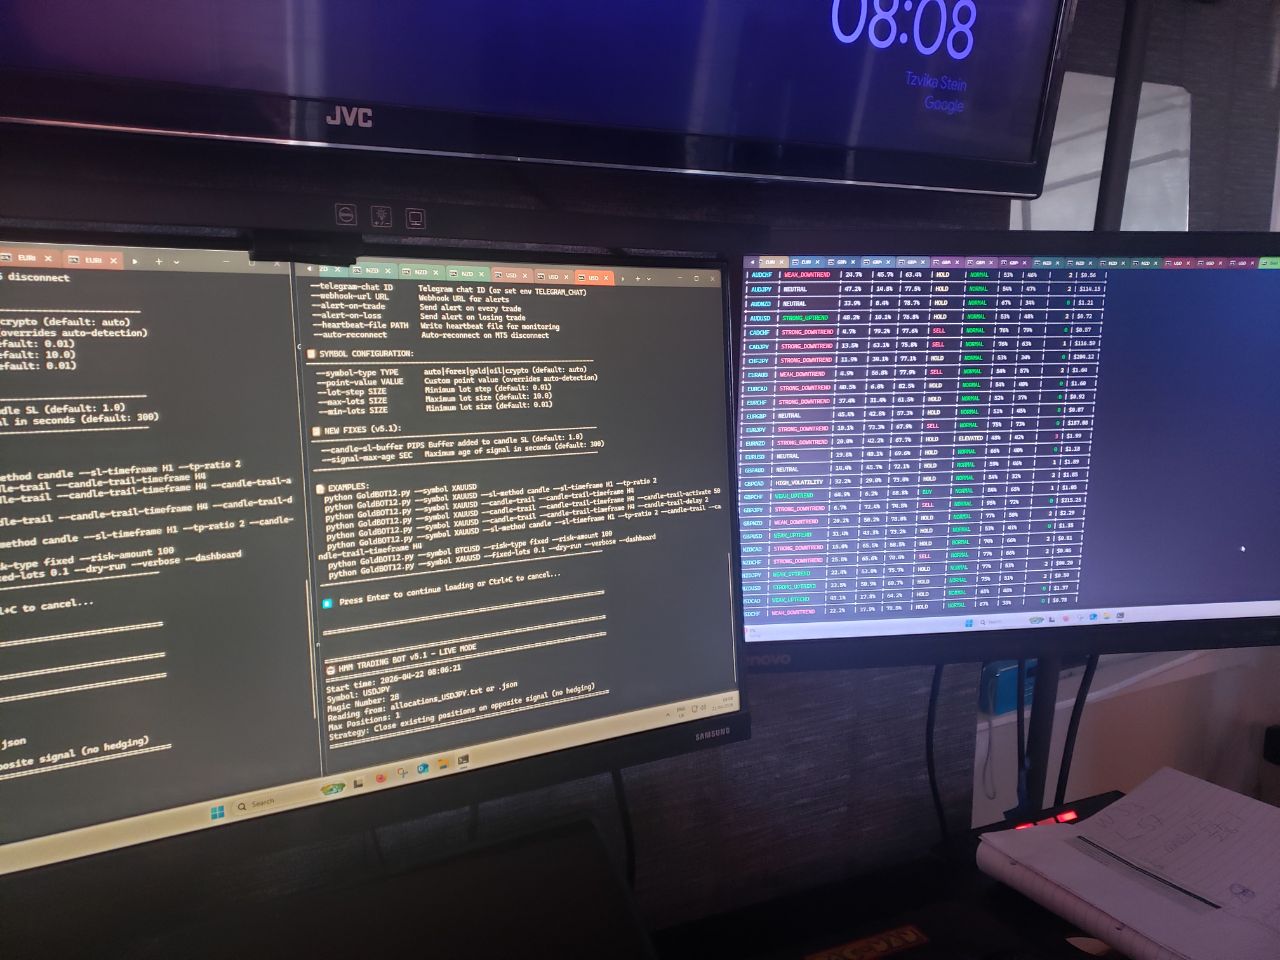
The system handles multiple assets by running a separate Hidden Markov Model instance for each individual symbol.
You have full control to build your own custom watchlist, giving you the flexibility to track any combination of assets that matter to you.
Whether you want to monitor major indices like the S&P 500 and FTSE, energy commodities such as WTI and Brent crude, or precious metals including gold and silver, the system lets you add or remove symbols effortlessly.
You have full control to build your own custom watchlist, giving you the flexibility to track any combination of assets that matter to you.
Whether you want to monitor major indices like the S&P 500 and FTSE, energy commodities such as WTI and Brent crude, or precious metals including gold and silver, the system lets you add or remove symbols effortlessly.
Jason Smith
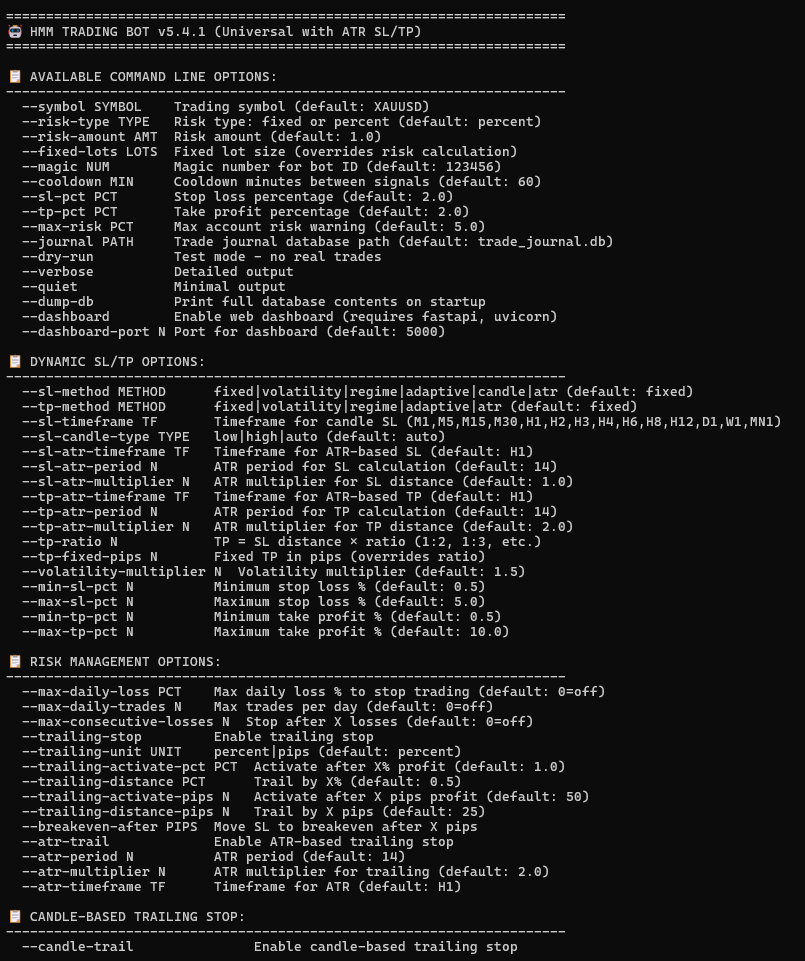
Markov Bot default setting -
Markov.py --symbol AUDCAD --fixed-lots 0.2 --journal audcad.db --magic 1 --auto-reconnect --mt5-timeout 60 --mt5-retries 5 --mt5-path \"C:\Program Files\MetaTrader 8 IC Markets Global\terminal64.exe\" --max-positions 1 --quiet --signal-max-age 7000 --zero-on-hold
Full Trading System Available for Purchase -
The suite includes:
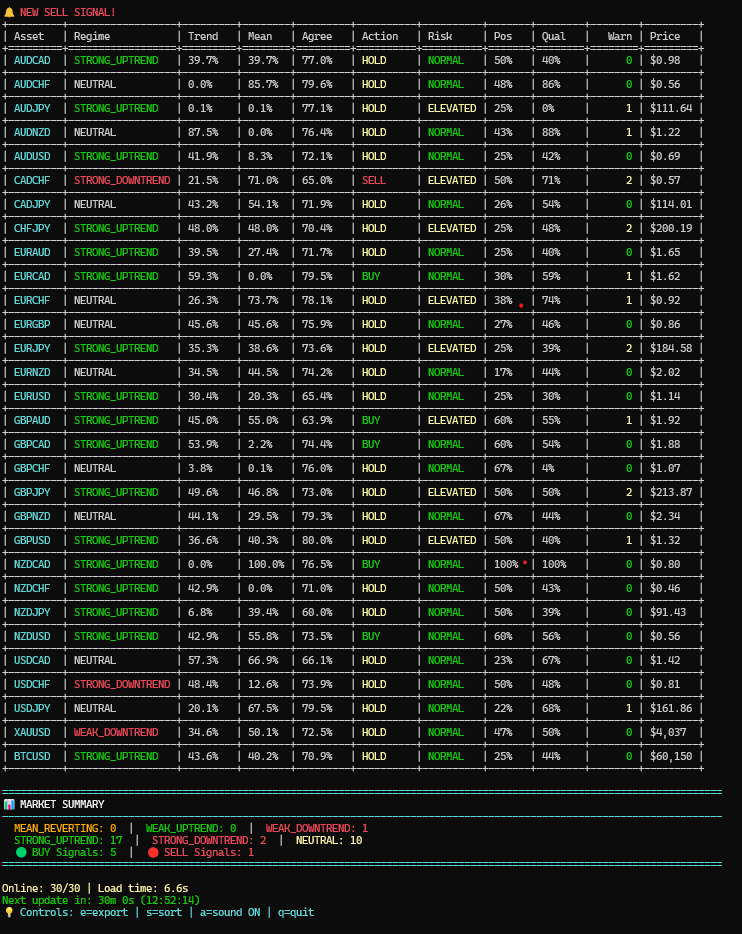
A Hidden Markov Model-based allocator that detects market regimes and manages portfolio allocation.
An interactive dashboard for monitoring system performance and signals.
A Python trading bot that executes trades based on HMM outputs.
An MT5 bot — currently undergoing a rewrite to improve compatibility and performance with the HMM
Markov.py --symbol AUDCAD --fixed-lots 0.2 --journal audcad.db --magic 1 --auto-reconnect --mt5-timeout 60 --mt5-retries 5 --mt5-path \"C:\Program Files\MetaTrader 8 IC Markets Global\terminal64.exe\" --max-positions 1 --quiet --signal-max-age 7000 --zero-on-hold
Full Trading System Available for Purchase -
The suite includes:
A Hidden Markov Model-based allocator that detects market regimes and manages portfolio allocation.
An interactive dashboard for monitoring system performance and signals.
A Python trading bot that executes trades based on HMM outputs.
An MT5 bot — currently undergoing a rewrite to improve compatibility and performance with the HMM
Jason Smith
Dear Jason Smith
I am a virtual MQL5.com assistant.
Please select your question category
You
Account
MQL5 Helper
What would you like to do?
You
Delete account
MQL5 Helper
Do you really want to delete eddymorrow account from MQL5.com?
This cannot be undone.
You
Delete
MQL5 Helper
MQL5 team has received your request. Your account will be deleted within 3 working days.
Do you have any other questions?
You
No
MQL5 Helper
I hope I have been helpful.
See you!
I am a virtual MQL5.com assistant.
Please select your question category
You
Account
MQL5 Helper
What would you like to do?
You
Delete account
MQL5 Helper
Do you really want to delete eddymorrow account from MQL5.com?
This cannot be undone.
You
Delete
MQL5 Helper
MQL5 team has received your request. Your account will be deleted within 3 working days.
Do you have any other questions?
You
No
MQL5 Helper
I hope I have been helpful.
See you!
Jason Smith
Thought of the day : Manipulation
Bitcoin already bullish, two large H4 candles.
The third H4 candle was also bullish but initially only around half the size of the previous candles.
Then news was released that Strategy (formerly MicroStrategy) had purchased another substantial amount of Bitcoin, worth hundreds of millions of dollars.
Following that announcement, the third H4 candle expanded significantly and appeared much stronger.
However, what happened next was interesting.
Over the following x21 H1 candles, 17 closed bearish despite the bullish news and strong H4 structure.
This suggests the news may have been used as a liquidity event rather than a genuine catalyst for immediate upside.
The announcement attracted buyers, providing liquidity for larger market participants.
Instead of continuing higher, the market sold off across multiple hourly candles.
To me, this looked like a setup designed to draw in late buyers.
Bitcoin already bullish, two large H4 candles.
The third H4 candle was also bullish but initially only around half the size of the previous candles.
Then news was released that Strategy (formerly MicroStrategy) had purchased another substantial amount of Bitcoin, worth hundreds of millions of dollars.
Following that announcement, the third H4 candle expanded significantly and appeared much stronger.
However, what happened next was interesting.
Over the following x21 H1 candles, 17 closed bearish despite the bullish news and strong H4 structure.
This suggests the news may have been used as a liquidity event rather than a genuine catalyst for immediate upside.
The announcement attracted buyers, providing liquidity for larger market participants.
Instead of continuing higher, the market sold off across multiple hourly candles.
To me, this looked like a setup designed to draw in late buyers.
Amr Abdelhay Yousef Kamel
2026.06.24
man it is more simple.. despite the technical analysis , the bitcoin is going to visit 30k back before any major bull run again
Jason Smith
2026.06.24
$30,000? I don't see that happening. Bitcoin is now a multi-trillion-dollar asset, and it recently reached highs around $126,000. A drop to $30,000 would mean losing more than 75% of its value from the peak, which is a very different environment from previous cycles.
What do you base that on
Amr Abdelhay Yousef Kamel
2026.06.24
it is based on previous cycles :). bitcoin always loss more than 70% before bull run again. just stay away from it brother. dont fight big guys, wait for the next bull run in 1 and half year or 2 years from now.
Jason Smith
An Allocator using a Hidden Markov Model (HMM) is a smart system that dynamically shifts your investments between different assets.
It detects unobservable "market regimes" (like high-volatility vs. calm growth) by looking at observable data like prices and volume.
It then adjusts your portfolio risk automatically.
It detects unobservable "market regimes" (like high-volatility vs. calm growth) by looking at observable data like prices and volume.
It then adjusts your portfolio risk automatically.
Jason Smith
Looking to partner with entrepreneur(s). Multi-Model HMM Trading System with Canary Risk Control and Shadow Validation.
I have a fully functional HMM. Hidden Markov Model
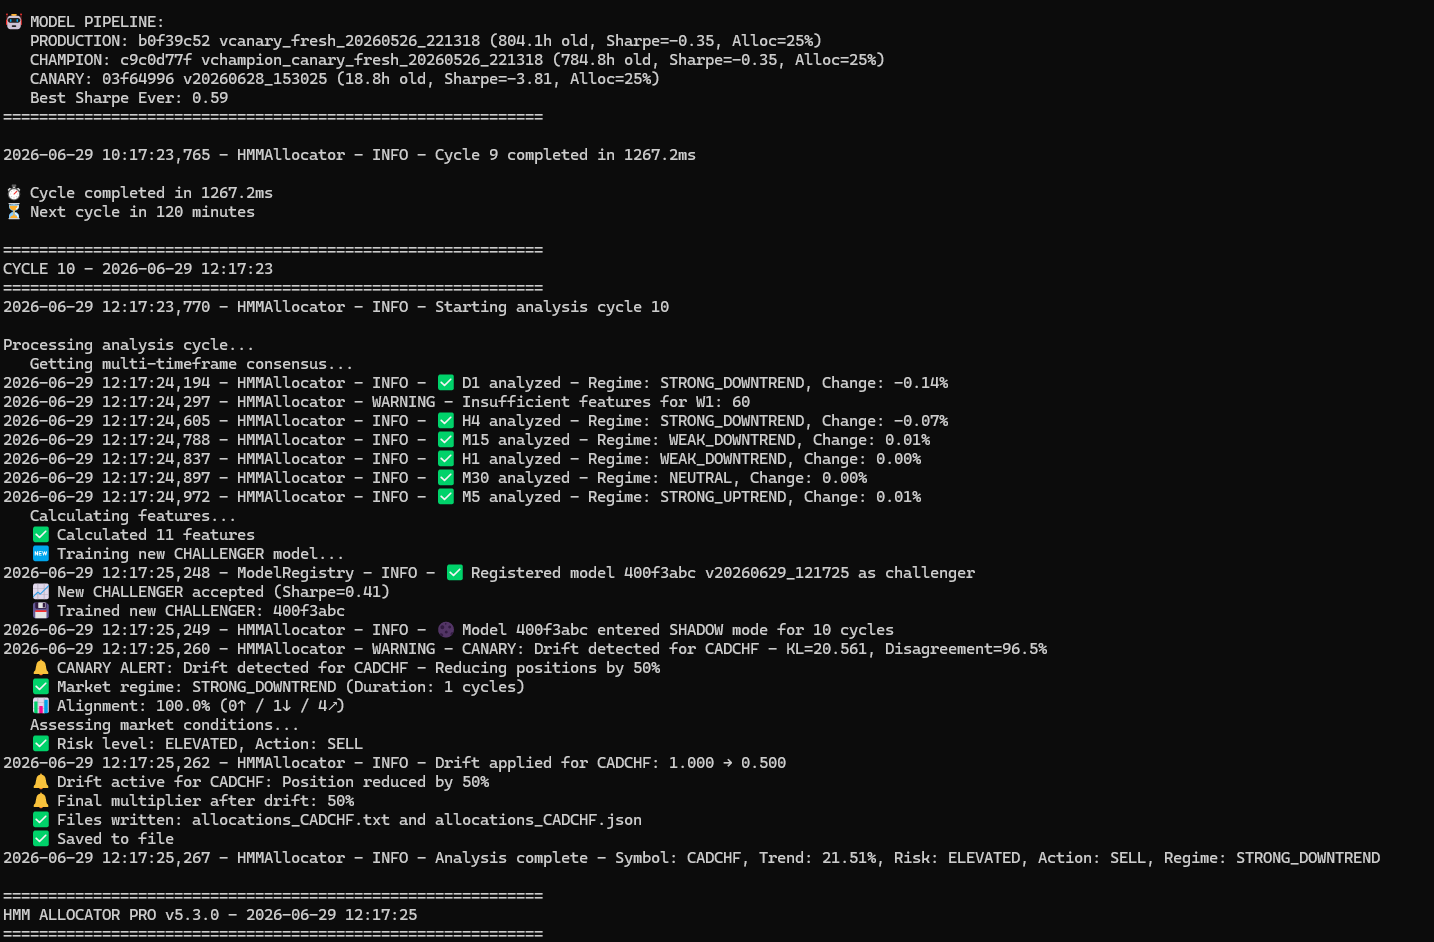
The Production model is the main, fully trusted model used for live trading decisions and position sizing.
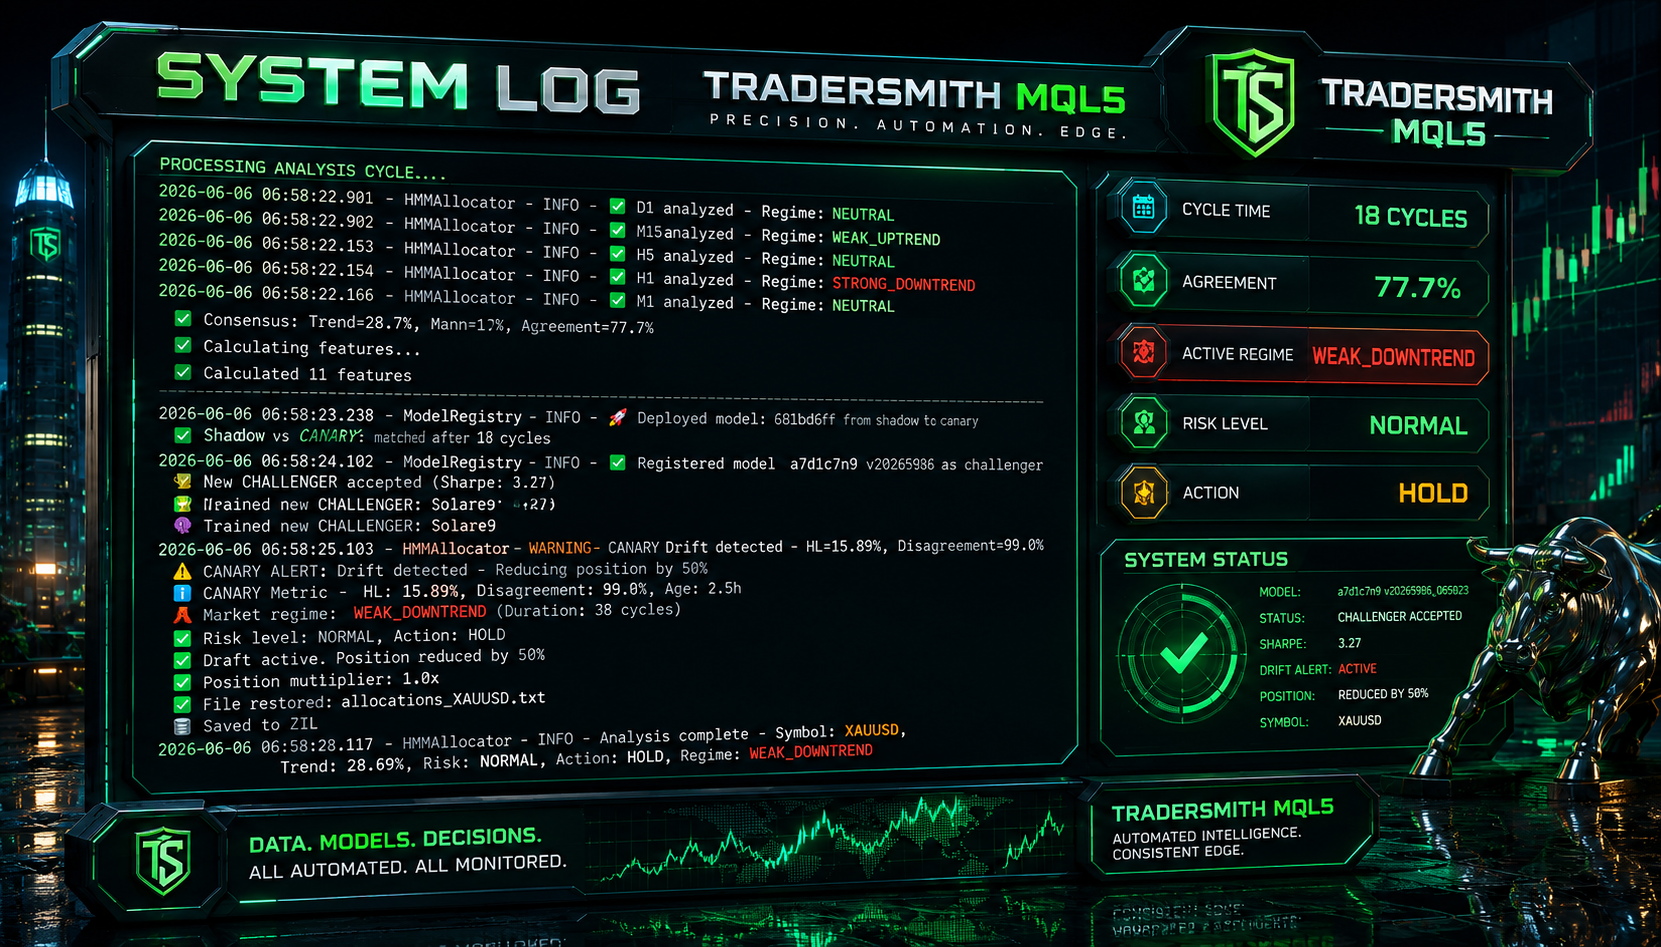
The Canary model acts as an early warning system; it's a newer model deployed alongside Production to detect market "drift" (statistical changes) by comparing its predictions to real market behavior, and if it detects a significant mismatch, it triggers a risk reduction (e.g., cutting position sizes by 50%) to protect the system.
The Shadow model is a candidate waiting in the wings; it runs completely in the background without affecting trades, collecting performance data (like rolling Sharpe ratio) for a validation period (e.g., 10 cycles).
Only after the Shadow proves it consistently outperforms the current Production model does it get promoted to Canary, and eventually to Production, ensuring the system always uses the most robust available model while continuously testing new ones.
I have a fully functional HMM. Hidden Markov Model
The Production model is the main, fully trusted model used for live trading decisions and position sizing.
The Canary model acts as an early warning system; it's a newer model deployed alongside Production to detect market "drift" (statistical changes) by comparing its predictions to real market behavior, and if it detects a significant mismatch, it triggers a risk reduction (e.g., cutting position sizes by 50%) to protect the system.
The Shadow model is a candidate waiting in the wings; it runs completely in the background without affecting trades, collecting performance data (like rolling Sharpe ratio) for a validation period (e.g., 10 cycles).
Only after the Shadow proves it consistently outperforms the current Production model does it get promoted to Canary, and eventually to Production, ensuring the system always uses the most robust available model while continuously testing new ones.
Jason Smith
For months on my profile, I have been highlighting the importance of the potential double-bottom formation on the Bitcoin daily chart.
The pattern has finally played out, likely driven by a combination of profit-taking, institutional repositioning, and selling pressure from larger market participants.
While many traders viewed the decline with concern, I saw it as a significant accumulation opportunity.
Periods of forced selling and heightened fear often create some of the best risk-reward entries for long-term investors.
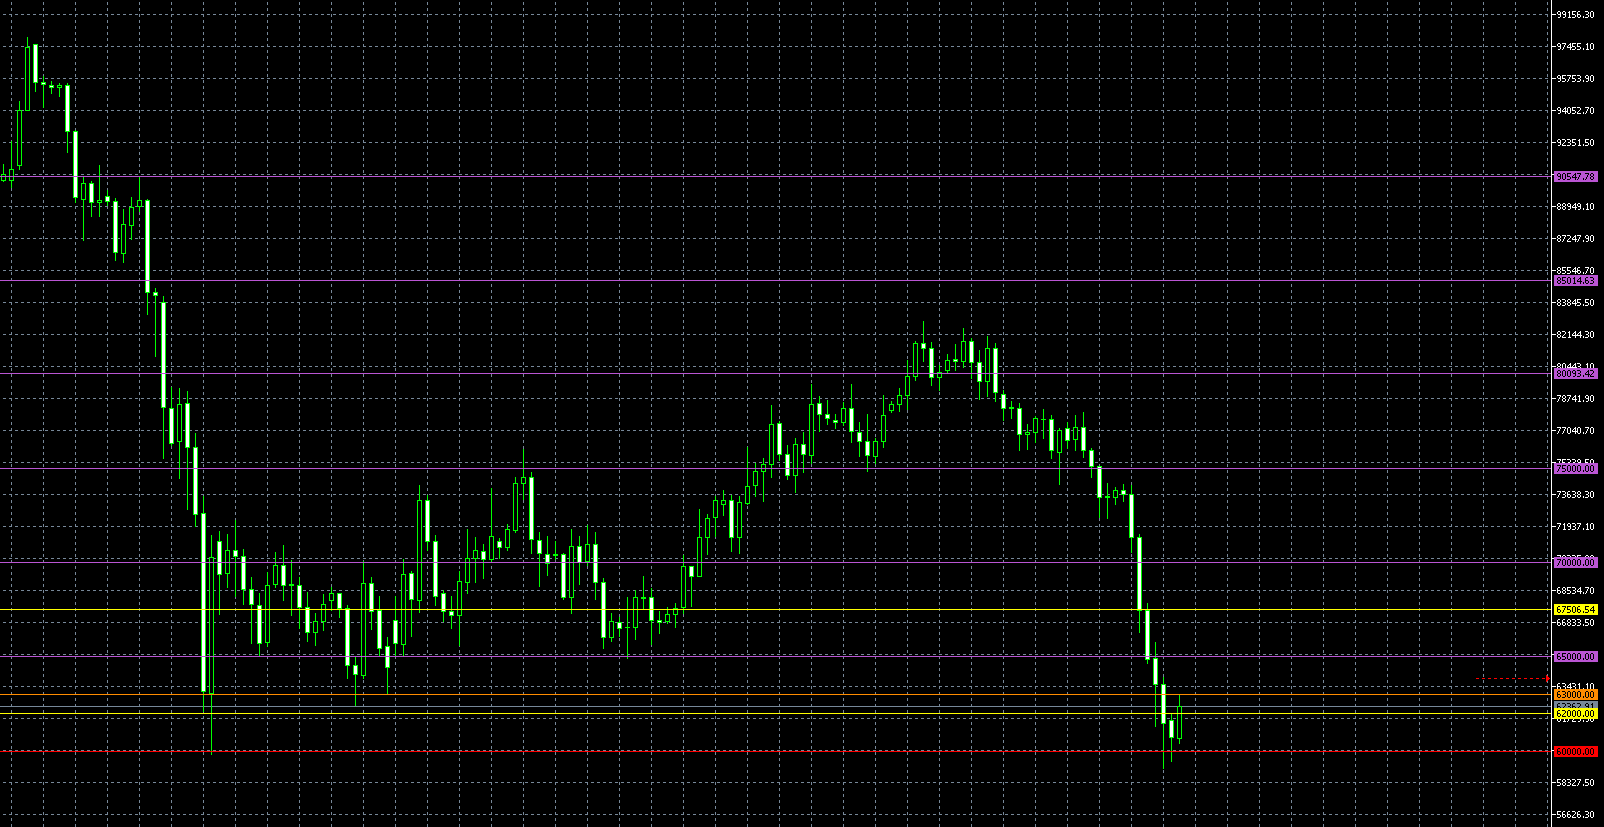
I used the pullback to increase my Bitcoin holdings at price approximately $61,500.
Whether the exact bottom is in place remains to be seen, but from a risk-versus-reward perspective, the area represented a compelling opportunity to acquire coins at a substantial discount to previous highs.
The key question now is whether this move marks a temporary correction within a broader bull market or the beginning of a more extended period of consolidation.
Either way, major selloffs have historically been where the strongest long-term positions are built.
The pattern has finally played out, likely driven by a combination of profit-taking, institutional repositioning, and selling pressure from larger market participants.
While many traders viewed the decline with concern, I saw it as a significant accumulation opportunity.
Periods of forced selling and heightened fear often create some of the best risk-reward entries for long-term investors.
I used the pullback to increase my Bitcoin holdings at price approximately $61,500.
Whether the exact bottom is in place remains to be seen, but from a risk-versus-reward perspective, the area represented a compelling opportunity to acquire coins at a substantial discount to previous highs.
The key question now is whether this move marks a temporary correction within a broader bull market or the beginning of a more extended period of consolidation.
Either way, major selloffs have historically been where the strongest long-term positions are built.
Jason Smith
2026.06.07
MicroStrategy (now called Strategy), they have accumulated one of the largest Bitcoin positions in the world.
As of early June 2026, Strategy holds approximately 843,706 BTC after a small sale of 32 BTC. Their total acquisition cost is about $63.9 billion, with an average purchase price around $75,700 per Bitcoin. I waited nearly six months for this low.
Now we’re positioned in Bitcoin at institutional-level pricing or better. $61.500
Discipline matters here—entries like this are built, not chased.
As of early June 2026, Strategy holds approximately 843,706 BTC after a small sale of 32 BTC. Their total acquisition cost is about $63.9 billion, with an average purchase price around $75,700 per Bitcoin. I waited nearly six months for this low.
Now we’re positioned in Bitcoin at institutional-level pricing or better. $61.500
Discipline matters here—entries like this are built, not chased.
Jason Smith
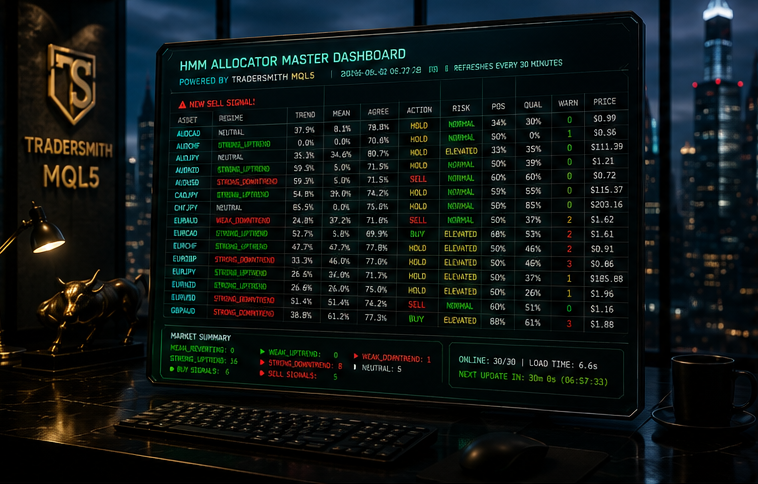
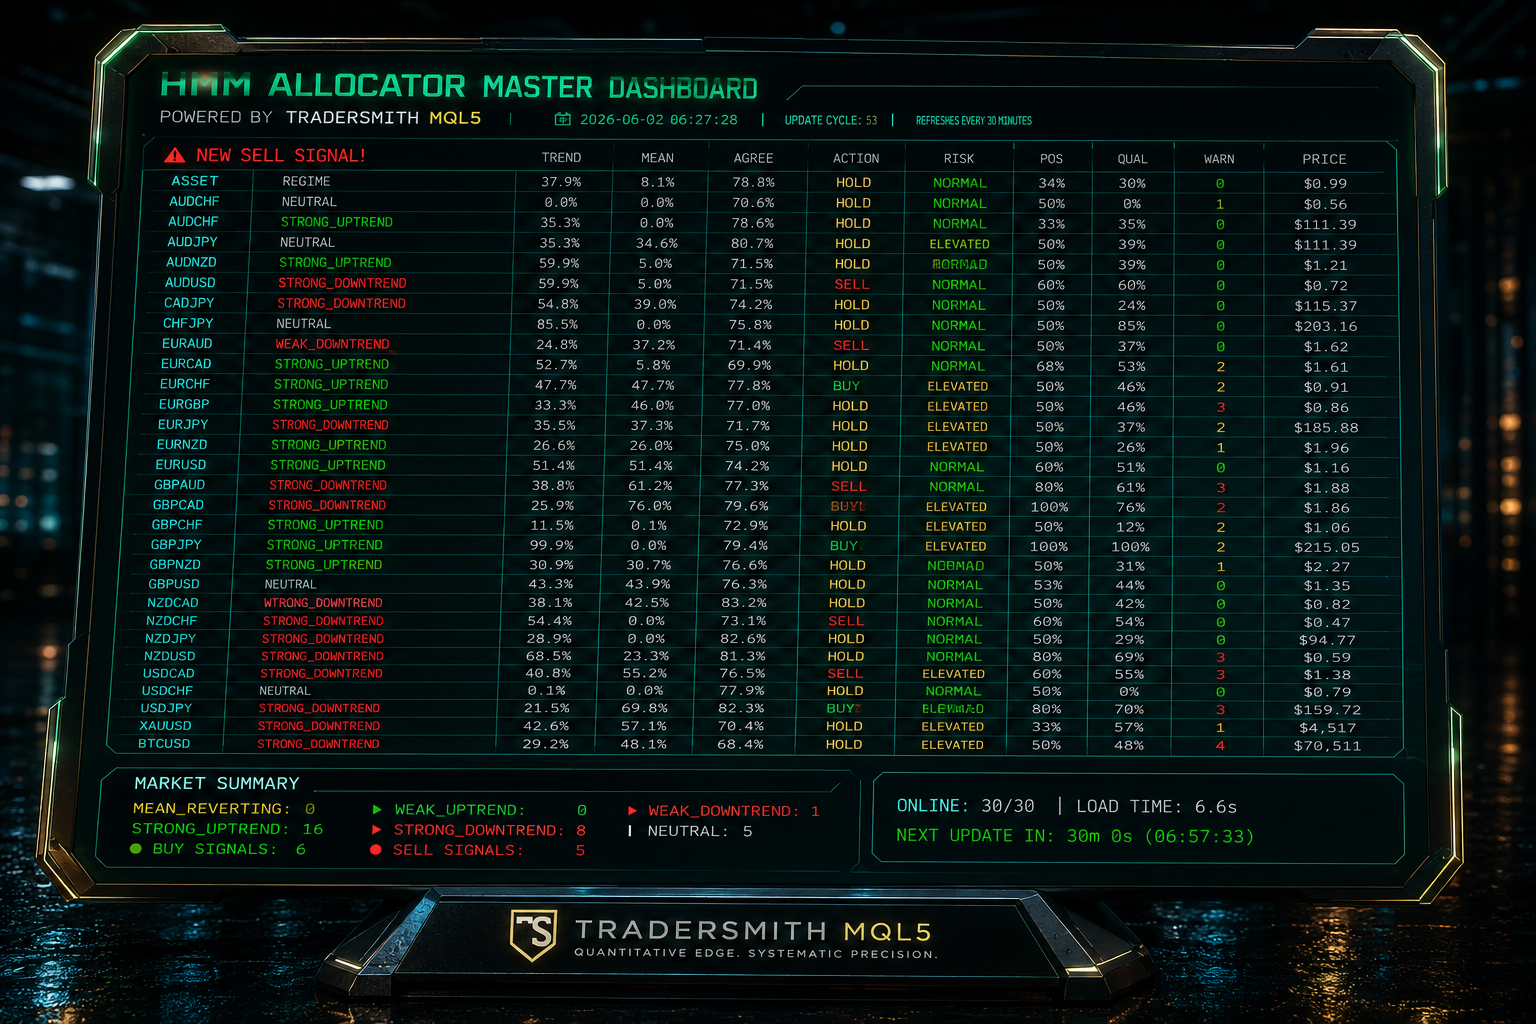
Hidden Markov Model Engine with Markov State Matrix Dashboard
The dashboard can be securely accessed from any web browser through encrypted endpoints when Ngrok tunneling is enabled, providing real-time remote monitoring from virtually anywhere in the world.
This feature would allow a subscription based sign ups.
The dashboard can display indices, stocks, oil metals, etc.
The HMM comes in 3 parts.
The Allocator - HMM (Hidden Markov Model)
The Markov Python Bot.
Master Dashboard.
The dashboard can be securely accessed from any web browser through encrypted endpoints when Ngrok tunneling is enabled, providing real-time remote monitoring from virtually anywhere in the world.
This feature would allow a subscription based sign ups.
The dashboard can display indices, stocks, oil metals, etc.
The HMM comes in 3 parts.
The Allocator - HMM (Hidden Markov Model)
The Markov Python Bot.
Master Dashboard.
Jason Smith
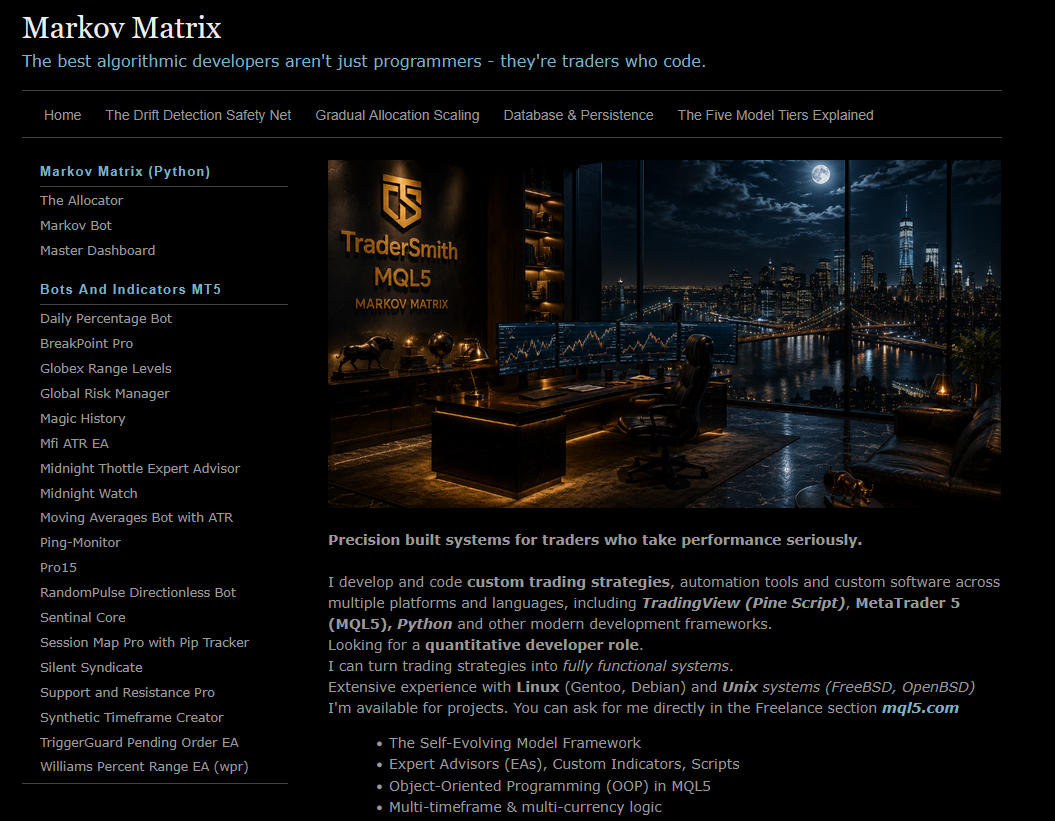
New website is currently under development and will be live soon.
In the meantime, here's a sneak preview.
All bots and indicators featured on the site will link directly to MQL5.com.
In the meantime, here's a sneak preview.
All bots and indicators featured on the site will link directly to MQL5.com.
Jason Smith
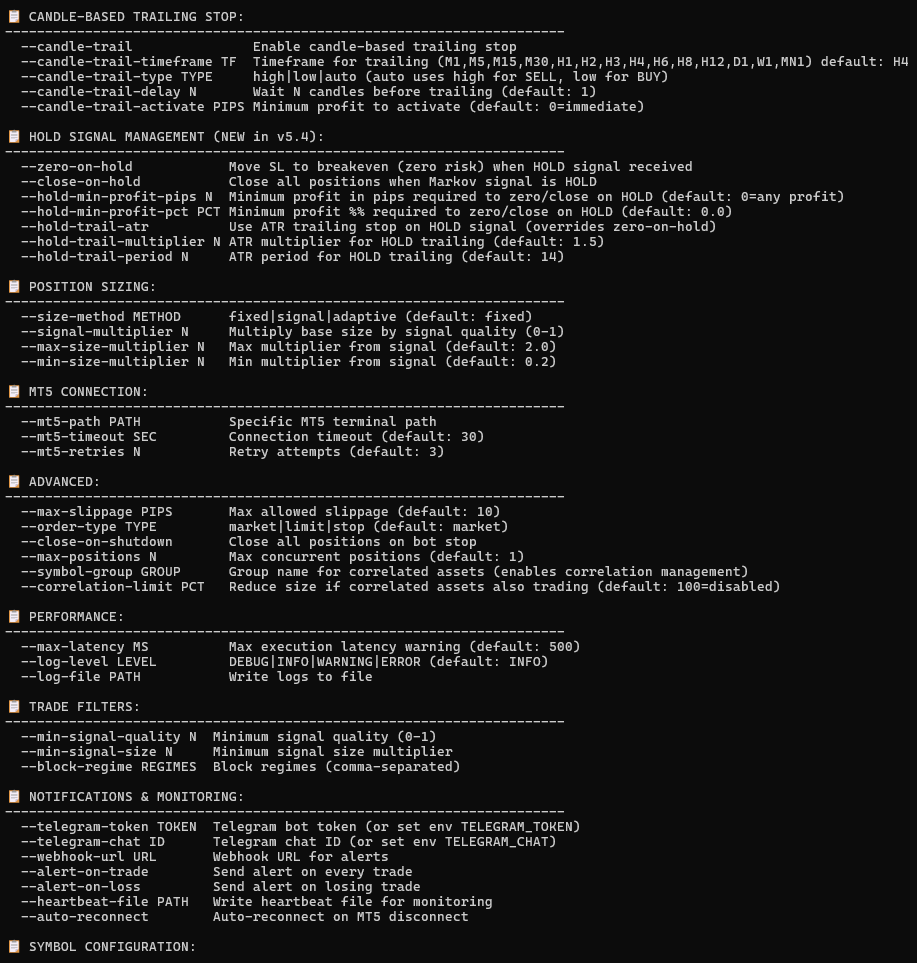
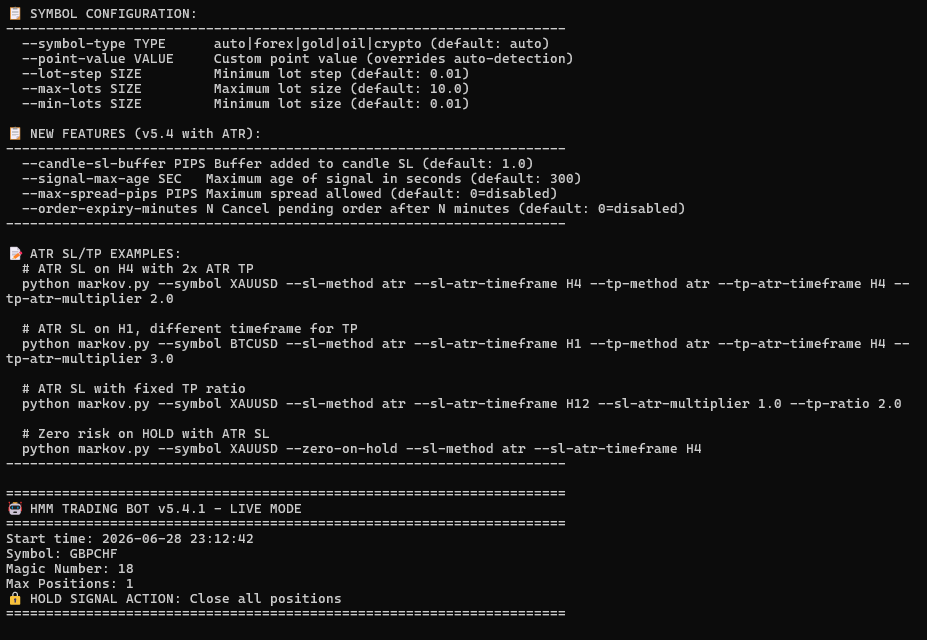
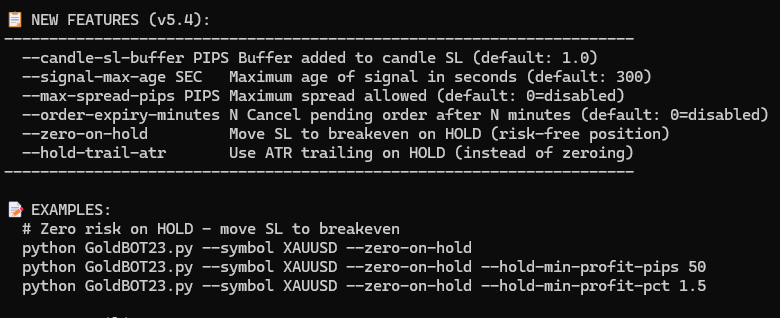
New features added to the HMM python bot -
When the hmm has sell or a buy it can switch to hold: No trade.
These new features let's he bot close on hold. Trail ATR on hold or Zero out on hold
When the hmm has sell or a buy it can switch to hold: No trade.
These new features let's he bot close on hold. Trail ATR on hold or Zero out on hold
: