Watch the Market tutorial videos on YouTube
How to buy а trading robot or an indicator
Run your EA on
virtual hosting
virtual hosting
Test аn indicator/trading robot before buying
Want to earn in the Market?
How to present a product for a sell-through
Expert Advisors and Indicators for MetaTrader 4 - 94

Zeus Hedge AI is an advanced trading system powered by Machine Learning and Deep Learning technologies , developed through extensive live optimization and professional algorithmic modeling.
While deeply optimized for Gold (XAUUSD) , it is also fully compatible with EURUSD and EURGBP , maintaining high stability and low risk across various market conditions and timeframes. The EA utilizes AI-driven Deep Learning models to analyze price behavior, volatility patterns, trend intensity, and volume dy
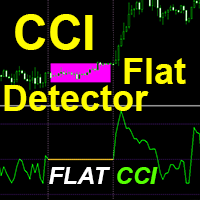
Crypto_Forex Indicator "CCI FLAT Detector" - is an efficient auxiliary tool in trading! No Repaint. I offer you to upgrade your trading methods with this great indicator for MT4.
- Indicator shows price Flat areas on the chart. It has "Flat sensitivity" parameter - which is responsible for flat detection. - "CCI FLAT Detector" can be used for Price Action entries confirmation or in combination with other indicators. - You can use it for trend following systems to detect flat zones and avoid tr

Goldman Balanced PRO, is an Indicator that has merges EMA trend structure, Stochastic Oscillation, RSI Momentum and ATR volatility zones into a single visual indicator. This produces clean zones and show possible areas of bulls and bears supported by confidence meter and retracement filters. this will give an overview of how the market is currently structured.
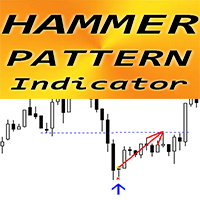
Crypto_Forex Indicator "Hammer pattern" for MT4, No repaint, No delay.
- Indicator "Hammer pattern" is very powerful indicator for Price Action trading. - Indicator detects bullish Hammer patterns on chart: Blue arrow signal on chart (see pictures). - With PC, Mobile & Email alerts. - Indicator "Hammer pattern" is excellent to combine with Support/Resistance Levels.
// Great Trading Robots and Indicators are available here: https://www.mql5.com/en/users/def1380/seller This is original prod

Trade Gold Smarter with Trend-Sensing Pro EA! Are you ready to elevate your Gold trading strategy ? The Trend-Sensing Pro EA is a sophisticated, non-Martingale, non-Grid Expert Advisor designed to systematically capture market trends on the volatile XAUUSD (Gold) market. This EA is not just another automated tool—it's your personalized assistant, using advanced logic based on customized Heiken Ashi and Moving Averages to identify high-probability entry points. Forget guesswork and emotional dec

Track your daily profit and loss in real time. Displays current account performance, peak gain, and drawdown directly on the chart. Simple, lightweight, and compatible with all symbols. Daily Trade Monitor — Real-Time Daily P&L Tracker for MetaTrader 4 Monitor your trading performance with precision. Daily Trade Monitor is a lightweight, visual indicator that displays your current account profit or loss and captures the maximum profit and loss of the day, indicating the exact time and minute eac

Exotic Bot is a multi -cream multifunctional adviser working on any time frame and in any market conditions. The robot’s work is taken as a system of averaging with the non -geometric progression of the construction of a trading grid. Built -in protection systems: special filters, spreading, internal restriction of trading time. Building a trading grid, taking into account important internal levels. The ability to configure trading aggressiveness. Work postponed orders with trailing orders. T
Looking for a trading tool based on the RSI indicator that can display crossovers arrows on all time frames? Introducing trading indicator : All Time Frame Double RSI Model S ready to help you achieve daily profits. This tool is created using the intersection of two RSI (Double RSI) indicator lines: the main RSI and the signal RSI. Using this tool makes it easier to observe the real-time dashboard and intersections of multiple timeframes simultaneously. Viewing both higher and lower timeframes
Looking for a trading tool based on the RSI indicator that can display crossovers arrows on all time frames? Introducing trading indicator : All Time Frame Double RSI Model T ready to help you achieve daily profits. This tool is created using the intersection of two RSI (Double RSI) indicator lines: the main RSI and the signal RSI. Using this tool makes it easier to observe the real-time dashboard and intersections of multiple timeframes simultaneously. Viewing both higher and lower timeframes

Trinitron Bot : A Multifunctional and Multi-Currency Trading Advisor
Trinitron Bot is a sophisticated and versatile trading advisor designed to operate seamlessly across various timeframes and market conditions.
Key Features: Averaging System with Non-Geometric Progression: Trinitron Bot utilizes an advanced averaging system that constructs a trading grid based on non-geometric progression, enhancing its adaptability and efficiency. Built-in Protection Systems: The advisor includes specialize

Ultima Trader is a multi-currency advisor that can effectively operate on different time frames and in a variety of market scenarios thanks to its advanced non-geometric progression averaging system. This feature allows him to build trading grids and determine the moments of entry into the market with high accuracy.
Main characteristics of Ultima Trader: Security systems: The advisor is equipped with special filters, spread control and trading time limits to ensure safety and reliability. Ac

RiskShield Dragon — Automated Multi-Currency Advisor
Combining intelligent algorithms, robust protection mechanisms, and flexible configuration, **RiskShield Dragon** delivers consistent profits with minimal risk.
---
## Key Advantages
* **Multi-Currency & Multi-Threaded**: Supports over 20 currency pairs (EURUSD, GBPUSD, USDJPY, AUDUSD, NZDJPY, and more) simultaneously on any timeframe. * **Minimum Deposit from 10,000**: Optimized for trading with a starting balance of 10,000 account uni

Entry Price Averages EA with Close Orders
-------------------------------------------------------------- -------------------------------------------------------------- -------------------------------------------------------------- Note for users - Choose the right tool for you: If you require only a visual average price display, please use our Entry Price Averages MT4 (if you already have an expert on your chart) . If you need interactive controls and the ability to manage/close orders di

Correct Approach is a multi-currency multi-functional Expert Advisor that works on any time frame and in any market conditions. The robot is based on an averaging system with a non-geometric progression of building a trading grid. Built-in protection systems: special filters, spread control, internal trading time limit. Building a trading grid taking into account important internal levels. Possibility to adjust trading aggressiveness.
The Expert Advisor comes with proven templates for variou
Unleash Your Trading Potential with UNSTOPPABLE SIGNAL EA! Are you ready to transform your Gold Trading experience? The Unstoppable Signals EA is a robust, automated trading solution designed to give you a definitive edge in the volatile XAUUSD market! Forget the stress of constant monitoring and emotional decision-making. This Expert Advisor (EA) leverages a powerful, multi-indicator strategy combining Bollinger Bands (BB) , Awesome Oscillator (AO) , and Moving Average Convergence Divergence

Looking for a trading tool based on the Stochastic indicator that can display crossovers arrows on all time frames? Introducing trading indicator : All Time Frame Stochastic Model S ready to help you achieve daily profits. This tool is created using the intersection of two indicator lines of Stochastic : the main Stochastic and the signal Stochastic . Using this tool makes it easier to observe the real-time dashboard and intersections of multiple timeframes simultaneously. Viewing both higher

Looking for a trading tool based on the Stochastic indicator that can display crossovers arrows on all time frames? Introducing trading indicator : All Time Frame Stochastic Model T ready to help you achieve daily profits. This tool is created using the intersection of two indicator lines of Stochastic : the main Stochastic and the signal Stochastic . Using this tool makes it easier to observe the real-time dashboard and intersections of multiple timeframes simultaneously. Viewing both higher

Tổng quan ------------ Bollinger MultiTF SingleTrade V3 là EA giao dịch thông minh, được thiết kế cho XAUUSD và các cặp tiền chính, sử dụng chiến lược Bollinger Bands đa khung thời gian để nhận diện xu hướng và điểm vào lệnh tối ưu.
EA hoạt động theo nguyên tắc “1 lệnh – 1 xu hướng”, đảm bảo tính an toàn, tránh overtrade và kiểm soát rủi ro chặt chẽ.
️ Chiến lược chính ------------------- - Kết hợp phân tích 4 khung thời gian (MN1, W1, D1, H1). - Khi tất cả khung nến cùng hướng (đều tăng
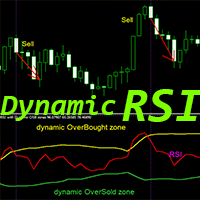
Crypto_Forex Indicator "RSI with Dynamic OverSold/OverBought zones" for MT4, No Repaint.
- RSI is one of the most popular oscillators for trading - very good for Scalping. - It is great to take Sell trades from dynamic OverBought zone and Buy trades from dynamic OverSold zone. - RSI oscillator also is very useful for divergence detection. - This indicator is excellent to combine with Price Action trades from OverSold/OverBought areas as well. - Dynamic OverBought zone - above yellow line. - Dy
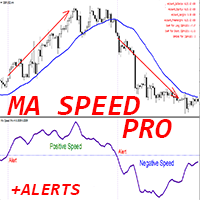
Crypto_Forex Indicator "MA Speed Pro" for MT4, No Repaint.
- SPEED of Moving Average - is unique trend indicator. - The calculation of this indicator is based on equations from physics. - Speed is the 1st derivative of Moving average. - MA Speed Pro indicator shows how fast MA itself changes its direction. - There are plenty of opportunities to upgrade even standard strategies with MA Speed Pro. Suitable for SMA, EMA, SMMA and LWMA. - It is recommended to use MA Speed Pro in trend strategies
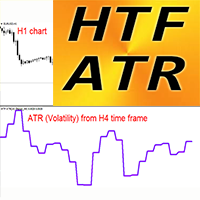
Crypto_Forex Volatility Indicator HTF ATR for MT4.
- Average True Range (ATR) itself is one of the most important indicators - it shows market volatility. - HTF ATR is a market volatility indicator used in technical analysis. HTF means - Higher Time Frame. - ATR is great to plan your dynamic Take Profits / SL locations: For example most optimal SL values are located in 1.2-2.5 ATR values. - This indicator is a useful tool to add to any trading system. - HTF ATR Indicator allows you to attach
Unleash Your Trading Potential with the Ultimate Signal Generator EA! Are you ready to transform your Gold trading ? The Ultimate Signal Generator EA is a sophisticated, non-Martingale, non-Grid system engineered to simplify and optimize your trading experience on the MetaTrader 4 platform. Key Advantages and Features Optimized for Gold Trading: This EA comes ready-to-use , pre-optimized for trading the volatile and exciting Gold (XAUUSD) market on the M5 (5-minute) timeframe. Just attach it t

Valkyrie Gold is an advanced automated trading system designed exclusively for XAUUSD (Gold) on the 15-minute (M15) timeframe.
It embodies the spirit of precision and discipline — executing every trade with strategic intent, controlled exposure, and intelligent adaptation to market dynamics. Live Account Link: https://www.mql5.com/zh/signals/2342786 Unlike typical grid or martingale systems, Valkyrie Gold operates through a structured single-entry logic with strict stop-loss protection on every

Double Edge Forex Indicator — User Manual “Master both sides of the market with precision and clarity.” ️ Introduction Welcome to the Double Edge Forex Indicator — your trading companion designed to simplify market analysis and amplify trading confidence. This tool empowers traders to visualize trend strength , direction , and reversal zones across multiple timeframes — all from one elegant chart panel. Whether you’re a scalper , swing trader , or day trader , Double Edge helps you identify

Turbo Next is a high-performance trading bot for the Forex market, designed to automate trading strategies and adapt to the ever-changing market conditions. This tool utilizes advanced algorithms to process market data, allowing it to automatically identify optimal entry and exit points, minimizing human error and improving trading results. Key Features of Turbo Next : Support for Multiple Currency Pairs : Turbo Next works with a wide range of currency pairs such as EURUSD, GBPUSD, USDJPY, A

If you're tired of trying to keep up with the unpredictable market, then it's time to let the Gipo Trex bot work its magic. This bot is designed to catch big price swings up or down, allowing you to perform at your best when the market moves in your favor.
Gipo Trex is a unique tool that helps traders make the most of a volatile market. With two different bot modes, you can find the perfect setup for your individual needs and trading style. Whether you are a beginner or an experienced trad
Unleash Your Gold Trading Potential with Precision Signals EA! Are you ready to elevate your Gold (XAUUSD) trading game? Introducing the Precision Signals EA , a sophisticated and ready-to-use Expert Advisor designed to capture precise movements in the volatile gold market. Built on robust technical analysis, this EA is your essential tool for automated, disciplined trading. Why Choose Precision Signals EA? Optimized for Gold (XAUUSD) on M5: This EA has been meticulously optimized and tuned s

Forex Workstation is a powerful and efficient Forex trading bot designed to use patterns, price hold levels, volatility analysis and market scaling. This bot offers unique capabilities for automated trading and optimization of strategies on various currency pairs. Let's look at the main functions and settings of Forex Workstation: Main functions: • Multicurrency: Forex Workstation supports a wide range of currency pairs, which allows you to diversify your portfolio and distribute risks. • Usin

The Cyberosaurus bot is an innovative next-generation bot that serves as a powerful tool for trading in the classic Forex market and with cryptocurrencies (for corresponding brokers). It operates with the majority of pairs, so it is advisable to test it before using it on a specific pair. It is specifically designed to work with these markets, without the ability to trade other assets such as stocks or indices.
The main control parameters of the bot are presented in a convenient and conci
**Quantum Signal** is a professional Expert Advisor engineered for fully automated trading on Forex and cryptocurrency markets. Crafted to meet MQL5 Market standards, it combines cutting-edge algorithms, flexible risk controls and an intuitive settings interface to deliver consistent profits and minimal drawdown. A minimum deposit of **10 000 USD** unlocks trading on most major and minor currency pairs as well as crypto symbols.
---
## Overview & Purpose
* Automates trade entries and exits u
Looking for a trading tool based on the MACD indicator that can display crossovers arrows on all time frames? Introducing trading indicator : All Time Frame MACD Model S ready to help you achieve daily profits. This tool is created using the intersection of two indicator lines of MACD : the main MACD and the signal MACD. Using this tool makes it easier to observe the real-time dashboard and intersections of multiple timeframes simultaneously. Viewing both higher and lower timeframes simultaneou
Looking for a trading tool based on the MACD indicator that can display crossovers arrows on all time frames? Introducing trading indicator : All Time Frame MACD Model T ready to help you achieve daily profits. This tool is created using the intersection of two indicator lines of MACD : the main MACD and the signal MACD. Using this tool makes it easier to observe the real-time dashboard and intersections of multiple timeframes simultaneously. Viewing both higher and lower timeframes simultaneou

Indicator Name: BreakingConfirmedLevel
Type: Professional indicator for detecting confirmed breakouts of strong price levels Description:
The BreakingConfirmedLevel indicator is an advanced tool designed to detect confirmed breakouts of strong price levels in the market. It relies on precise price action analysis and multi-layer confirmation logic before generating any signal. This ensures highly accurate entry points after a real breakout, minimizing false signals and increasing consistency in
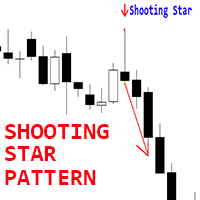
Crypto_Forex Indicator "Shooting Star pattern" for MT4, No repaint, No delay.
- Indicator "Shooting Star pattern" is very powerful indicator for Price Action trading. - Indicator detects bearish Shooting Star patterns on chart: Red arrow signal on chart (see pictures). - With PC, Mobile & Email alerts. - Indicator "Shooting Star pattern" is excellent to combine with Support/Resistance Levels.
// Great Trading Robots and Indicators are available here: https://www.mql5.com/en/users/def1380/sel

GainLossView – Smart Profit Tracker for Every Trader GainLossView is a powerful yet lightweight indicator designed to give you real-time visual control of your trading performance — directly on the chart.
Whether you trade manually or with Expert Advisors , GainLossView keeps you fully aware of your daily gains, current losses, and total balance with clean, instant updates. Why Traders Love GainLossView GainLossView turns your chart into a live performance dashboard.
It helps you stay conn
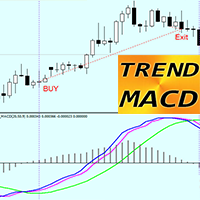
TREND MACD Indicator for MT4 - is great & efficient trading tool!
- This indicator is good for Trend Traders who are focused to catch big price movements. - TREND MACD consist of 3 lines: Green line - shows main trend direction, and Blue & Magenta lines for entry and exit. - Indicator allows to maximize profit - not to exit from profitable trade too early. - Indicator has built-in Mobile and PC alerts.
HOW TO USE indicator for Buy trades (see pictures): 1) Check if Blue & Magenta lines both a

QuantumGuard Pro - Intelligent Quantum Risk Management Trading System Core Features Five independent fund management groups for smart risk diversification Triple protection mechanism: profit target + drawdown protection + global risk control Professional trading panel for one-stop trade execution 24/7 real-time risk monitoring and protection Automatic display of average price lines for each group One-click close single group orders for precise control Order group highlighting for clear status o

Toukou Indicator – Your Winning Edge for Gold and Forex Trading The Toukou Indicator is a powerful trading tool designed to maximize profits in Gold (XAUUSD) and the Forex market .
Built on advanced algorithmic logic, it accurately identifies ideal entry and exit zones , adapting dynamically to changing market conditions. ️ Key Features: Smart Trend Detection: Instantly identifies bullish and bearish market phases. Accurate Buy & Sell Signals: Generated only under the most favorable tr

Unleash Your Gold Trading Potential with Trend Hunter Ultimate EA! Are you ready to stop guessing and start dominating the Gold market ? The Trend Hunter Ultimate Expert Advisor (EA) is a powerful, ready-to-use automated system designed specifically to capture significant trends in XAU/USD (Gold) . Forget complex manual analysis—this EA brings professional-grade strategy, precise risk management, and intelligent trade execution directly to your MetaTrader 4. It’s not just an EA; it’s your per

LemonSqwzr — “Squeeze the trend, not your nerves.” LemonSqwzr is a no-nonsense MT4 Expert Advisor built for breakout-driven trend following with risk discipline first . It hunts clean directional moves, adds smartly, and protects profit without over-engineering your chart. What it does (in plain English) Finds breakouts, rides trends. Uses Donchian channels (e.g., 34/14 or 55/20) to identify fresh momentum and exit on a reverse breakout. Filters the noise. Trades only when market efficiency is r
The Reflection Angle indicator is a high-precision professional tool that delivers over 90% accuracy across all timeframes . It’s designed to detect price reversals and pinpoint ideal entry points with exceptional reliability. Key Features: Works flawlessly on all timeframes with no signal delays. Performs best during high-liquidity sessions such as London and New York . Ideal for news events and volatile market conditions . Proven signal accuracy exceeding 90% in real trading tests. Recom

Unleash Precision Trading with the Precision Entry Master EA! Are you ready to elevate your trading game? The Precision Entry Master EA is a sophisticated, ready-to-use automated trading system designed to capture high-probability trade setups, particularly on the Gold (XAUUSD) market on the M5 (5-minute) timeframe on the Exness broker. For brokers other than Exness, you may need to slightly optimize the Risk Percentage parameter to adjust for that broker's unique spread and execution conditio

Blogs : https://www.mql5.com/en/blogs/post/765148 MT4 Version : https://www.mql5.com/en/market/product/154458 MT5 Version : https://www.mql5.com/en/market/product/154459
Telegram Order – Smart Trade Manager & Telegram Notifier for MT4
Telegram Order is a smart trade-manager and notification tool for MetaTrader 4. It automatically monitors all your orders (market & pending), sends detailed notifications to Telegram (with optional screenshots), and gives you an intuitive panel for managing TP, S

Forex Bot Junior - Trend-Following, Reliable Trading.
Forex trading is a complex and dynamic market that requires significant time, effort, and experience to successfully navigate. However, with the advent of trading bots, traders can now automate their trading strategies and take advantage of market trends without spending countless hours analyzing data.
What is Forex Bot Junior? It's a trading bot that uses advanced algorithms to analyze market trends and execute trades automatically. It's

The Black Ultra bot is recommended for use on highly volatile currency pairs or during periods of increased volatility. This is a trend-following trading algorithm with an advanced architecture, operating with pending orders . The bot’s mechanics are based on Trailing Stop orders, which it uses to enter and exit positions. Once you understand how these orders work, Black Ultra will become an easy-to-use tool for you. The bot supports using trailing stops for both real and

Forex Bot Investment Guru Description: Highly Efficient Trading Tool Introduction Among the many tools for trading on the foreign exchange market, the Investment Guru forex bot stands out with its advanced internal architecture and unique operating mechanics. Its main goal is to provide traders with the ability to maximize market volatility without promising profits but with a clear structure that encourages purchasing. Operating Principle Investment Guru employs trend trading methods, all

Tech Trader Forex Bot: Your Key to Reliable Trading Success Introduction to Forex Trading Forex trading is a complex and dynamic marketplace that requires considerable time, effort, and expertise for effective navigation. With the advent of trading bots, traders can now automate their trading strategies, harnessing market trends without the need to spend countless hours analyzing data. Enter the Tech Trader Forex Bot , a cutting-edge solution designed to simplify your trading experience. What

Seek And Find — Adaptive Grid Expert Advisor for MetaTrader Seek the Pattern. Find the Opportunity. Seek And Find is a smart, fully automated Expert Advisor that combines a structured grid strategy with dynamic market analysis. It identifies price consolidation zones using a bar-based channel system and activates a calculated order sequence when optimal conditions are met — all without relying on external indicators.
Whether the market trends or ranges, this EA is built to adapt, manage r
Looking for a trading tool based on the CCI indicator that can display crossovers arrows on all time frames? Introducing trading indicator : All Time Frame Double CCI Model S ready to help you achieve daily profits. This tool is created using the intersection of two CCI (Double CCI) indicator lines: the main CCI and the signal CCI. Using this tool makes it easier to observe the real-time dashboard and intersections of multiple timeframes simultaneously. Viewing both higher and lower timeframes

Unlock Gold Trading Excellence with Pinpoint Extreme Swing EA! Tired of unpredictable market swings? The Pinpoint Extreme Swing EA is your powerful, fully automated solution designed specifically to pinpoint high-probability reversal points in the volatile Gold market ( XAUUSD ). This is not just another Expert Advisor; it’s a ready-to-use, optimized system on the Exness broker. Crafted to capture extreme swing opportunities with precision and smart money management. For brokers other than Exn

Trade Forward: Modern Trading System for the Forex Market General Description Trade Forward is an expert system designed to automate trading on the Forex market. Our goal is to provide traders with a powerful tool that meets the current demands of the financial industry, combining ease of setup with high performance. The system does not make bold promises of profit but instead focuses on the real capabilities and functionality it offers. System Architecture and Functionality Trade Forward featur

Product Description: Intuition Bot – Your Reliable Partner in the World of Forex Trading Intuition Bot is an advanced expert system designed to optimize the trading process in the Forex market. This bot allows traders of all experience levels to efficiently manage their trading strategies without excessive focus on profit prediction. With its enhanced internal architecture, Intuition Bot can operate with a wide range of currency pairs, ensuring flexibility and adaptability in various market cond

Product Description: Trading Vision – Automated Assistant for Forex Traders Introduction In today's financial markets, automating Forex trading is not just desirable but essential for success. The primary goal of automated trading systems like Trading Vision is to simplify the trading process by implementing advanced algorithms to analyze market trends. This allows traders to focus on strategic thinking while leaving routine operations to technology. What is Trading Vision? Trading Vision is a p

Product Description: Market Analyst – Your Reliable Tool for Forex Trading Market Analyst is a highly efficient trading robot designed to operate on highly volatile currency pairs and during periods of increased market volatility. This bot is focused on trend trading and features a complex internal architecture that enables it to effectively manage pending orders. The operation mechanism of Market Analyst is based on the use of basic trailing stops for entering and exiting positions, making it e
RET System Fast Bias The RET Fast Bias indicator is number 4 of 10 tools in the RET System , revealing when short-term momentum begins to shift against or with the dominant trend.
It helps traders identify the first signs of bias change — when short-term energy confirms, opposes, or precedes the larger market move. Built around Reversal Anticipation , Fast Bias is designed to show when price action is about to change direction before it does. What It Does Displays short-term market bias di

Hybrid Sniper Triple – High-Frequency Precision Engine with Smart Trailing Logic Unlock institutional-grade execution with Hybrid Sniper Triple — a next-generation, multi-strategy Expert Advisor engineered for high-frequency trading without compromising on accuracy, risk control, or adaptability . Merging four powerful, non-SMC strategies into a single intelligent system, this EA scans multiple timeframes to deliver precise, ATR-adaptive entries across major forex pairs and gold (XAUUSD). Wh
Trend Flow Entry Pro is a simple yet powerful trend-following indicator designed to help you enter the market at optimal pullback points.
The system displays an Entry Signal at the top-right corner of the chart.
When both indicators are blue, a Buy signal is triggered — ideal for long entries.
When both are red, it signals a Sell opportunity — perfect for short trades.
These signals appear only when the market is trending clearly, helping you ride the wave with confidence and avoid sideways

Apex G is an automated trading robot, or expert advisor, designed for gold trading (XAUUSD) on the MetaTrader 4 (MT4) platform. Its operation is based on a complex algorithm that utilizes price action and advanced pattern recognition techniques to make trading decisions.
The full list is available for your convenience at https://www.mql5.com/ru/users/pants-dmi/seller
This advisor isn't just a price monitor. It analyzes charts, highlighting important support and resistance zones and identifying
MT4 Professional Copy Trading System MT4 Professional Copy Trading System is a reliable multi-account trade copier for fund managers, signal providers, and professional traders.
It enables real-time synchronization of trades between master and receiver accounts with precise risk control, flexible lot allocation, and advanced protection features.
Designed for institutional precision, it offers fast, consistent, and secure execution across multiple brokers. Overview The MT4 Professional Copy Trad

Golden AI is an automated trading advisor (EA) developed specifically for gold trading (XAUUSD) on the MetaTrader 4 (MT4) platform. It is based on a sophisticated algorithm that utilizes price action and advanced pattern detection techniques to make trading decisions. The full list is available for your convenience at https://www.mql5.com/ru/users/pants-dmi/seller
The Golden AI advisor doesn't just monitor price movements. It analyzes charts, identifying key support and resistance levels, and
Signal Histogram is a reliable technical indicator for the MetaTrader 4 platform designed to visually identify the current trend by comparing the closing price with a moving average. The indicator displays the histogram in a separate window: green bars indicate that the price is above the average, while red bars indicate that the price is below or equal to the average. This approach allows you to quickly assess the trend direction and identify potential reversal points. The indicator generates

RET Momentum is 3 of 10 indicators designed to help traders identify the acceleration phase of market moves — where reversals turn into trends and trends begin to exhaust.
It forms part of the RET System , working in sync with the RET Channel , High Low , and Exhaustion indicators to confirm R eversal Anticipation setups and avoid premature entries. This tool measures real-time momentum flow through proprietary candle calculations, color shifts, and smooth transitions — making it easier t

Dream Chaser: Expert Advisor for MetaTrader 4 Dream Chaser is a powerful and multifunctional Expert Advisor that combines market volatility analysis with a grid trading strategy. It is designed for automatic entry point search and position management, equipped with a convenient visual interface for manual control. Key Features Hybrid Strategy: Uses analysis of candle sizes for the initial entry and a grid method for averaging. Visual Control Panel: Includes an information display and
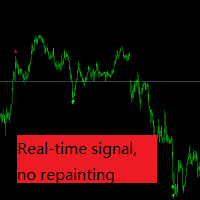
Based on over 10 years of trading experience, we have compiled technical indicators and real-time signals that are suitable for gold trading in various cycles without redrawing. However, we need to set parameters. The default parameter now is one minute cycle gold trading, and the signal is very reliable, with 3 to 5 signals per day. Of course, you can also adjust the parameters to find the one that suits you. After thorough research, we can achieve 100% stable profit. Wishing everyone a prospe

Candle Flip Martingale (MA-Confirm + DD Guard + Profit-Only Trailing) What it is
An MT4 expert advisor that follows the trend, adds positions only on confirmed momentum (“candle flip”), and protects the account with a dual safety layer: maximum drawdown guard and profit-only trailing stop . A dark dashboard shows live KPIs (Balance/Equity, DD gauge, target progress, equity sparkline, active positions). Core Logic Seed Entry (trend + MA confirm)
The first trade (“seed”) opens only when the late

Unlock the Gold Market with Catch The Turn EA! Are you ready to stop guessing and start catching the most profitable reversals in the Gold market (XAUUSD)? The Catch The Turn EA is a highly specialized, sophisticated Expert Advisor designed for traders who want to capitalize on precise market turning points. Built on a proprietary blend of classic indicators and dynamic money management, this EA is engineered to find high-probability entries and manage trades intelligently. It's an out-of-the-

AlphaTrader: Your Intelligent Partner in Forex Trading AlphaTrader is an advanced trading system that utilizes automated analysis and trading strategies to optimize decision-making in the Forex market. Built using geometric patterns and cutting-edge algorithms, this bot detects pricing patterns, providing precise signals for successful trades. Why Choose AlphaTrader? AlphaTrader is not just a trading bot; it’s a full-fledged partner designed to help you manage your capital as efficien

FlexiTrade Bot: Trade Smart, Not Blind Ditch the guesswork. FlexiTrade Bot is more than just a trading tool — it’s an intelligent trading engine built for traders who value speed, precision, and adaptability . With real-time market analysis and pattern recognition, FlexiTrade delivers actionable signals with razor-sharp accuracy so you can focus on results, not reaction. What Sets FlexiTrade Apart? Market Structure Awareness Unlike bots that rely on rigid indicator rules, FlexiTr

TrendCore Adaptive FX — Smart Expert Advisor for Confident and Adaptive Forex Trading TrendCore Adaptive FX is a powerful, fully automated trading robot designed for consistent performance in the Forex market. It combines trend-based technical analysis, adaptive lot management, and solid capital protection strategies to ensure robust and efficient trading under real market conditions. Whether you're a professional trader or a long-term investor, this EA offers an intelligent solution to a
Looking for a trading tool based on the CCI indicator that can display crossovers arrows on all time frames? Introducing trading indicator : All Time Frame Double CCI Model T ready to help you achieve daily profits. This tool is created using the intersection of two CCI (Double CCI) indicator lines: the main CCI and the signal CCI. Using this tool makes it easier to observe the real-time dashboard and intersections of multiple timeframes simultaneously. Viewing both higher and lower timeframes
The MetaTrader Market offers a convenient and secure venue to buy applications for the MetaTrader platform. Download free demo versions of Expert Advisors and indicators right from your terminal for testing in the Strategy Tester.
Test applications in different modes to monitor the performance and make a payment for the product you want using the MQL5.community Payment System.
You are missing trading opportunities:
- Free trading apps
- Over 8,000 signals for copying
- Economic news for exploring financial markets
Registration
Log in
If you do not have an account, please register
Allow the use of cookies to log in to the MQL5.com website.
Please enable the necessary setting in your browser, otherwise you will not be able to log in.