Watch the Market tutorial videos on YouTube
How to buy а trading robot or an indicator
Run your EA on
virtual hosting
virtual hosting
Test аn indicator/trading robot before buying
Want to earn in the Market?
How to present a product for a sell-through
Expert Advisors and Indicators for MetaTrader 4 - 126

MT4 platform AI T3 MA Super Fill indicator use introduction I. Overview of indicators
The AI T3 MA Super Fill indicator is a powerful analytical tool that combines advanced algorithms and T3 moving average technology to provide traders on the MT4 platform with accurate market trend judgments and trading signals. It uses intelligent algorithms to deeply process the price data, and displays the changes of the T3 moving average in a unique way to help traders more effectively grasp the market dyn

Advanced Trailing Stop Loss Utility Optimize your trading strategy with the Advanced Trailing Stop Loss Utility , a powerful tool designed to dynamically protect your profits and minimize losses. Whether you're a beginner or an experienced trader, this utility ensures that your trades remain secure while maximizing potential gains. Key Features: Dynamic Stop Adjustment : Automatically adjusts the stop loss level as the market moves in your favor, locking in profits while allowing for market fluc

The Pure Price Action ICT Tools indicator is designed for pure price action analysis, automatically identifying real-time market structures, liquidity levels, order & breaker blocks, and liquidity voids. Its unique feature lies in its exclusive reliance on price patterns, without being constrained by any user-defined inputs, ensuring a robust and objective analysis of market dynamics. Key Features Market Structures A Market Structure Shift, also known as a Change of Character (CHoCH), is a pivot

EARLY REMINDER: The Starting price is 65 price will rise soon up to 365$ and then 750$ after first 10 copies of sales. Grab this offer now! Introduction
Hello, traders! Welcome to the demonstration of the Forex Beast Indicator , a comprehensive tool designed to assist aspiring traders in navigating the complexities of the forex market. This indicator incorporates seven essential components to provide a well-rounded trading experience: Moving Averages Colored Zones Support and Resistance Levels

SimpleProb: Your New Ally in the Financial Market! Description Are you tired of complicated indicators that confuse more than they help? SimpleProb is here to bring simplicity and efficiency to your trading experience on MetaTrader 4 ! SimpleProb is a technical analysis indicator designed for traders who seek clarity and precision in their buying and selling decisions. It calculates the probabilities of upward ( CALL ) and downward ( PUT ) movements based on the last 14 periods, providing clear

[Channel for news and updates] , [Guide on how to run EA]
The EA operates with advanced AI and machine learning, constantly adapting to market conditions in real-time. With historical data analysis and real-time execution, Dynamic Edge ensures you stay ahead of the market and capture the best opportunities as they arise.
For traders who prefer ensured profit, Dynamic Edge includes an optional recovery zone feature . This setting increases trade aggressiveness , but to use it effectively, a

Trade Focus identifies fast and slow moving average crossovers, ensuring you capitalize on trend reversals and market direction changes. With minimal inputs, it helps you catch early trend shifts efficiently.
Trade Focus is designed for traders aiming to meet specific trading goals, especially in challenging environments like prop firms . It offers strategic tools like daily profit and loss targets and advanced risk management settings to help you stay within firm-imposed limits. For traders l

1.Indicator gives key trade levels with red and green arrows. 2. You need to manually mark these trade levels on higher time frame with horizontal line or area and take the trades based on price action on lower timeframe at these trade levels. For example, see rejection or violation of these trade levels to go along or reverse the trade. (See attached screenshot) 3. You need to manually turn off signals for lower timeframes you comfortable working with. 4. Please note that you need to manually

Download DEMO here: https://www.mql5.com/en/blogs/post/759769 An ultimate panel you've never seen before. Compact and nice Trade panel with large Total P/L and it's percentage display. Groups for trades summary available: Ticket, Symbol, Type, Category, and Magic. Average price field helps you know your trading average price and direction. Set magic and comment of your trading in a very easy way. Group closing by symbol, type, category or magic - only by one click. Close All button for a qu

AI Supertrend timely alerts
MT4 Super Trend timely reminder indicator introduction I. Overview of indicators The MT4 Super Trend Alert Indicator is a technical analysis tool specifically designed for the MetaTrader 4 platform to help traders accurately capture changes in market trends and send timely signals to alert traders to potential trading opportunities. It is based on a unique AI-based algorithm that takes into account factors such as price volatility, trend strength, and market volatil

Two line MACD index composition MACD line (express line) : Usually calculated by subtracting the 12-cycle EMA from the 26-cycle EMA, it is more sensitive to price changes, can quickly reflect the change of the recent price trend, its fluctuation is relatively frequent, used to capture the dynamics of short-term market trends. Signal line (slow line) : Generally a 9-cycle EMA of the MACD line, its role is to smooth the MACD line, filter out some short-term noise and false signals, make the indic

This expert is under construction and is not yet completed
The development of this expert will be completed in 2 years at most.
Our goal in publishing this expert is to attract capital to develop our best expert.
This expert will definitely be the best expert of our team.
To participate in this project, you can buy this expert at the lowest possible price.
This expert will definitely be the most expensive expert of our team in the future.
This expert will be built with the latest methods and st
It combines adaptive, intelligent strategies with advanced features like multi-timeframe analysis, automatic trading adjustments, and precise risk management. Capable of responding to fast market changes while ensuring the long-term protection of your capital. This Expert Advisor, powered by the GPT-4o platform and utilizing machine learning techniques like random forest regression, xgboost regression, and finance neural networks, offers advanced capabilities for time series analysis. It can ex

- Real price is 1000$ - Limited Discount (It is now 299$) Welcome, Gold Trade Expert opens automatically trade with Highly profit, Fixed Stop loss. No Martingale, No Grid, No Scam Strategy Tester can't filter critical news. Gold price is widely followed in financial markets around the world. Gold was the basis of economic capitalism for hundreds of years until the repeal of the Gold standard, which led to the expansion of a flat currency system in which paper money doesn't have an implied b
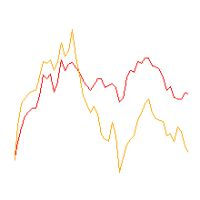
Line1: simple calculation of change in closing price for the chosen input period - named Velocity. Line2: simple calculation of change in velocity for the chosen input period - named Acceleration. Feel free to play with the input periods to find a profitable combination. For faster results it is best to do it in MT Optimizer. Can assist in either manual or automatic trading.

Comprehensive Documentation for the JesUsdJpy Expert Advisor (EA) Overview For best result, Main Strategy: Set to true for Main Usdjpy strategy, then use default settings. Strategy2: Set this to false Unless you like the strategy
This Expert Advisor (EA) is specifically designed for forex traders, with an emphasis on optimizing performance on the USD/JPY currency pair on the M5 timeframe. It features advanced trading strategies, dynamic risk management tools, and customizable settings to adapt

This trading bot is designed to help automate a strategy that combines two popular technical indicators: the Relative Strength Index (RSI) and the Williams %R. The bot analyzes market conditions to identify potential high and low price levels based on the selected indicator thresholds. Users have the flexibility to enable or disable each indicator to suit their preferred trading approach. Key features of this bot include: Trade Automation: Automatically opens and closes trades based on indicator

Best Divergence Indicator for advanced traders without distraction of lines or arrows. It is not a magic blackbox for novice traders rather a great tool for experienced traders to decide their entry and exit. Can be used for most of the Forex pairs, Gold, Oil, Crypto. Flexibility to play with input to customize ur unique research too. Therefore, I will suggest turning off arrows and divergence line to reduce clutter and instead use the following advice: For sell on divergence indicator start tu

The Strategy is an algorithmic trading system designed for the MetaTrader platform, specifically optimized for the SP500 CFD on an hourly timeframe (H1). This strategy employs a combination of technical indicators and advanced logic to generate entry and exit signals for both long and short positions.
parameters: preferredFillingType: Defines the preferred order filling type, e.g., FOK (Fill or Kill). forceFillingType: Forces the preferred filling type if set to true. CustomComment: Custom com
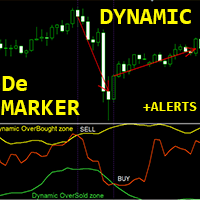
Crypto_Forex Indicator "DeMarker with Dynamic OverSold/OverBought zones" for MT4. No repaint. DeMarker oscillator curve indicates the current price position relative to previous highs and lows during the indicator calculation period. It is great to do Sell entries from dynamic OverBought zone and Buy entries from dynamic OverSold zone. T his indicator is excellent to combine with Price Action entries as well . D ynamic OverBought zone - above yellow line.
Dynamic OverSold zone
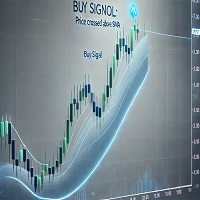
Explore Our Full EA Collection
Visit our website for an extensive range of expertly crafted Expert Advisors designed to empower traders of all levels. Whether you're new to trading or a seasoned professional, our tools are tailored to meet your needs. Affordable Trading for Everyone
We believe in making trading accessible to everyone. That’s why all our Expert Advisors are priced at just $65 each, helping our community achieve success without breaking the bank. Unlock the Power of Automation
Th

Unlock the Power of Smart Trading with SmartDCA Trader! SmartDCA Trader is your ultimate companion in navigating the dynamic world of Forex trading. Leveraging the highly effective Dollar-Cost Averaging (DCA) strategy, this expert advisor is designed to optimize your trades, minimize risks, and maximize profits—all with precision and simplicity. Why Choose SmartDCA Trader? Powerful DCA Strategy: Automatically adjusts and averages positions during market fluctuations to secure better entry prices

LevelGuard SmartSMA Master Support & Resistance Trading with Precision LevelGuard SmartSMA leverages the power of moving averages to help you trade confidently across markets. Designed to identify dynamic support and resistance levels, this EA delivers precise trade entries and exits, empowering traders to capitalize on market movements with ease. How It Works Core Strategy: Uses a central SMA (e.g., 50 or 200-period) as a dynamic support or resistance line. Additional SMAs (optional) provide s

MT4 Version : https://www.mql5.com/en/market/product/127793 MT5 Version : https://www.mql5.com/en/market/product/127794
"Gold Breakout" is a premium Expert Advisor (EA) specifically designed to capitalize on Gold price movements with a breakout strategy from a specific price and time range.
Combined with advanced switching risk management, this EA offers an automated solution for traders looking for a reliable and consistent tool.
Key Features: 1. High Precision Breakout Strategy Identifies

Introducing the Ultimate MetaTrader 4 Trading Bot: Precision, Efficiency, and Profitability! Are you ready to take your trading game to the next level? Say hello to your new trading companion – a meticulously designed Expert Advisor (EA) that combines cutting-edge technology with rock-solid reliability. Why Choose Our EA
Efficient Capital Management Trades with a standard 0.01 lot size , ensuring compatibility with both small and large accounts. Dynamically adjusts Stop Loss (SL) and Take Profi

Super Scalp Indicator MT4 is a unique trend reversal 100% non-repainting multi-algo indicator that can be used on all symbols/instruments: forex, commodities, cryptocurrencies, indices, stocks . Super Scalp Indicator MT4 will determine the current trend at its early stages, gathering information and data from up to 10 standard algos When indicator give a valid buy or sell signal, a corresponding arrow will be printed on the chart, open trade at start of the next candle/bar

This product works by detecting trend opportunities. So as shown in the screenshot when The indicator shows an upward arrow it shows the market is on an uptrend and when the indicator Shows a downward arrow it shows the market is on a downward direction. What makes this indicator Special is that it has additional signals just below the arrow signals. It is up to the trader to be Creative and combine these signals with the arrow signal to get accurate forecasts.
Bollinger trading is an indicator for mt4 that uses Bollinger bands and other trend following strategies To detect the direction of the market. Just as attached in the screenshot the light blue line shows areas The market is rising. This means opening positions here is in the direction of the trend. The dark blue lines cane be used for sell trades when the market moves in the opposing direction. Using this tactics you can have a clear sense of where the market is headed.

Do you want to beat the market? This indicator uses advanced mathematical formulae That include regression analysis to predict market trends. So what happens is That when the price is above the indicator line as depicted in the screenshot The trend is rising and when the price is below the indicator line the Trend is falling. This opportunities appear multiple times each day enabling You to profit. This indicator makes the trend your friend.

This product enables you to trade in opportunities that are detected by the indicator. Using advanced Calculations and formulae this product enables you to profit from trend opportunities. Trend master has Channels that show areas the trend is strong and you are likely to profit. Once this zone Is breached the price is on in uncertain territory and there is no guarantee the trend will continue This means there might be reversal and it is advisable to exit a trade here.

The ABC Indicator analyzes the market through waves, impulses, and trends, helping identify key reversal and trend-change points. It automatically detects waves A, B, and C, along with stop-loss and take-profit levels. A reliable tool to enhance the accuracy and efficiency of your trading. This product is also available for MetaTrader 5 => https://www.mql5.com/en/market/product/128178 Key Features of the Indicator:
1. Wave and Trend Identification: - Automatic detection of waves based on mov

Pullback Sharp Movement EA it is a fully automated “pullback” trading system. The system uses the main patterns of the Forex market in trading – the return of the price after a sharp movement in any direction. Advisor trade the average price return on non-trending pairs correlated with each other. When EA trades, many small transactions are simultaneously opened on the account. This allows you to diversify trading entrances and exits from the market. Use ECN accounts with a minimum spread and c

Moving average alert plus is an advance moving average alert that will easily monitor the price action based on set moving averages to multiple open charts. Objective: To monitor multiple open charts and notify traders conveniently in a single display panel when using the moving averages to enter/exit a trade. Features: Monitor price action in two timeframes at the same time Supports simple, exponential, smoothed, linear weighted moving averages Trigger an alert based on candle size (full/

Manh RSICrossingAlert with Alert Indicator is a versatile technical analysis tool that aids traders in identifying market trends and potential entry and exit points. It features a dynamic Manh RSICrossingAlert , adapting to market conditions for a clear visual representation of trend direction. Traders can customize parameters to align with their preferences and risk tolerance. The indicator assists in trend identification, signals potential reversals, serves as a trailing stop mechanism, and p

DMI Telegram Notifier: Your Trading Notification Assistant on Telegram The DMI Telegram Notifier is a powerful and customizable tool designed to send detailed and instant trade notifications directly to Telegram.
Whether you are a professional trader or a passionate enthusiast, this Expert Advisor helps you track your positions, receive alerts on order modifications, and share your results in real time with your followers or trading group. Key Features: Instant Notifications: Receive detailed a

Advanced Trading Tools for Smarter Decision Making
Our cutting-edge trading tools allow traders to seamlessly execute buy and sell orders, while providing robust planning capabilities to optimize their trading strategies. Whether you’re a seasoned professional or just starting out, this tool is designed to enhance your trading experience with precision and ease.
Key Features: Real-time Buy and Sell Execution: Easily place orders instantly and take advantage of market opportunities without del

100% refund policy (full version only)
A fully automatic expert
Designed and produced 100% by artificial intelligence, with the world's most advanced technology
All trades have profit and loss limits, with the best and least risky market strategy, without using dangerous strategies such as Martingale and hedges, etc.
A specialist who has been trained by artificial intelligence for years to correctly identify trends (with the latest methods in the world)
The artificial intelligence of this expe

The Breakaway Fair Value Gap (FVG) is a typical FVG located at a point where the price is breaking new Highs or Lows.
USAGE Figure 1 In the figure 1, the price range is visualized by Donchian Channels.
In theory, the Breakaway FVGs should generally be a good indication of market participation, showing favor in the FVG's breaking direction. This is a combination of buyers or sellers pushing markets quickly while already at the highest high or lowest low in recent history. Figure 2 Whi

AIXAUUSD/XAUAUD EA Strategy is specifically designed to scalp gold exclusively on the H1 chart. The EA uses a DCA approach, averaging positions gradually using the multiplier value EA operates in aggressive mode which require a minimum capital of $3,000 per pair.Best pair to trade :XAUAUD . If you intent to trade XAUAUD+XAUUSD make sure to use 2 different accounts for each(Do not trade 2 pairs with 1 single account)
and always use of a 0.01 lot size with a leverage of 1:500+ alongside a low-spre
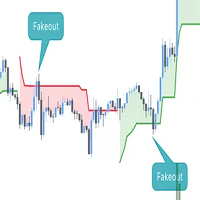
This script is an enhanced version of the classic Supertrend indicator. It incorporates an additional feature that ensures trend reversals are more reliable by introducing a Fakeout Index Limit and a Fakeout ATR Mult. This helps avoid false trend changes that could occur due to short-term price fluctuations or market noise. In smart money concept, when institute , "big-fish" want to buy, they usually sell first to take sellside liquidity and vice versal. This is why the indicator become importan

CyNeron: Precision Trading Meets AI Innovation Manual & set files : Contact me after purchase to receive the manual and set files Price : The price increases based on the number of copies sold Available copies : 5 AI-Driven Snapshot Analysis: A Market First CyNeron is the first EA on the market to integrate advanced AI into a revolutionary trading approach by capturing and processing detailed snapshots of market conditions.
Utilizing cutting-edge AI-powered neural networks, it evaluates price d
Introduction
Take your forex trading to the next level with our vibrant, color-coded session indicator! Designed for MT4/MT5, this tool visually separates the Asian (Purple) , London (Yellow) , and NYC (Pink) trading sessions for optimal trading strategy. Key Features Color-Coded Precision : Asian (Purple), London (Yellow), NYC (Pink) sessions marked directly on your chart. Perfect for Session Traders : Focus on the overlaps and high-volatility periods. Compatibility : Works seamlessly with MT4

Gold Fish Scalper Advisor for gold trading on the MetaTrader 4 (MT4) platform is an automated trading system created specifically for trading gold assets (XAU/USD). Typically, such robots use algorithmic methods to execute trades based on technical analysis and other market data. the full list for your convenience is available https://www.mql5.com/ru/users/pants-dmi/seller
This program uses built-in formulas to process data in real time, effectively adapting to changes in the market and provid

The "BioStar" indicator is an innovative tool for trend analysis on the Forex market. It has unique capabilities and a wide range of settings that will help traders make informed decisions when trading.
This indicator is based on the analysis of the market trend and helps to identify the direction of price movement. It uses various mathematical algorithms and statistical methods to determine the strength and stability of the trend in the market.
One of the key features of the "BioStar" indica

Only 6 copies out of 10 left at $30! This is a limited introductory offer: Buy EA at a special Discount price of only $30 The offer will end when the first 10 copies are sold... After that, the price will be raised to $60 !. HFT Evaluation System is a state-of-the-art algorithmic trading strategy that has been running on live accounts for several years. Unlike conventional systems that are optimized to fit historical data, HFT Evaluation Trading is designed to exploit current market inefficienc

Logic:
On the time of the latest news as is released weekly on the forex factory api ( https://nfs.faireconomy.media/ff_calendar_thisweek.xml ) the MT4 expert advisor will wait for retracement to the recent high or low then when a reversal signal is produced an entry will be executed with the stop loss being 40 pips below or above high or low and the take profit being on the opposing high or low.
The EA will mark the time of news events based on the selected pair. If the GBPJPY pair is select
The Binary exfish indicator is designed for binary options trading on M1 and M5 timeframes. It works with any currency pair, analyzing trends and providing entry signals as arrows on the chart: Blue arrow — buy signal. Red arrow — sell signal. Features: Default expiration : 1 candle. Adjustable expiration: from 1 to 3 candles. Signals are displayed before the close of the current candle for timely decisions. Alerts include sound notifications, pop-ups, emails, and mobile app messages. Installati

Ladder EA: Your Ultimate Trading Partner for Daily Success This expert advisor is crafted for traders who desire precise and secure solutions to achieve consistent daily profits and sustainable financial growth. Whether you’re looking to build small capital or enhance an existing account, Ladder EA brings advanced strategies and professional risk management to the forefront of your trading journey. Key Features of Ladder EA ️ Intelligent Risk Management: Applies well-structured risk percentage

100% refund policy (full version only) A fully automatic expert
Designed and produced 100% by artificial intelligence, with the world's most advanced technology
All trades have profit and loss limits, with the best and least risky market strategy, without using dangerous strategies such as Martingale and hedges, etc.
A specialist who has been trained by artificial intelligence for years to correctly identify trends (with the latest methods in the world)
The artificial intelligence of this exper

Gold SWmax EA - is one of the best Expert Advisor for Meta Trader 4 . The unique algorithm of the adviser analyzes the movement of the asset price, taking into account the factors of technical and mathematical analysis, determines profitable entry and exit points, and uses advanced money management and lot multiplier. Contact me immediately after purchase. After confirms the purchase of this EA via MQL5 you will receive Set file for real RoboForex/WorldForex accounts + Set file to optimiz

GOLDEN FAIRY – Gold Trading Platform on MetaTrader 4 (MT4) (XAU/USD)
Dive into the exciting world of trading, where technology becomes your faithful ally! GOLDEN FAIRY is an innovative trading advisor created for reliable and effective interaction with the gold market. It is based on powerful artificial intelligence algorithms, which, combined with deep analysis of market trends and strict risk management principles, allow you to extract maximum benefit from each transaction.
the full list fo

This Simple Smart Money Concepts indicator displays real-time market structure (internal & swing BOS / CHoCH), order blocks, premium & discount zones, equal highs & lows, and much more...allowing traders to automatically mark up their charts with widely used price action methodologies.
"Smart Money Concepts" (SMC) is used term amongst price action traders looking to more accurately navigate liquidity & find more optimal points of interest in the market. Trying to determine where institutional

The Market Heart indicator scans market entries after high volatility is noticed. Most big moves occur a short time after market volatility. Most big moves occur a short time after market volatility. The idea is to look for entries after the rectangles form and not necessarily as trade entry signals. . For example, you could use the Retracement Feeder indicator that generates arrow signals.
Market Heart MT5 Version
How to use: 1. Primary use The White Box is the first to be formed and

Using colors that reflect the prevailing market direction, the indicator is designed to show when the current trend is still dominant. This helps to filter out potential market noise and guides the trader to avoid false signals. By clearly visualizing trend strength and consistency, the tool assists in identifying higher-probability trade setups. It enhances precision by allowing traders to focus on movements that align with the broader market context. As a result, decision-making becomes more

BreakBot: This expert advisor is specifically designed for traders seeking smart and secure solutions to transform small capital into substantial profits, reaching $100,000 or more. It employs professional strategies and precise risk management to achieve steady and safe growth. Key Features of the Expert Advisor ️ Smart Capital Management: Utilizes carefully calculated risk percentages to maximize profits while minimizing losses. Automatically adapts to account size, making it ideal for both b
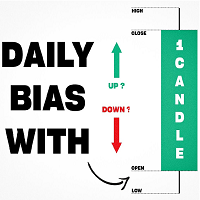
Inspired by TTrades video on daily bias, this indicator aims to develop a higher timeframe bias and collect data on its success rate. While a handful of concepts were introduced in said video, this indicator focuses on one specific method that utilizes previous highs and lows. The following description will outline how the indicator works using the daily timeframe as an example, but the weekly timeframe is also an included option that functions in the exact same manner.
On the daily timefr
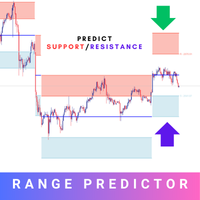
Introducing the Range Predictor : Your Ultimate Guide to Future Trading Ranges! Imagine having the power to see into the future of market moves— Range Predictor brings this dream to life. Designed to deliver real-time, predictive support and resistance levels , this tool goes beyond standard indicators, offering trend direction insights and precise range forecasts . Whether you're a day trader or a swing trader, the Range Predictor is your all-in-one toolkit for mastering the markets. MT5 Ver

The Scalper Boss indicator is a cutting-edge analytical tool designed to assess market conditions and identify optimal entry and exit points using a multi-layered logic framework. It adapts to changing market environments, providing traders with clear visual signals and trend lines. Its primary value lies in its ability to enhance market analysis by filtering noise and capturing meaningful movements, making it especially beneficial for scalping and intraday trading. While Scalper Boss does not g

Description of the Expert Advisor (EA) - Stop Loss Reverse Objective: The "Stop Loss Reverse" is an Expert Advisor (EA) designed to automate the management of pending orders by leveraging the Stop Loss (SL) level of open trades. Its main feature is the ability to automatically place pending orders at the Stop Loss level, creating a dynamic strategy that adjusts risk and Take Profit (TP) levels as the market moves. Key Features: Management of Open Orders: The EA monitors open orders on the chart,

100% refund policy (full version only) A fully automatic expert
Designed and produced 100% by artificial intelligence, with the world's most advanced technology
All trades have profit and loss limits, with the best and least risky market strategy, without using dangerous strategies such as Martingale and hedges, etc.
A specialist who has been trained by artificial intelligence for years to correctly identify trends (with the latest methods in the world)
The artificial intelligence of this exper

MT4 Version : https://www.mql5.com/en/market/product/121820 MT5 Version : https://www.mql5.com/en/market/product/121821
Garuda EA – Breakout Power with Dynamic Risk Management Garuda EA is a powerful Expert Advisor designed to capture breakout opportunities from specific time-based price zones (box). With a time-filtered strategy and smart risk management, Garuda EA aims to deliver consistent profits while keeping risk under control.
Key Features: Smart Breakout Entry: Trades are triggered whe

This expert use grid and advanced DCA and martingale strategy. The strategy used by Fund Manager by our country. Use with pair AUDCAD, with timeframe M5 it can survive 2015-Nov 2024. DrawDown Max from 2019-2025 15k USD for both pair
It works well in other Pairs in m15: AUDCAD, EURJPY
Use proper money management, use money that you can loose, withdraw your profit. This strategy can make good profit if you use good money management. Use the balance minimum of 2k-3k. Use default setting .

The Trend Ultimate Indicator is designed for visualizing and analyzing market trends, allowing traders to quickly assess current market tendencies. It is particularly useful for: Determining the duration of the current trend (bullish or bearish). Providing a clear visualization of price behavior relative to key moving averages and the MACD indicator. Supporting decision-making based on histogram dynamics (trend direction and intensity). Trend Ultimate does not guarantee profit but assists trader

* Super Assistant is an useful management tool that helps traders perform management tasks on MT4/MT5 account remotely via Telegram such as: - Get info (account, details of positions, pending orders, floating PL, price, economic news, etc) - Open trade (open instantly with preset parameters) - Manage trade (set SLTP automatically, break-even mode, max risk, close time every day, etc) - Close trade (close all, buy, sell, win positions by one click, set awaiting close by PL, time) - Set up no
The work of this Expert Advisor is similar to fishing, when you use several fishing rods. This Expert Advisor works on the channel indicator, the work of which you can see in the screenshots. This indicator is effective on any TM, so it can be used in all types of trading, including scalping for 5 and 15 minutes, intraday or full automatic trading of several instruments simultaneously on D1. This expert advisor is ideal for working both on a flat and during sharp or protracted trend movements (t

DMI MultiTimeFrame Candle Timer: Track Candle Countdown Across Multiple Timeframes with Clarity The DMI MultiTimeFrame Candle Timer is an advanced indicator designed to provide traders with real-time countdown timers for the remaining time before candle closes on multiple timeframes. This tool allows you to monitor multiple timeframes simultaneously, providing a clear and customizable visual of the candle countdown, helping you make precise and timely trading decisions. Key Parameters: Display O

Lucky Bot: The Ultimate USD/JPY Trend-Following Solution Version: 1.07
Category: Trend-Following EA
Timeframe: 1 Hour (H1)
Supported Pair: USD/JPY Description Lucky Bot is an advanced Expert Advisor (EA) designed to trade exclusively on the USD/JPY pair on H1 charts . This bot leverages advanced trend-following strategies to maximize profits while managing risks effectively. It is ideal for traders seeking a reliable, fully automated solution with proven results. Backtest Results (2024.06.11 –
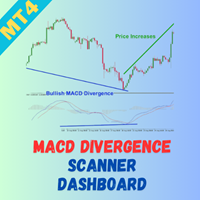
The MACD Divergence Multicurrency Scanner Dashboard for MT4 is a powerful tool designed to help traders identify bullish and bearish MACD divergence signals across multiple currency pairs and timeframes. It simplifies the process of spotting potential market reversals by providing real-time scanning and alerts directly from a centralized dashboard. Whether you are trading major pairs, minor pairs, or exotics, the scanner offers broad market coverage and flexible configuration options. By allowi
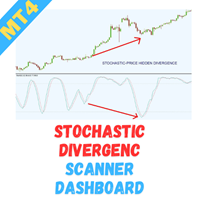
Stochastic Divergence Multicurrency Scanner Dashboard for MT4 is an advanced tool designed to help traders efficiently detect bullish and bearish Stochastic divergence signals across multiple currency pairs and timeframes. It simplifies the process of identifying potential market reversals by providing real-time scanning and alerts from a centralized dashboard. Whether you trade major pairs, minor pairs, or exotics, the scanner offers broad market coverage with flexible customization options. B
Old Time Frame EMA Индикатор двух динамических уровней сопротивления и поддержки Moving Average.
Данный индикатор рисует на открытом графике младшего тайм фрейма, ЕМА со старшего тайм фрейма. Создан для наглядности сигналов, для входа в рынок, для тех трейдеров, у кого Средние Скользящие Цены (ЕМА или МА),
являются основным сигналом для открытия или закрытия сделок. А также ориентиром, направлением тренда в движении
текущих цен, внутри дня и в среднесрочной торговле.
Возможные типы сред
MetaTrader Market - trading robots and technical indicators for traders are available right in your trading terminal.
The MQL5.community payment system is available to all registered users of the MQL5.com site for transactions on MetaTrader Services. You can deposit and withdraw money using WebMoney, PayPal or a bank card.
You are missing trading opportunities:
- Free trading apps
- Over 8,000 signals for copying
- Economic news for exploring financial markets
Registration
Log in
If you do not have an account, please register
Allow the use of cookies to log in to the MQL5.com website.
Please enable the necessary setting in your browser, otherwise you will not be able to log in.