Need creat a simple hedge ea

MQL4 Experts C++ C# MySQL Forex

Job finished

Execution time 6 days
Feedback from customer
not expert to creat ea. work with many eror for me.
Feedback from employee
Very bad customer, run away from him.

Specification


Need creat a simple hedge ea


Hare maximum entry 3. It is hedge but maximum hedge entry no 3.


No more entry , if 3 no. hedge entry is done, then should wait for again round hedge.


_____________


Hare hedge gride 25 pips. But if 3 rdentry pull back to loss, then no more entry and hare gaps 50 pips to open new.


1 stentry setup: I called it “entry 1” its lot size 0.01.                tp 25 pips sl 25 pips.(lot size , tp and sl can be change.)

2 ndentry setup:   I called it “entry 2” . its lot size 0.02. tp 25 pips, sl 25 pips. .(lot size , tp and sl can be change.)

3 rdentry setup: I called it “entry 3” . its lot size 0.04. tp 25 pips. Sl 50 pips. .(lot size , tp and sl can be change.)


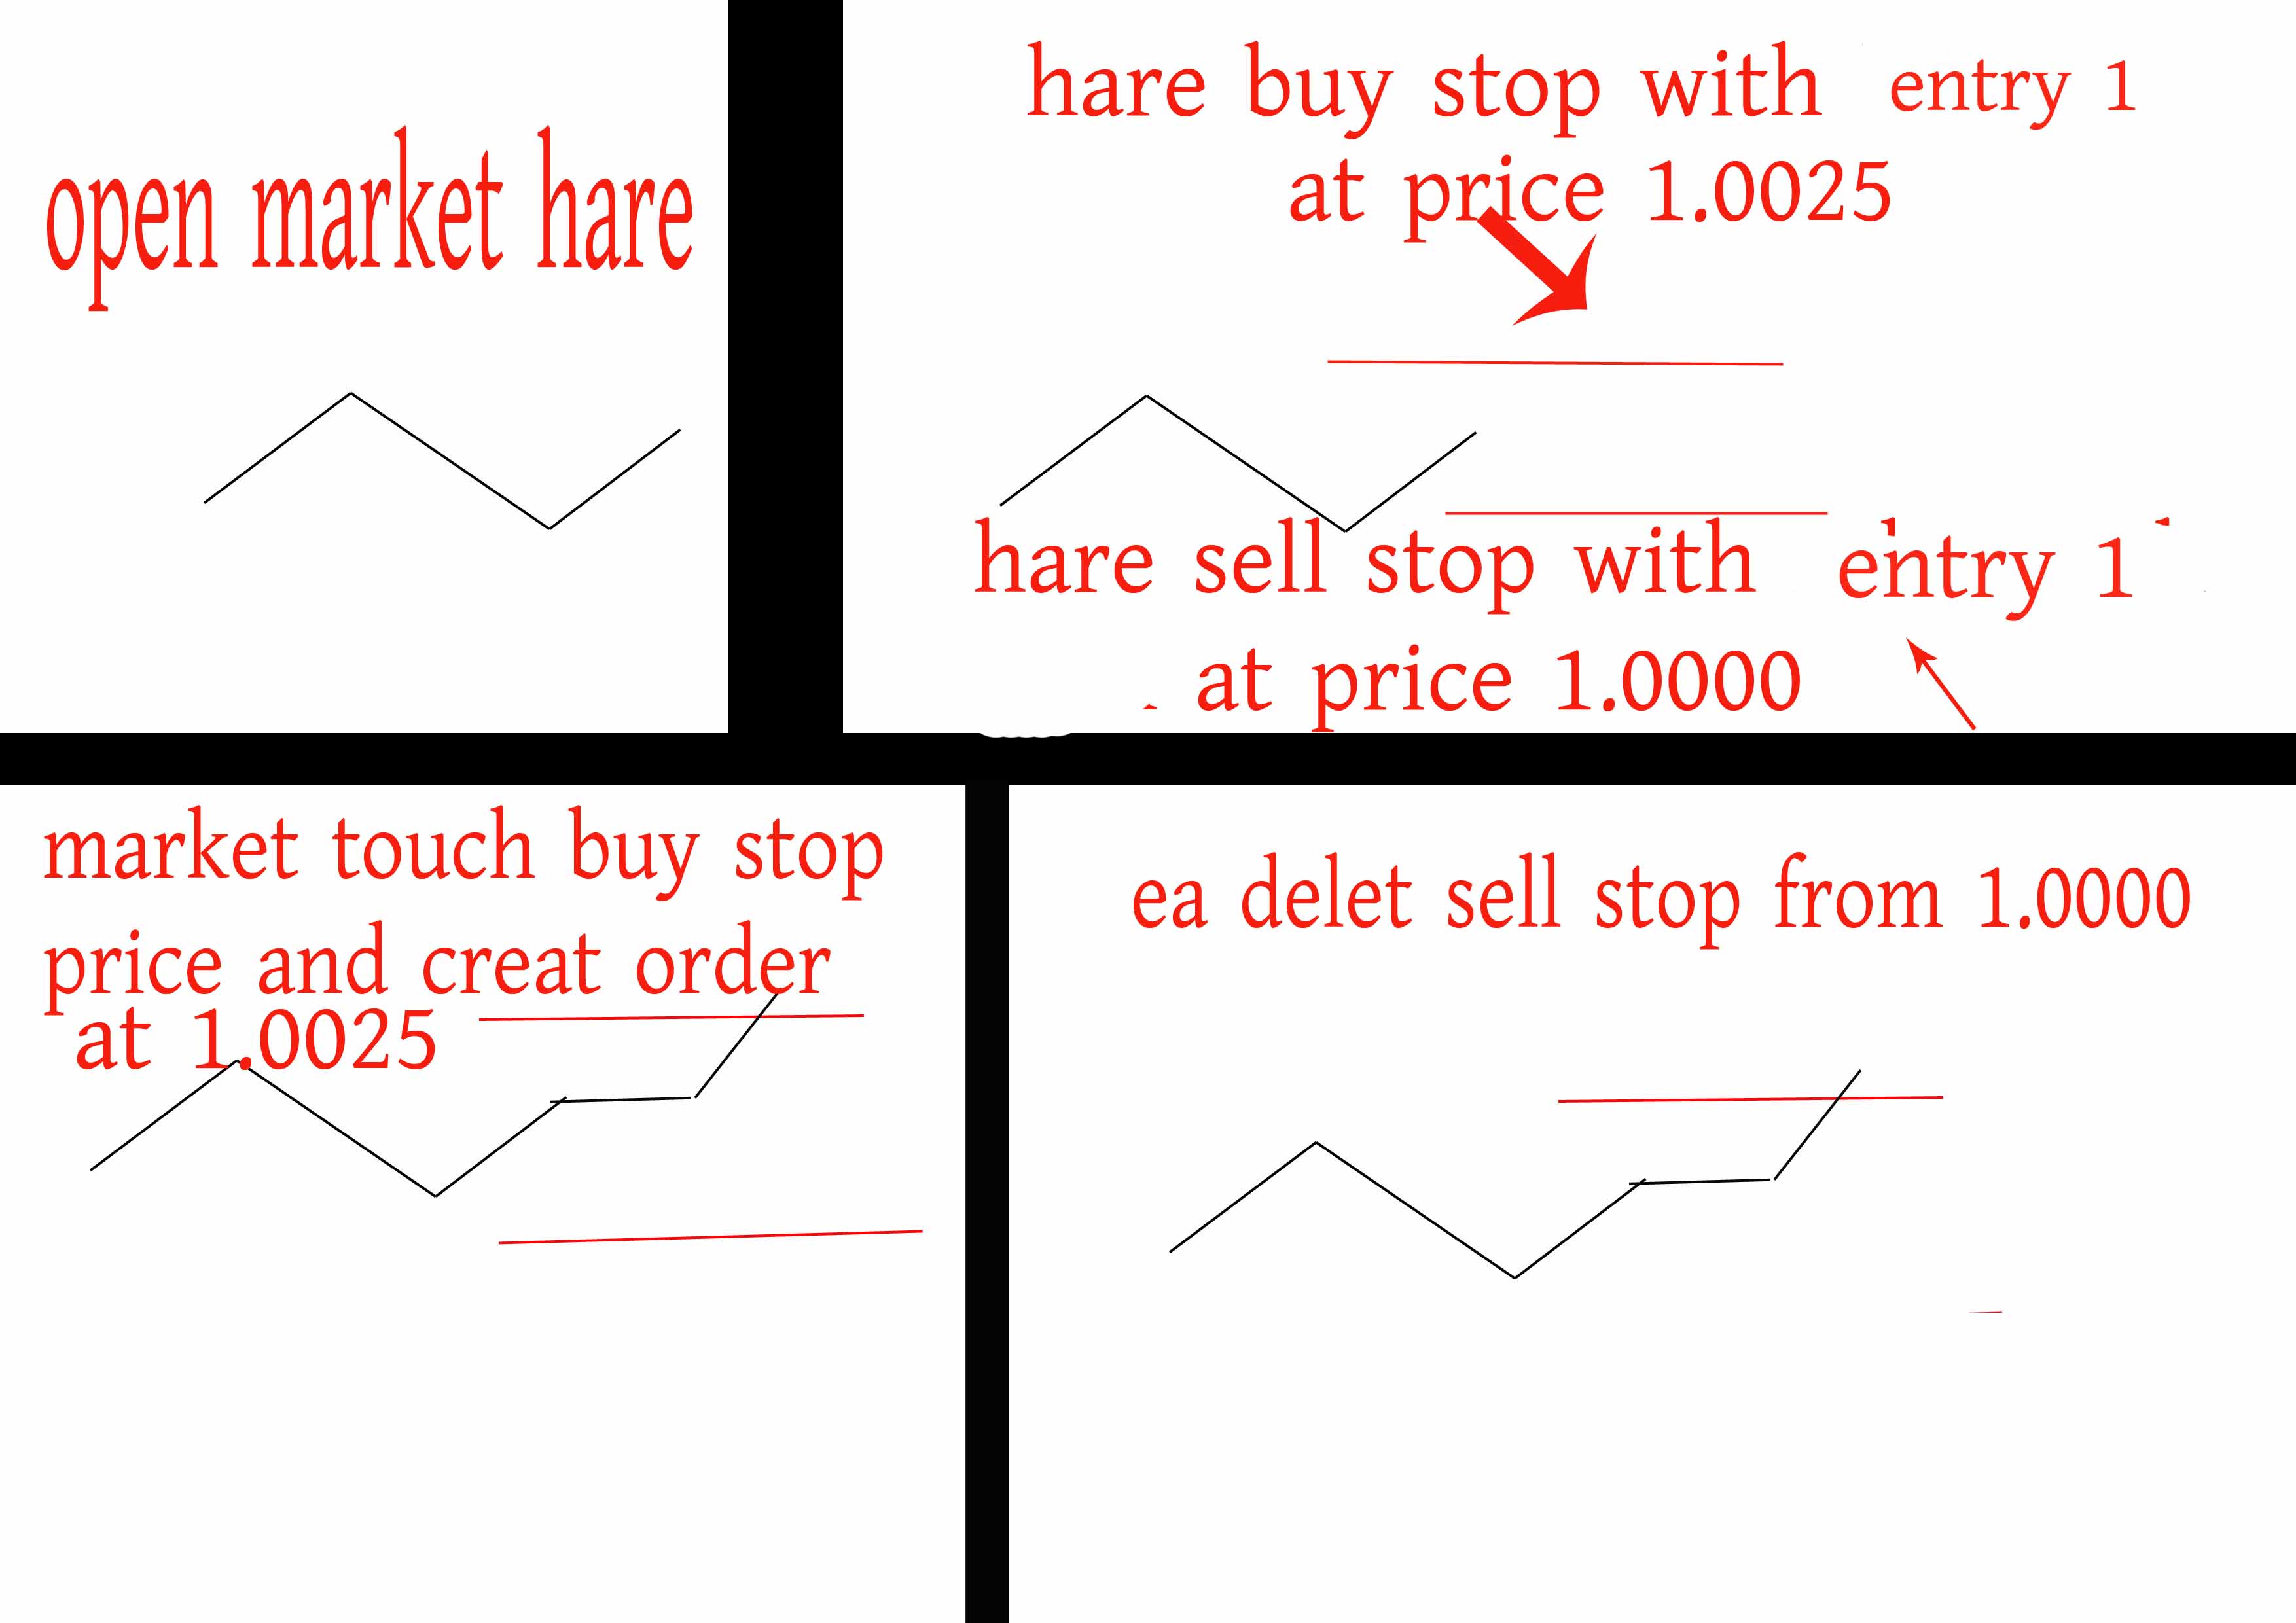
Differ: when I start ea, only this time ea put two pending entry , and I place thich price  manually . follow my picture.


Example: now market price at 1.0010 . I put ea on my chart. And manually give price for buy stop with entry 1 at 1.0025 and for sell stop with entry 1 at 1.0000.


If market touch sell stop and open sell entry, then delet buystop entry. And start from hare .

Example I put ea on my chart with manual buystop at 1.0025  and sellstop at 1.0000 price.


Market touch 1.0025 and open buy with entry 1. Ea delet that sell stop entry.

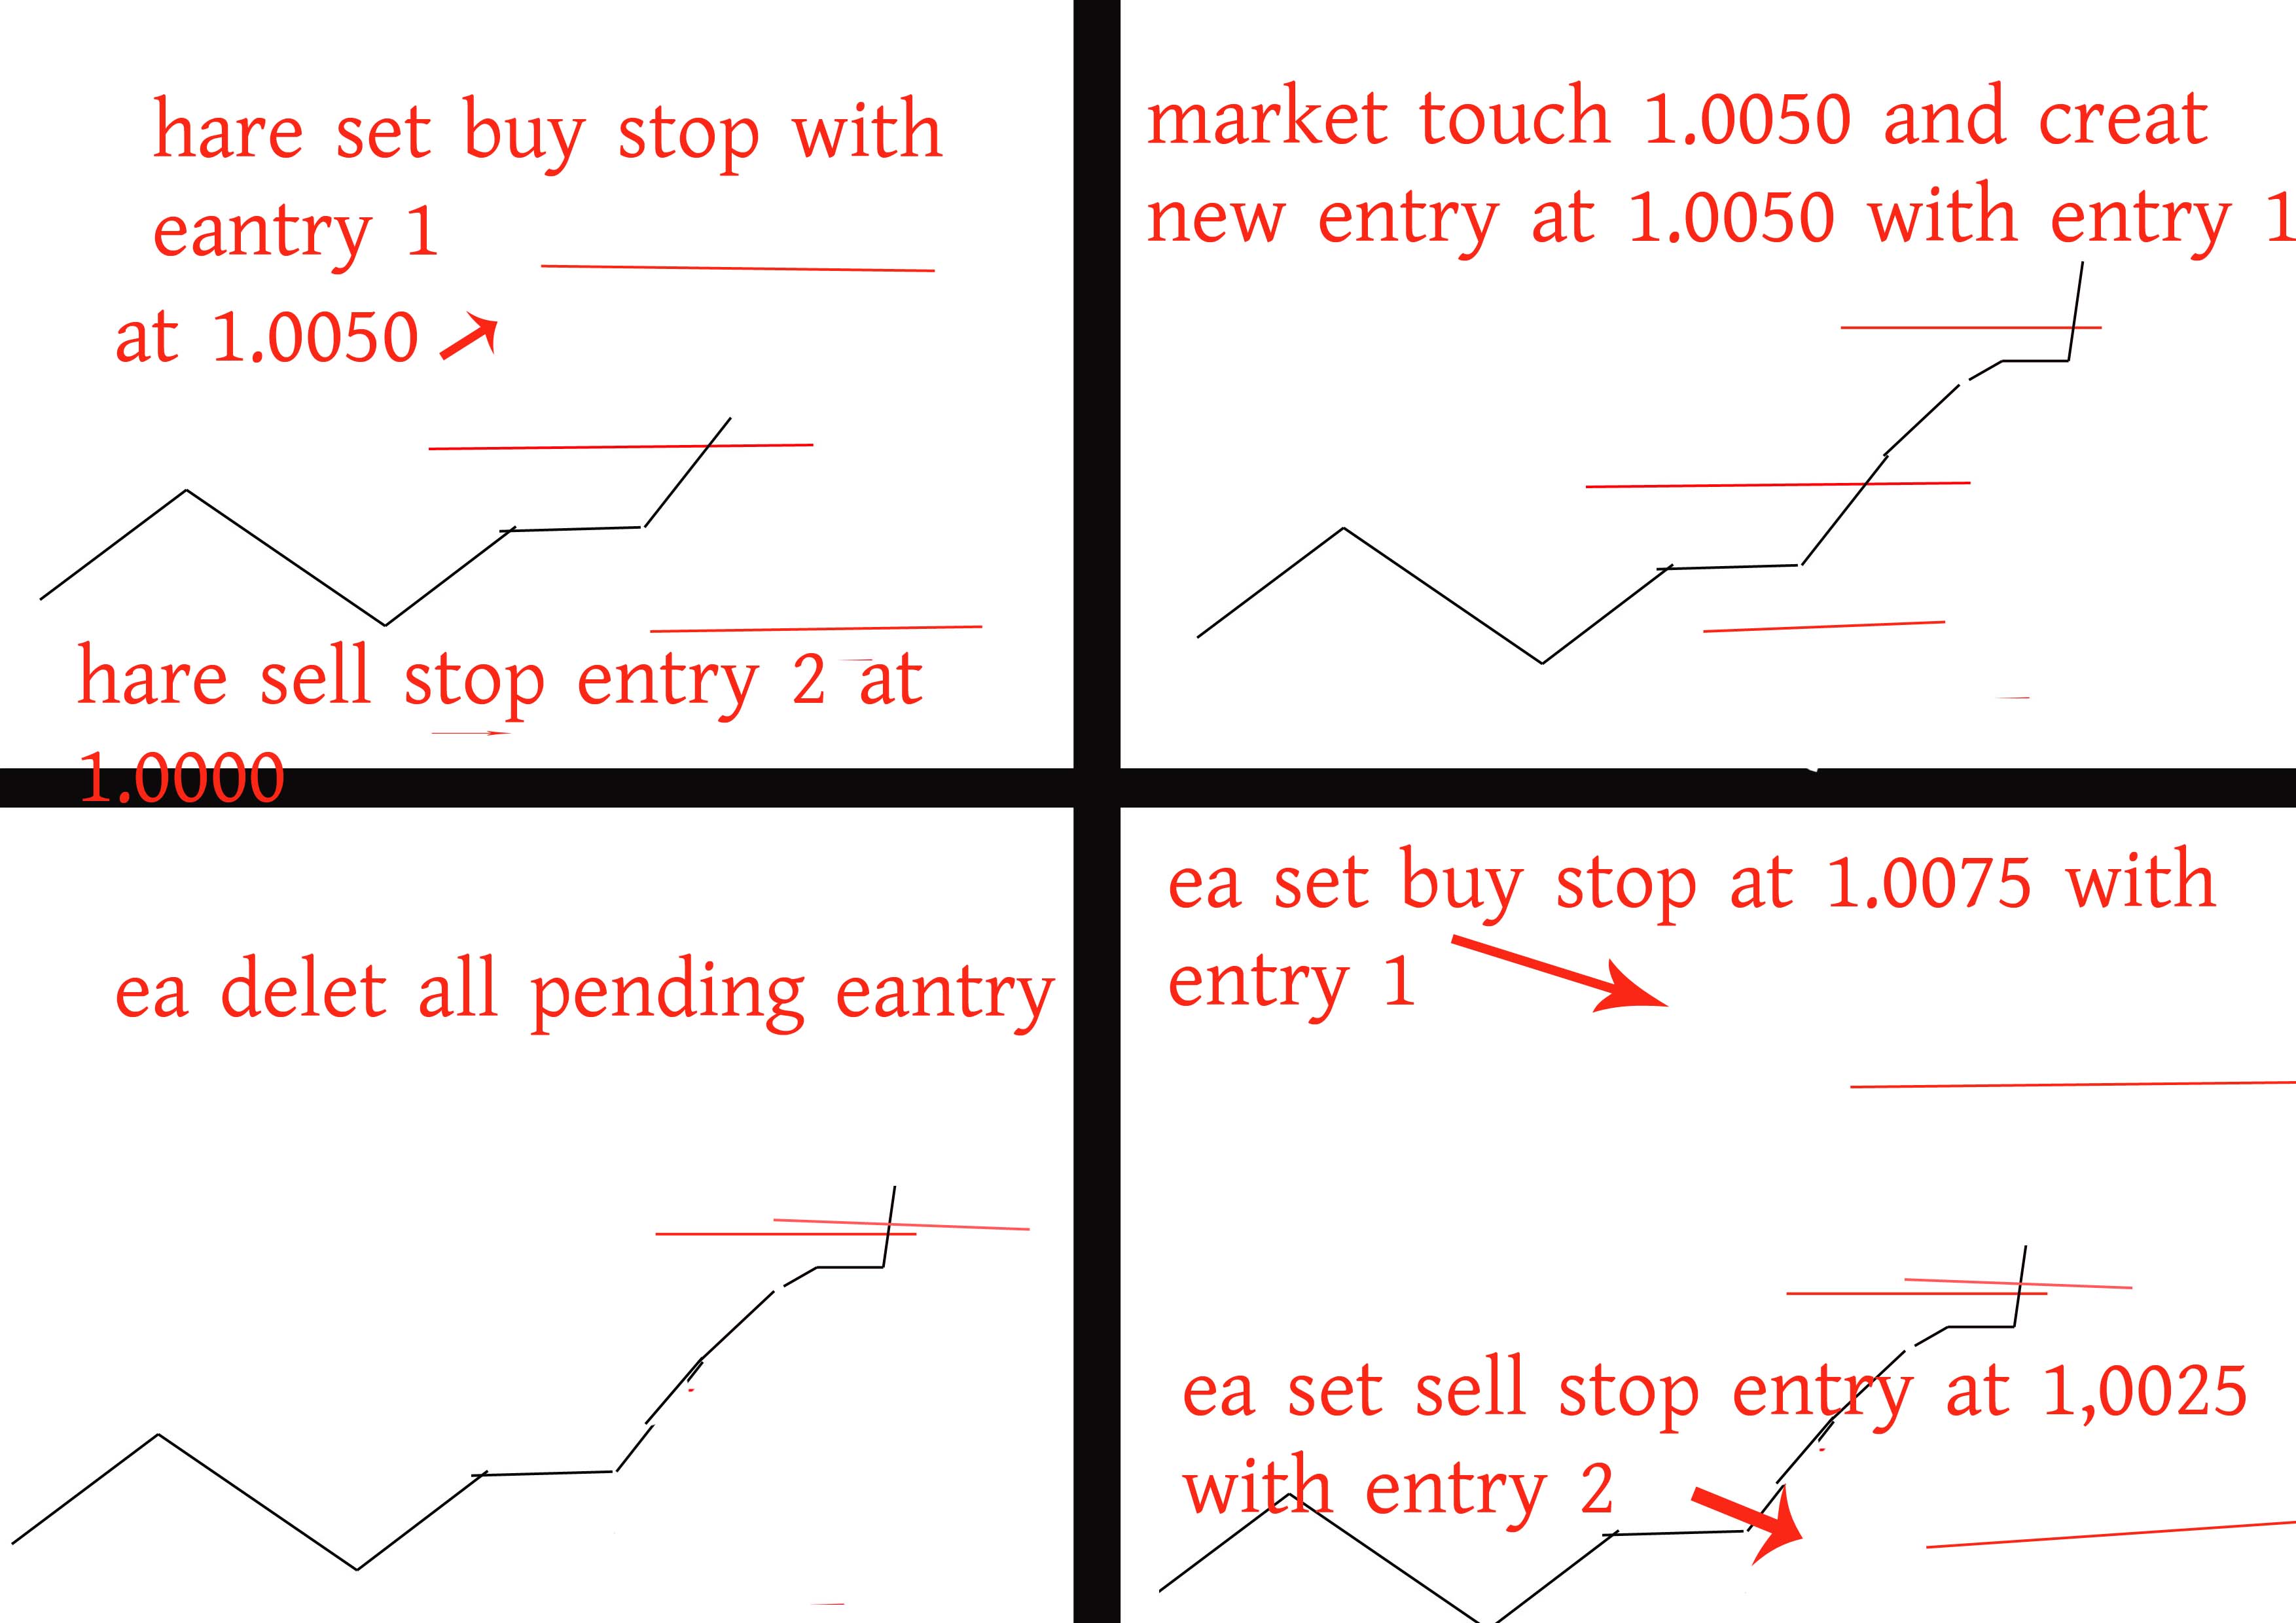
Now ea creat again two pending entry with 25 pips gaps.

Now ea put buy stop with entry 1 at 1.0050. and sell stop with entry 2 at 1.0000.


If market move up and touch 1.0050 , that buystop entry open, and ea delet that sell stop entry. If market move same to up, ea do this again and again.


                                1.0075(entry 1)


                1.0050(entry 1)

1.0025(entry 1)


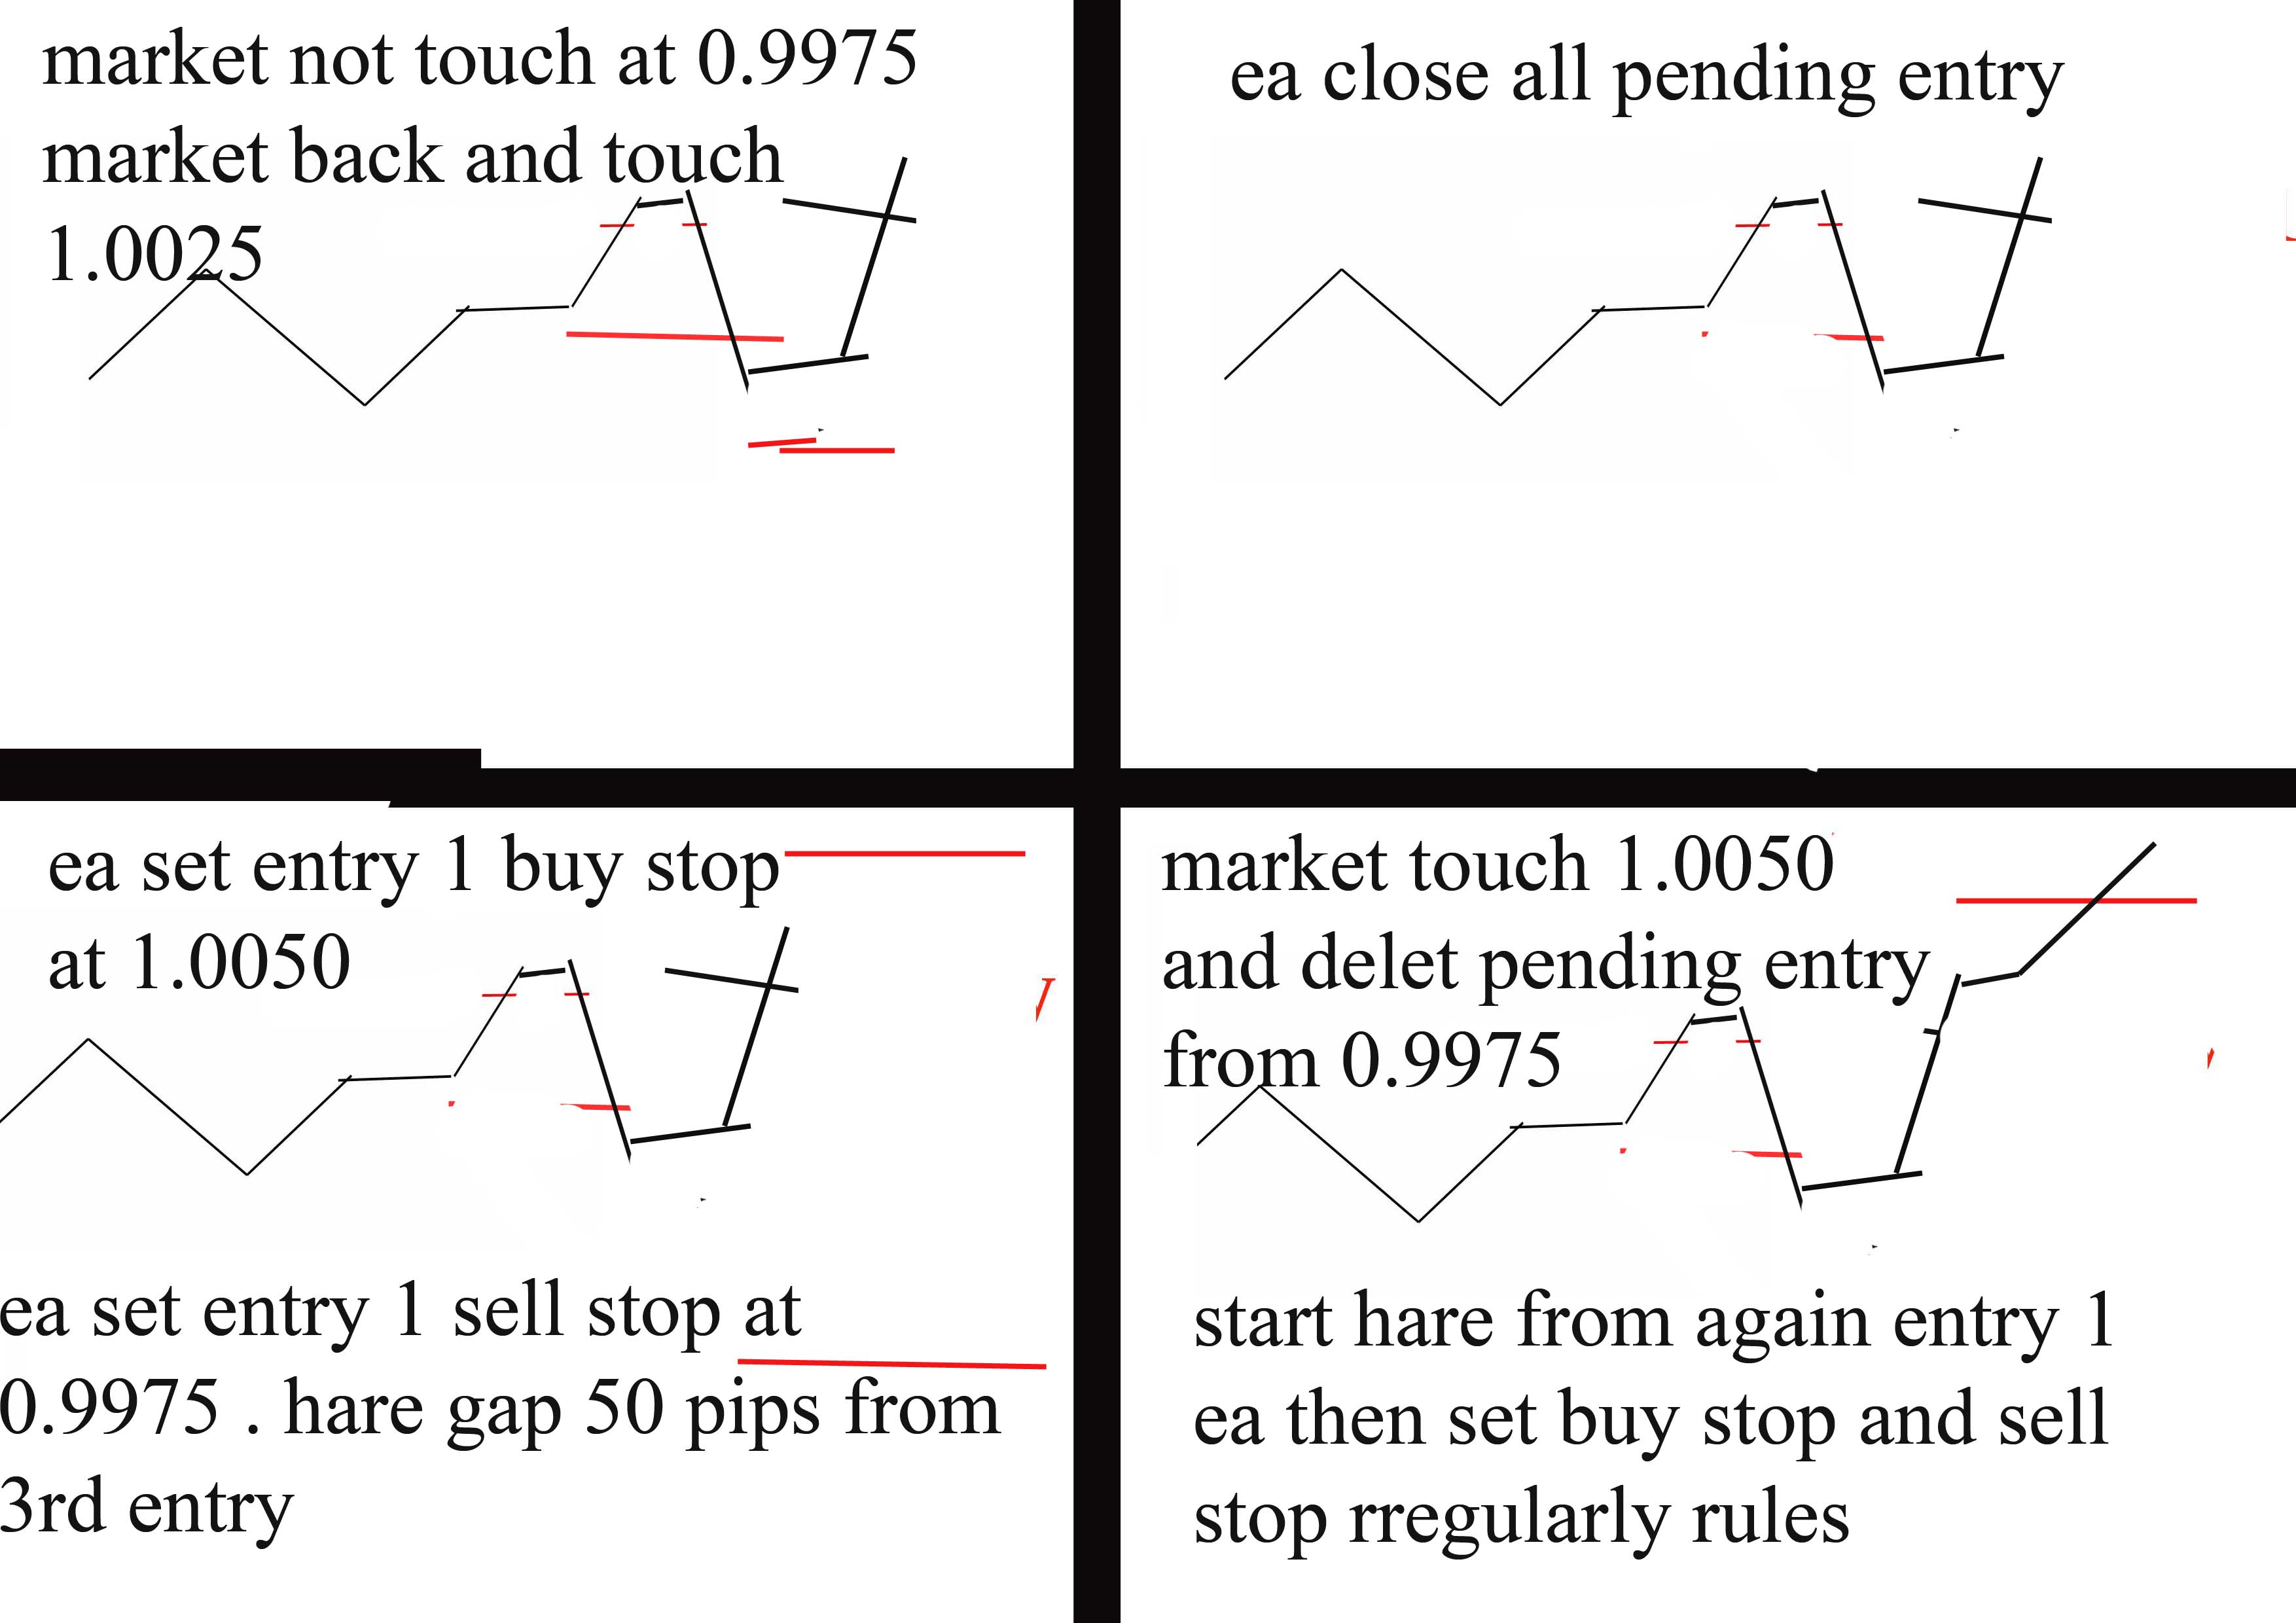
Otherwise , if  market don’t touch 1.0050 and back to entry 2 position (at 1.0000, whare ea creat entry 2 at first) . mean, after open buystop ea pullback to down, and touch 1.0000 . hare open a entry 2.

Now ea delet pending buystop from 1.0050. and open new buystop  entry 3 at 1.0025 , and sell stop entry 1 at 0.9975

              1.0025

                      1.0000

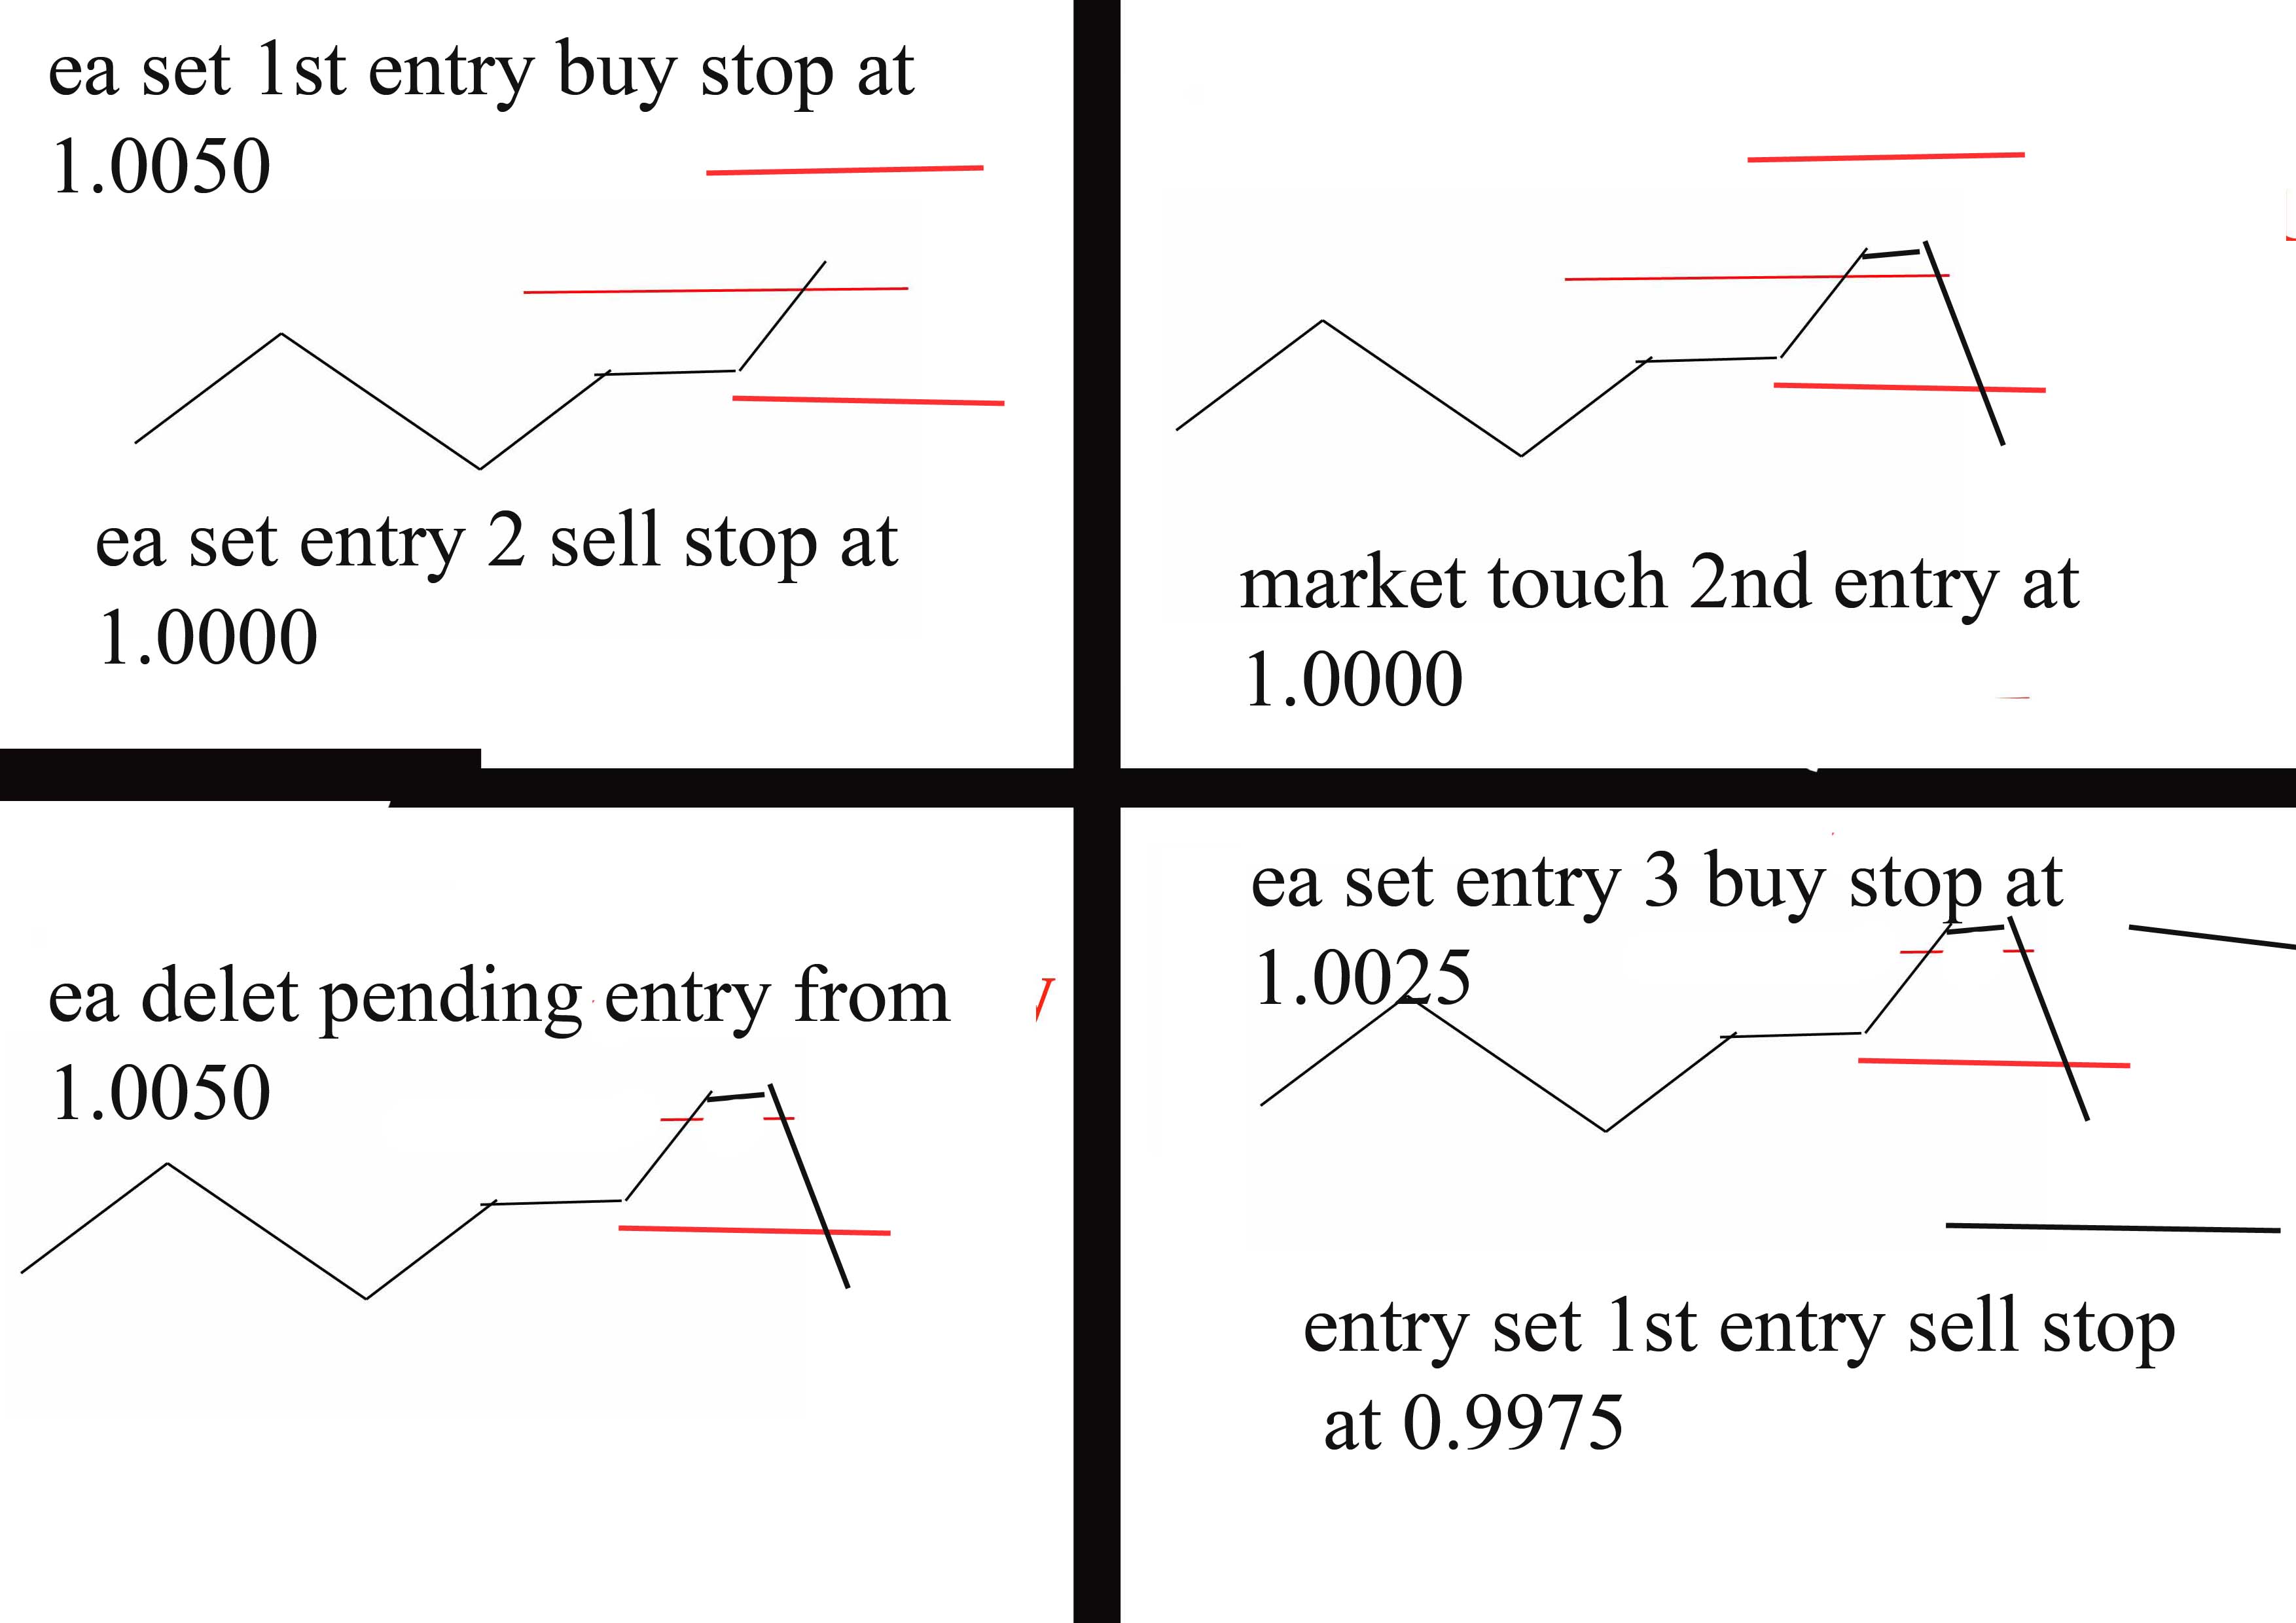
Now if market pull down and touch 0.9975 , mean entry 2 closs and entry 1 open hare. Now ea delet pending buystop entry from 1.0025 . that was entry 3.


1.0025(entry 1)


  1.0000(entry 2)


0.9975(entry 3)


Then again set buystop and sellstop , hare sellstop with entry 1, and buy stop with entry 2.


Though market didn’t move down from 1.0000. mean entry 2 didn’t close with tp, and market touch entry 3 at 1.0025.

                     (Entr y 1)  1.0025             (entry 3)


                                            1.0000(entry 2)

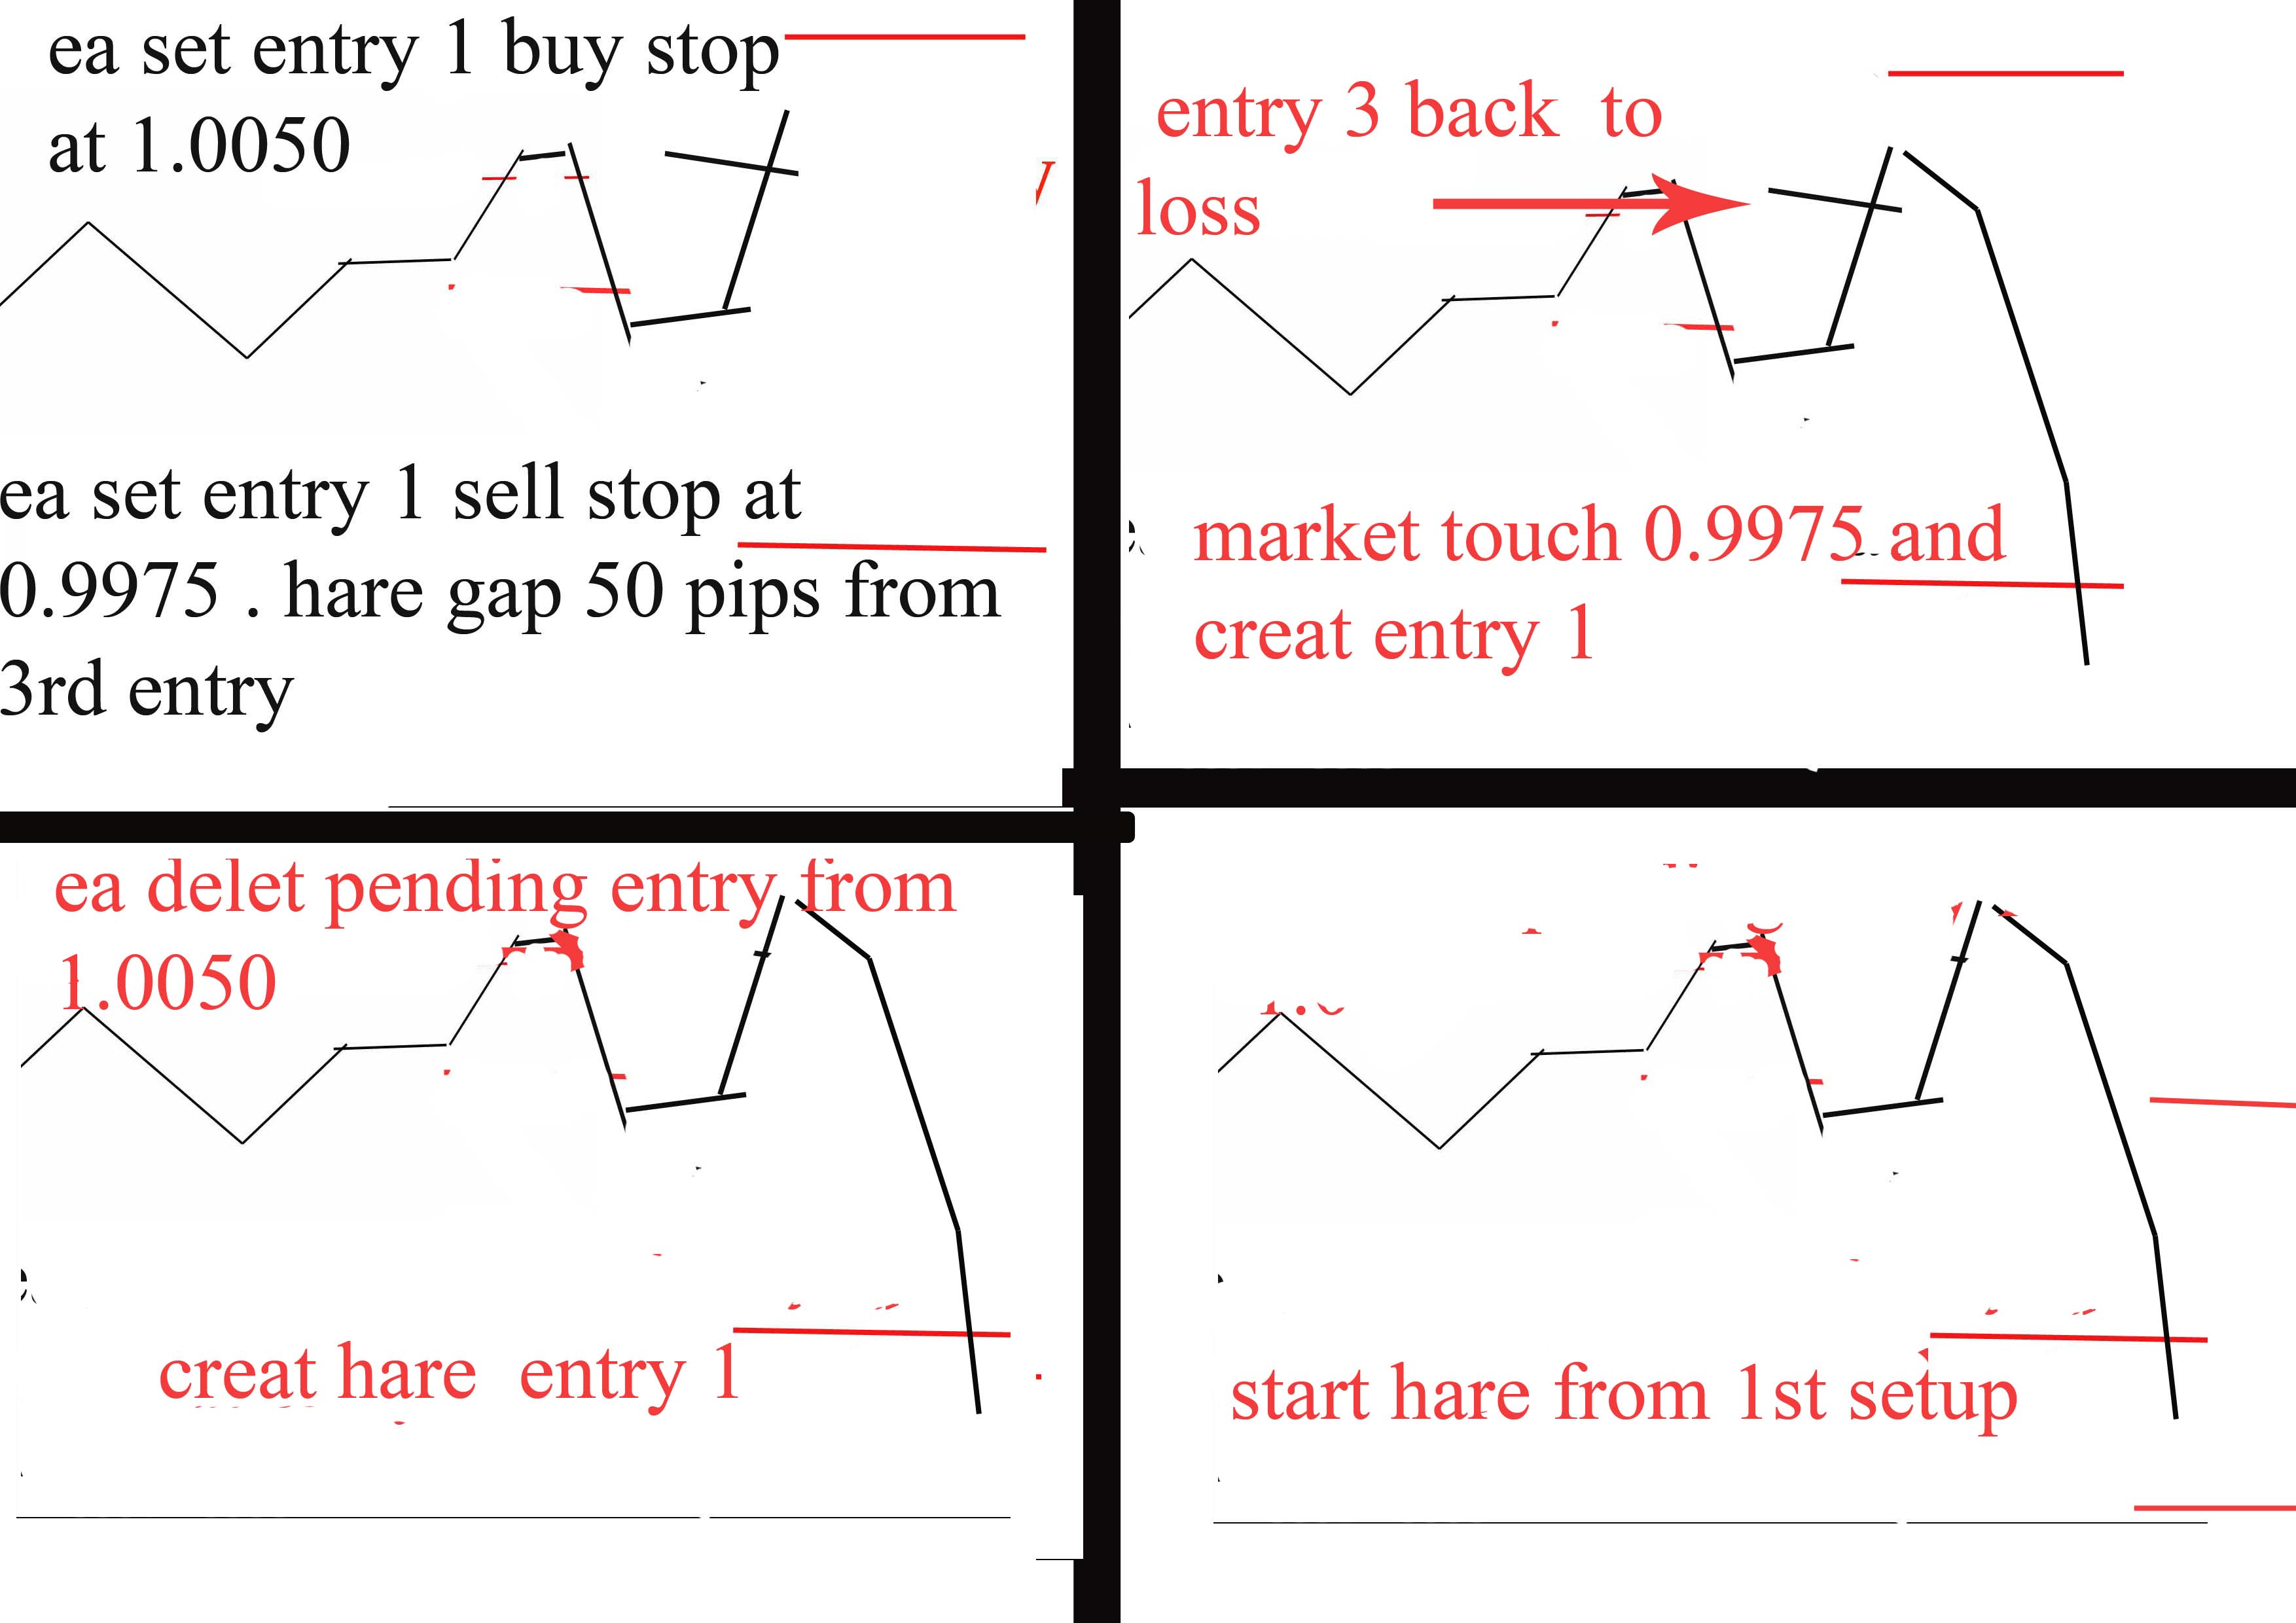
When market touch entry 3 , then ea delet sellstop from 0.9975 . And set buy stop entry at 1.0050, and set sell stop entry 1 at 0.9975 . 

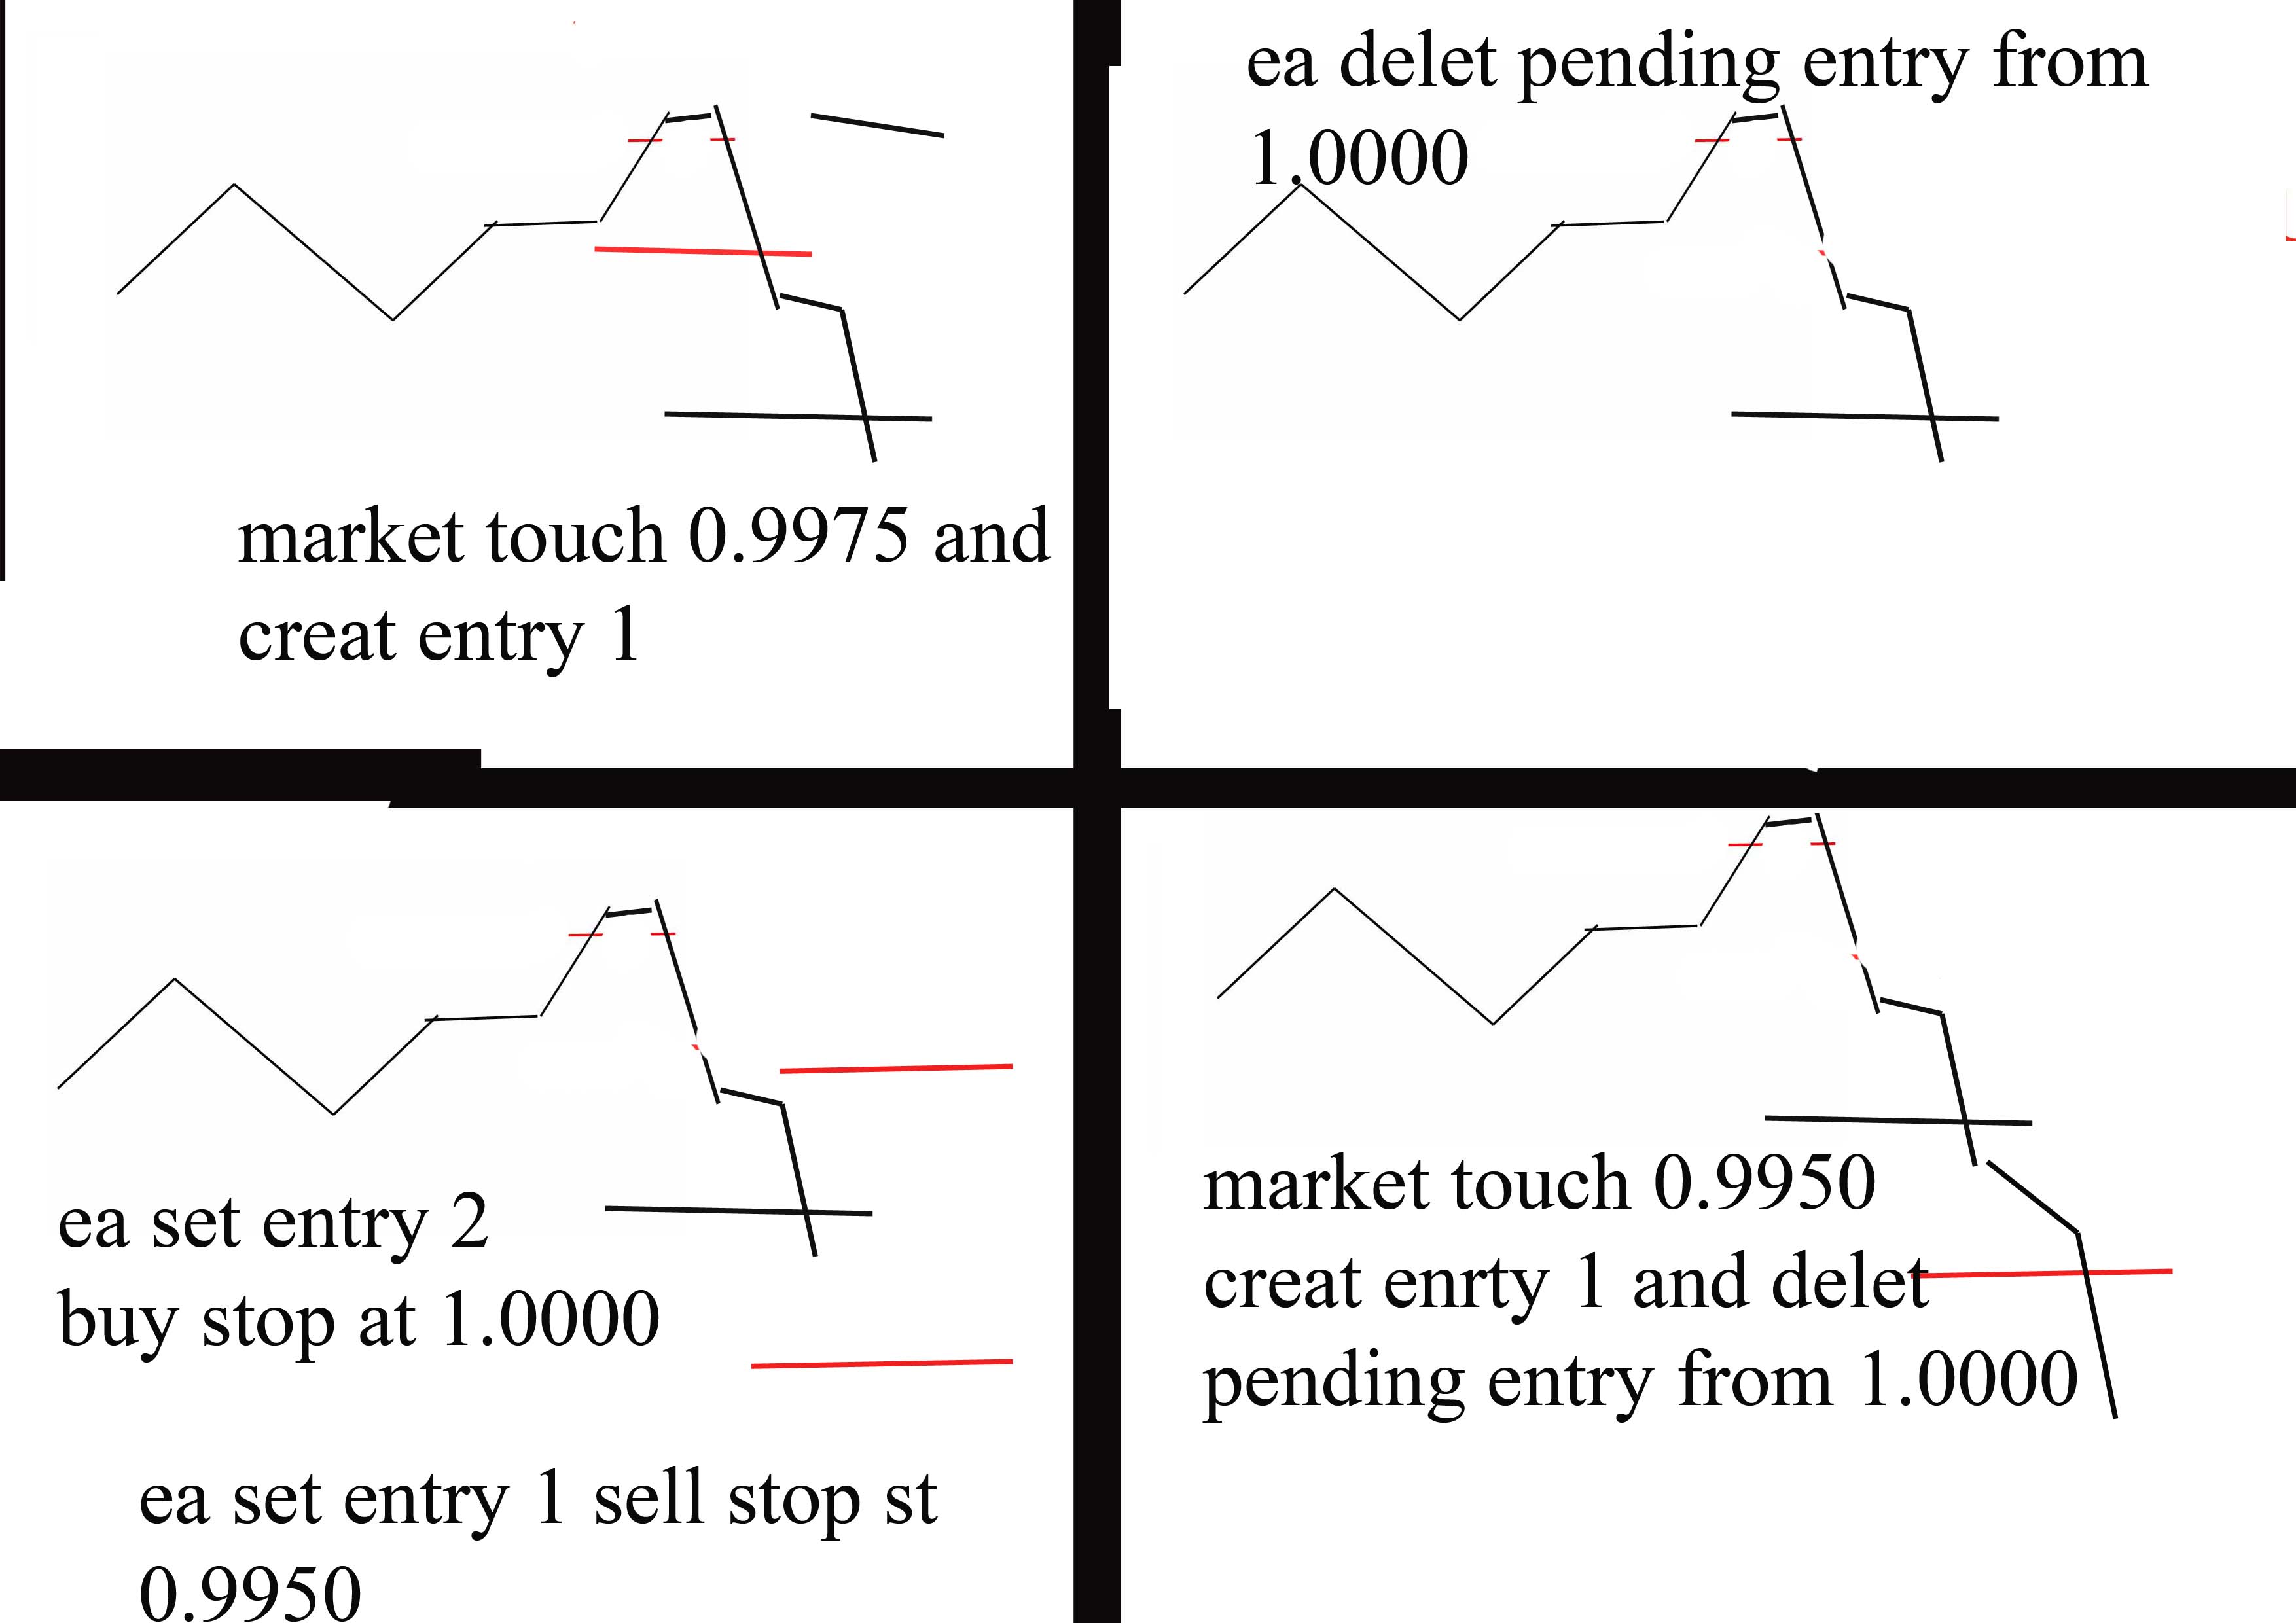
If market touch 1.0050.   entry 3 close with tp, and open entry 1  . then ea delet sell stop from 0.9975. and again set buystop and sellstop , hare sellstop with entry 2, and buy stop with entry 1.

                                     1.0050


1.0025(entry 1)                    (entry 3)


                                  1.0000 (entry 2)

If market didn’t touch 1.0050, and back from entry 3 position 1.0025. and touch 0.9975 , hare close entry 3 with sl and open entry 1.then delet buystop from 1.0050, and again set buystop and sellstop , hare sellstop with entry 1, and buy stop with entry 2.                                          1.0050

                                 1.0025


                                             1.0000

                                                                                        0.9975


Files:

JPG
1.jpg
328.8 Kb
JPG
1-2.jpg
416.5 Kb
JPG
2-1.jpg
359.1 Kb
JPG
2-2.jpg
374.9 Kb
JPG
3-1.jpg
441.5 Kb
JPG
3-2.jpg
405.9 Kb

Responded

1
Developer 1
Rating
(390)
Projects
416
30%
Arbitration
74
19% / 72%
Overdue
52
13%
Working
2
Developer 2
Rating
(217)
Projects
369
33%
Arbitration
34
41% / 29%
Overdue
108
29%
Free
Published: 1 code
3
Developer 3
Rating
(314)
Projects
561
35%
Arbitration
81
31% / 44%
Overdue
204
36%
Working
4
Developer 4
Rating
(298)
Projects
477
40%
Arbitration
105
40% / 24%
Overdue
81
17%
Loaded
Published: 2 codes
5
Developer 5
Rating
(65)
Projects
71
30%
Arbitration
8
0% / 88%
Overdue
5
7%
Free
6
Developer 6
Rating
Projects
0
0%
Arbitration
0
Overdue
0
Free
7
Developer 7
Rating
(271)
Projects
553
50%
Arbitration
57
40% / 37%
Overdue
227
41%
Working
8
Developer 8
Rating
(18)
Projects
27
15%
Arbitration
7
0% / 86%
Overdue
5
19%
Free
Similar orders
Sierra Chart Alerts to MT5 via Webhook (Alert Manager File Version) Objective: Create a Custom Study (ACSIL / C++) that monitors alerts from the Alert Manager file and forwards any valid alert directly to MT5 via an HTTP POST (Webhook) in JSON format. Additional Note: The study should allow adding any modifications in the future and provide clear insights into the alert points in Sierra Chart. 1. Data Flow Diagram
ZigZag based on oscillators is needed The idea of ​​the indicator Create a ZigZag indicator, which is constructed based on extreme values determined using oscillators. It can use any classical normalized oscillator, which has overbought and oversold zones. The algorithm should first be executed with the WPR indicator, then similarly add the possibility to draw a zigzag using the following indicators: CCI Chaikin RSI
I am looking for an experienced MQL4/MQL5 developer to build a custom MT4 indicator from scratch or cracking my ex4 file that i provide to you. I already have an existing indicator (EX4) which produces highly accurate buy/sell signals. I want a similar indicator developed based on its observable behavior and signal structure. my existing indicator is pc id protected so you have to do PC ID security bypass and source
RSI indicator 130 - 150 USD
The Relative Strength Index (RSI) is a technical momentum indicator measuring the speed and change of price movements, scaled from 0 to 100 to identify overbought (>70) or oversold (<30) conditions. Developed by J. Welles Wilder Jr., it helps traders spot potential trend reversals or corrections.Imagine a stock, XYZ, is trending upwards.Overbought Signal: The price increases sharply, and the RSI rises to 75. This

Project information

Budget
30 - 40 USD
Deadline
from 1 to 2 day(s)