How to Start with Metatrader 5 - page 43
You are missing trading opportunities:
- Free trading apps
- Over 8,000 signals for copying
- Economic news for exploring financial markets
Registration
Log in
You agree to website policy and terms of use
If you do not have an account, please register
Forum on trading, automated trading systems and testing trading strategies
Press review
newdigital, 2014.06.05 09:41
USDCHF Breakout Hindered by 200-Day Moving Average (adapted from dailyfx article)
The 200-Day Simple Moving Average
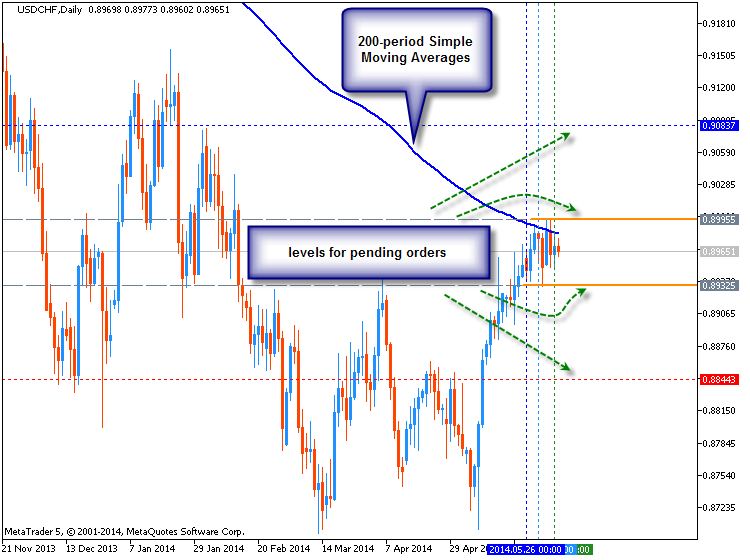
The 200-Day Simple Moving Average is one of the most popular indicators in the world. When price breaks through a 200 MA on a daily chart, it can often be seen as a topic of conversation on financial news stations, websites and newspapers.
It is primarily used to give traders and investors an overall sense of how strong or weak a currency pair is.
Typically, when a currency pair’s price falls below the 200 Day MA, it is a sign of weakness with a potential for further price decline. And when a currency pair’s price breaks above the 200 Day MA, it is a sign of strength with a potential for further price increases.
The chart above shows the recent price action surrounding the 200 Day MA. We see a large run up in price breaking through multiple resistance levels until it met this powerful MA line. We have had 6 consecutive days where price has temporarily broke through the 200 Day MA or price has come within 10 pips of the line before retreating lower. So this level is acting as strong resistance.
If price were to remain below the MA, it could propel it lower back into the pair’s price channel. However, a breakout to the upside could add yet another reason to buy the USDCHF. Until we witness a larger price move, we are in a state of limbo.
Forum on trading, automated trading systems and testing trading strategies
Press review
newdigital, 2014.06.06 09:25
3 Steps to Trade Major News Events (based on dailyfx article)
Talking Points:
- News releases can be stressful on traders
- Develop a plan before the event arrives
Major news releases can be stressful on traders. That stress can show up for a variety of trading styles.Perhaps you are already in a good position with a good entry and you are afraid the news release may take a bite out of your good entry.
Perhaps you want to enter into a new position as prices are near a technically sound entry point, but you are uncertain if the technical picture will hold up through the volatile release. Therefore, you agonize over the decision of whether to enter now or after the news event.
Maybe, you like to be in the action and initiating new positions during the release. The fast paced volatility during the news release still gets makes your palms sweat as you place trades.
As you can see, news events stress traders in a variety of ways.
Today, we are going to cover three steps to trade news events.
Step 1 - Have a Strategy
It sounds simple, yet the emotion of the release can easily draw us off course. We see prices moving quickly in a straight line and are afraid to miss out or afraid to lose the gains we have been sitting on. Therefore, we make an emotional decision and act.
Having a strategy doesn’t have to be complicated. Remember, staying out of the market during news and doing nothing is a strategy.
A strategy for the trader with a floating profit entering the news event could be as simple as “I am going to close off half my position and move my stop loss to better than break even.”
For the trader wanting to initiate a new position that is technically based, they may decide to wait until at least 15 minutes after the release, then decide if the set-up is still valid.
The active news trader may realize they need a plan of buy and sell rules because they trade based on what ‘feels good.’
Step 2 - Use Conservative Leverage
If you are in the market when the news is released, make sure you are implementing conservative amounts of leverage. We don’t know where the prices may go and during releases, prices tend to move fast. Therefore, de-emphasize the influence of each trade on your account equity by using low amounts of leverage.
Our Traits of Successful Traders research found that traders who implement less than ten times effective leverage tend to be more profitable on average.
3 - Don’t Deviate from the Strategy
If you have taken the time to think about a strategy from step number one and if you have realized the importance of being conservatively levered, then you are 90% of the way there! However, this last 10% can arguably be the most difficult. Whatever your plan is, stick to it!
If I put together a plan to lose 20 pounds of body weight that includes eating healthier and exercising, but I continue to eat high fat and sugar foods with limited exercise, then I am only setting myself up for frustration.
You don’t have to be stressed or frustrated through fundamental news releases.
Forum on trading, automated trading systems and testing trading strategies
Discussion of article "Time Series Forecasting Using Exponential Smoothing"
newdigital, 2014.06.06 21:48
Becoming a Fearless Forex Trader
- Must You Know What Will Happen Next?
- Is There a Better Way?
- Strategies When You Know That You Don’t Know
“Good investing is a peculiar balance between the conviction to follow your ideas and the flexibility to recognize when you have made a mistake.”-Michael Steinhardt
"95% of the trading errors you are likely to make will stem from your attitudes about being wrong, losing money, missing out, and leaving money on the table – the four trading fears"
-Mark Douglas, Trading In the Zone
Many traders become enamored with the idea of forecasting. The need for forecasting seems to be inherent to successful trading. After all, you reason, I must know what will happen next in order to make money, right? Thankfully, that’s not right and this article will break down how you can trade well without knowing what will happen next.
Must You Know What Will Happen Next?
While knowing what would happen next would be helpful, no one can know for sure. The reason that insider trading is a crime that is often tested in equity markets can help you see that some traders are so desperate to know the future that their willing to cheat and pay a stiff fine when caught. In short, it’s dangerous to think in terms of a certain future when your money is on the line and best to think of edges over certainties when taking a trade.
The problem with thinking that you must know what the future holds for your trade, is that when something adverse happens to your trade from your expectations, fear sets in. Fear in and of itself isn’t bad. However, most traders with their money on the line, will often freeze and fail to close out the trade.
If you don’t need to know what will happen next, what do you need? The list is surprisingly short and simple but what’s more important is that you don’t think you know what will happen because if you do, you’ll likely overleverage and downplay the risks which are ever-present in the world of trading.
- A Clean Edge That You’re Comfortable Entering A Trade On
- A Well Defined Invalidation Point Where Your Trade Set-Up No Longer
- A Potential Reversal Entry Point
- An Appropriate Trade Size / Money Management
Is There a Better Way?Yesterday, the European Central Bank decided to cut their refi rate and deposit rate. Many traders went into this meeting short, yet EURUSD covered ~250% of its daily ATR range and closed near the highs, indicating EURUSD strength. Simply put, the outcome was outside of most trader’s realm of possibility and if you went short and were struck by fear, you likely did not close out that short and were another “victim of the market”, which is another way of saying a victim of your own fears of losing.
So what is the better way? Believe it or not, it’s to approach the market, understanding how emotional markets can be and that it is best not to get tied up in the direction the market “has to go”. Many traders will hold on to a losing trade, not to the benefit of their account, but rather to protect their ego. Of course, the better path to trading is to focus on protecting your account equity and leaving your ego at the door of your trading room so that it does not affect your trading negatively.
Strategies When You Know That You Don’t Know
There is one commonality with traders who can trade without fear. They build losing trades into their approach. It’s similar to a gambit in chess and it takes away the edge and strong-hold that fear has on many traders. For those non-chess players, a gambit is a play in which you sacrifice a low-value piece, like a pawn, for the sake of gaining an advantage. In trading, the gambit could be your first trade that allows you to get a better taste of the edge you’re sensing at the moment the trade is entered.
James Stanley’s USD Hedge is a great example of a strategy that works under the assumption that one trade will be a loser. What’s the significance of this? It pre-assumes the loss and will allow you to trade without the fear that plagues so many traders. Another tool that you can use to help you define if the trend is staying in your favor or going against you is a fractal.
If you look outside of the world of trading and chess, there are other businesses that presume a loss and therefore are able to act with a clear head when a loss comes. Those businesses are casinos and insurance companies. Both of these businesses presume a loss and work only in line with a calculated risk, they operate free of fear and you can as well if you presume small losses as part of your strategy.
Another great Mark Douglas quote:
“The less I cared about whether or not I was wrong, the clearer things became, making it much easier to move in and out of positions, cutting my losses short to make myself mentally available to take the next opportunity.” -Mark Douglas
Happy Trading!
The source
Forum on trading, automated trading systems and testing trading strategies
PriceChannel Parabolic system
newdigital, 2013.02.08 14:35
This is the image about how to use AFL Winner indicator:
Forum on trading, automated trading systems and testing trading strategies
PriceChannel Parabolic system
newdigital, 2013.02.11 06:48
I started to trade this scalping setup but it is not easy for now - market is in flat and we need particular market condition to trade this scalping. Just to see:
Forum on trading, automated trading systems and testing trading strategies
Scripts: Drag and Drop Support and Resistance lines with color differentiation
newdigital, 2014.06.11 14:17
Static Support and Resistance in the Forex Market (based on dailyfx article)
- Traders can use support and resistance to grade market conditions, define trends, and enter positions.
- We discuss ‘static’ methods of support and resistance in the below article.
- We delve into pivot points, and psychological support/resistance analysis
One of the first aspects of technical analysis that most new traders learn is the field of support and resistance.After all, if price has hit a floor with which it may have difficulty breaking through (support) or a ceiling with which it may not be able to rise above (resistance); this can offer a plethora of trade ideas and setups.
Unfortunately, most new traders learn one or two ways of identifying support or resistance; and when they see that it doesn’t work all-of-the-time, they abandon such studies in hopes of finding ‘holy grails’ elsewhere.
Well, holy grails don’t really exist. It often takes the new trader some time to learn this lesson the hard way: There is no strategy or approach or indicator that will allow a trader to always win, no matter how strong the analytical method being employed. Rather, trading is about probabilities and attempting to get them on your side or in your favor as much as humanely possible using this analysis.
Support and resistance has a special role in this analysis. It can be used to grade market conditions, determine trends, identify entry and exit points along with a bevy of other options.
Pivot Points
This is one of the more common mannerisms of identifying support and resistance, and it’s also one of the oldest. Pivot points originated before computers became common in financial markets as floor traders need a quick and easy way to see if prices were ‘cheap’ or ‘expensive.’
So these floor traders developed a short-hand manner of getting support (cheap) and resistance (expensive) levels.
These floor traders would take the previous day’s high, low, and closing prices and would average these
values together to find the ‘pivot’ for the next trading day. Price action trading above this pivot would be ‘bullish’ while prices below would be ‘bearish.’
While this is fine and good, it doesn’t tell us much about support or resistance yet; so to take this a step further, traders would then multiply the pivot by two, and would then subtract the previous day’s low to get the first level of resistance (R1). They can then do the same to find the first level of support (S1), multiplying the pivot value times two and then subtracting the previous day’s high.
After the R1 and S1 values are solved, traders can then move on to the next levels of support and resistance. To find the second level of resistance (R2), traders can add the pivot value to the difference between R1 and S1; and the second level of support could be found by subtracting the difference between R1 and S1 from the pivot value. The full equation is below:
As you can see from the equation, pivot points use very basic math to find potential support and resistance levels. Luckily for traders, most charting packages will automatically do this math for us while plotting the support and resistance levels at appropriate intervals.
Pivot Points can be generated for a variety of time frames, and the longer-term pivots will often work best as more traders may be seeing and reacting to those levels.
As with most forms of technical analysis, the longer the term being used in the analysis the stronger the response that may be elicited. Pivot points of monthly and weekly flavors will often attract significant interest, and should be followed by traders even if using shorter-term hourly and four-hour charts.
Monthly and Weekly Pivot Points can bring value on long as well as short time frames
Psychological Levels
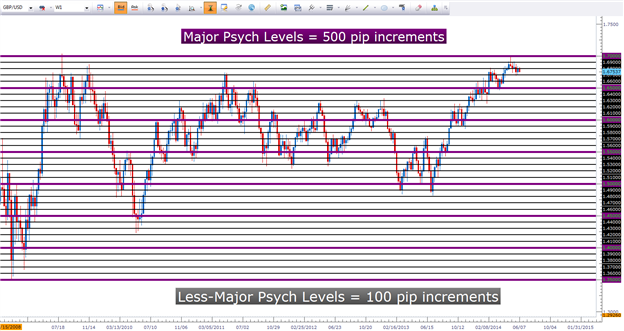
One of the most alluring aspects of technical analysis is the ability of statistics and mathematics to show patterns in human behavior. Nowhere is this more prominent than in the study of ‘psychological’ levels in financial markets.
Most human beings think in even rounded whole numbers. We can’t help it; our species has evolved to value simplicity. As an example, ask someone how much they paid for their car or their jacket, or even their latte.
They’ll likely round their answer up (or down) to the nearest round number. This type of rounding will often happen in markets as well; as traders place their stops or entry orders at or around these levels in the same way that most human beings will respond when asked how much they paid for their coffee.
GBPUSD Weekly chart with ‘Major,’ and ‘Less Major’ levels identified
As you can see, these levels can come up quite often in a market, particularly during strong trends as new prices run into fresh resistance levels (or support levels in the case of a down-trend).
This study of support and resistance can be taken a step further with the ‘minor’ prices that are set in 25-pip increments; known as the ‘minor’ psychological levels. In the chart below, we’ve moved down to the hourly chart in the same market looked at above (GBPUSD) with the addition of these more granular ‘minor’ levels:
Hourly GBPUSD with Minor psychological levels added (25-pip increments)
With psychological levels taking place every 25 pips, there are numerous opportunities for traders to ‘catch swings’ in a market.
To put more power behind psychological levels or pivot points, traders can look for confluence amongst these analytical methods; including the dynamic support and resistance mechanisms that we’ll investigate in our next installment.
Forum on trading, automated trading systems and testing trading strategies
Indicators: ZZ_Ensign_Fibo
newdigital, 2014.06.13 07:43
The Rabbit Hole of Fibonacci (adapted from this article)- We look at the history and background of the mathematical concept known as ‘The Fibonacci Sequence’
- We show you how traders can apply these mathematical studies to their trading.
In this article, we’re going to look at a more subjective form of Support and Resistance analysis: We’re going to investigate Fibonacci. In our next three pieces, we’ll take all of these support and resistance mechanisms and we’ll show you how traders can actually put them to use.Fibonacci
This is one of the more in-depth support and resistance methods out there, and there are a lot of different ways that traders look to integrate Fibonacci in their trading.
Taking a step back, Fibonacci is named after the 12th century mathematician, Leonardo of Pisa. In 1202 AD, Leonardo published a composition with the name of Liber Abaci that consisted of a numerical sequence that eventually became named after him. Leonardo of Pisa didn’t discover the sequence; he merely used it as an example in his composition.
The sequence is thought to have been originally used by Indian mathematicians as early as the 6th century; and in Liber Abaci, this numerical sequence was introduced the western world. The sequence introduced by Leonardo of Pisa was a system that found the next value in the sequence by adding the two previous numbers. The sequence shared in Liber Abaci was as follows:
Today these values are called ‘Fibonacci numbers’ and are used by many traders as input values for indicators along with a slew of other purposes.
But input values on trading indicators aren’t the only place that we’ll see this system at work. The Fibonacci sequence has excited mathematicians and scientists for thousands of years because of its numerous applications in the world around us. One of the initial applications that Leonardo of Pisa investigated in his original manuscript was the population growth of rabbits. He found that as an isolated population of rabbits grew, the population would grow according the Fibonacci sequence. Starting with one pair of rabbits, the population would then grow to two; which would become three, and then five, eight, thirteen, etc. The sequence is also prominent in population growth within honeybees, the number of petals on a flower, and the formation of pine cones just to name a few.
Many believe the Fibonacci sequence to be the language of nature itself. If you want to see more on this topic, Fibonacci was prominently featured as part of the movie Pi; the fictional movie released in 1998 that follows a mathematician’s quest in predicting the future based on mathematics. But even outside of fictional movies, the numerous manners with which the sequence appears in the world around us is fascinating and definitely worthy of a google-search.
But that’s not the only exciting aspect of the Fibonacci sequence. More fascinating is what we can see if we look just a little bit below the surface. If you take the ratio of any two successive numbers, such as 144 and 233 and divide the second number (233) by the first (144), you’ll eventually move towards a very special number of 1.618 (61.8%). In this specific example, the exact value would be ‘1.6180555…’ The deeper we get in the sequence, the closer this ratio moves towards 1.618 until eventually the ratio stands at exactly 1.618. This number is the prize behind Fibonacci, and it has fascinated mathematicians and scientists for thousands of years.
The number of 1.618 is called ‘The Golden Ratio,’ and can be found in numerous applications within nature ranging from the spirals of a sea shell to leaf arrangements of a houseplant.
Trading with Fibonacci (and the Golden Ratio)
Traders will often employ Fibonacci when looking to trade retracements in a trend, centering support and resistance levels around intervals defined by the Golden Ratio of 1.618.
The center of Fibonacci analysis is at the .618 interval of the trend, taken directly from the golden ratio. But we can take this a step further by dividing a number in the sequence by the number located two figures to further. If we take 34 and divide that number by 89; or if we take 133 and divide that by 377, we consistently receive values of ~.382 (38.2%). This is the next value that traders will plot via Fibonacci analysis.
We can then do the same thing with by dividing any number in the sequence with the digit located two places further. So, for example, if we divide 34 by 144; or if we divide 55 by 233, we consistently receive values of ~.236 (23.6%). Traders have taken this a step further to examine the mid-line of the move (.50, or 50%), and .786 (78.6% - or the reciprocal of .236). The finished result is what we have below using the weekly GBPUSD chart:
As you can see in the above chart, these price levels on a chart can exhibit phenomenal examples of support and/or resistance coming in the market place. And luckily for us, using Fibonacci as a trader is significantly easier than proving any ‘magical’ components behind it as mathematicians have attempted to do for the past couple thousand years.
To use Fibonacci, a trader needs to merely identify a most recent ‘major move.’ This is where subjectivity comes in to play. This major move can be on the 5-minute chart, the hourly chart, or the weekly chart (as we had done with GBPUSD above). But like we saw with Pivot Points, longer-terms and more data generally brings more value to the analysis simply because more traders may be seeing it. If we draw a Fibonacci retracement on a 5-minute chart; it might be seen by a few other traders whereas a retracement taken from the weekly chart will likely generate more interest from traders simply because it encapsulates significantly more data.
Traders can use the Fibonacci tool available in most trading platforms to define the move, and then levels at the proper intervals of .236, .382, .500, .618, and .786 can be drawn in. So, when prices move down to the .236 line, we can say that 23.6% of that trend has been retraced. Or if prices move down the .618 level, 61.8% of the trend has been re-traced.
Forum on trading, automated trading systems and testing trading strategies
How to Start with Metatrader 5
newdigital, 2013.07.24 10:00
I just want to remind about how to insert the images to the post - read this small article
=========
MQL5.community - User Memo :
2. Messages Editor
All your texts in Forum, Articles and Code Base are edited in a single environment with a convenient and easy-to-use interface. Let us take a look at its capabilities.
The drop-down list where you can select one of the three languages in which your message will be automatically translated by the Google Translate service.
The button (Ctrl+Alt+L) is used for adding links into messages. The Link window appears as soon as you click this button (shown next).
In the Link field, you should specify the address of the link and then click the Insert button.
The button (Ctrl+Alt+I) is used for inserting pictures into messages. The Image window appears as soon as you click the button (shown next).
In the Upload image field, you should specify the picture file. To do it, click the Browse button that opens the standard window to choose files. Select the necessary file and click the Insert button to confirm the choice, or click the Cancel button to end without uploading a file. In the Title field, you can specify the comment that will be displayed as a pop-up help if you move the mouse cursor over the picture.
In HTML mode, it is prohibited to insert external links to images (HTML tag "src"). It is also prohibited to insert text, containing such images.
When you try to save text that contains external links to images, such links will be automatically deleted. This is done to ensure safety of MQL5.community members.
Forum on trading, automated trading systems and testing trading strategies
Press review
newdigital, 2014.06.19 09:11
How to Scale-In and Scale-Out of Trades (based on dailyfx article)
- Many successful strategies scale in and scale out of positions.
- We should only add-to or partially close winning positions.
- We should place these scaling orders at key levels, not hard set “X” amount of pips.
We spend a lot of time as traders figuring out the best time to get in to and get out of trades, but I'd argue that how we get into trades is just as important. Today we look at scaling in and scaling out of positions, and how it can benefit your current trading strategy.Why Do Traders Scale-In and Scale-Out?
There are many reasons why profitable traders turn to scaling into a position over time. More advanced reasons include to reduce the amount of slippage received when opening a large trade or to hide a large position that you don't want others to know about. But, the most important reason why traders scale into a trade is to enhance their gains on a trade that has already begun to show promise.
It is very obvious that larger trade sizes will result in larger profits when the trade moves in our favor. That makes complete sense. But when we have the ability to start off our trade with a smaller trade size and only add to a trade when its winning, we are able to start off our trade by risking a little and end our trade with the chance to make a lot. So not only to do we enhance our profit potential, we can also reduce our risk by starting with a smaller trade. Only adding to the trade after its profitable.
Scaling out of the trade is a similar idea to scaling in, but in reverse. Rather than letting a trade hit a profit target and close out the entire position, we instead partially close the trade, and let the rest have the opportunity to move further into profitable territory. This secures a profit but also leaves the door open for further gains. It is also common to move your stop loss to break even or beyond when an initial profit target is hit. That way the remaining position you have open is almost "risk-free."
What Type of Trades Can This Method Be Used?
So now that we understand the benefits of scaling in and scaling out of trades, in what situations should we consider it? Well, for starters, we should only look to add to positions that are in profitable territory. We don't want to throw good money after bad if the trade is already proving us wrong. It's best to cut losers short, lest we add fuel to the fire.
We also only want to scale out of positions only when they are profitable as well. There is no reason (other than hope) to partially close out a trade once its proven us wrong. So rather than setting a single profit target for the entire trade, we can set 2 or 3. It's also possible to leave a part of our trade open without a limit at all, and letting an indicator or a trailing stop decide when it should be closed.
Where Do We Add-To or Partially Close Trades?
Using this method is actually much easier than many traders try to make it. The way I look at scaling in is the same way I would look at opening up a single trade, but locating several times where opening up a trade is warranted. Stay away from setting "blind" entries 50, 100, or 200 pips away from our original entry. We want to have just as much reason to add to a trade as we did when we initially opened it.
Take the simple CCI strategy below where we decided to take a buy trade when CCI crossed above -100. This is a classic trade that found itself in a pretty tight range for the next 20-25 bars. There were times when price ran up in our favor; but never a definitive price move that would catch the attention of AUD/USD bulls, until the range was broken and price closed above resistance. This breakout would justify buying the Aussie in its own right. But since we already had a trade, we can simply add to our existing trade.
After we added to our position, we witnessed another "top" creating another resistance level. When the AUD/USD broke this 2nd resistance level, that was another time where we could add to this trade. So it isn't anything too difficult. We just look for opportunities where buy trades look good, and allow those entries to add to our existing trade.
As for scaling out, we want to use the same method as we would normally use to exit trades, but pick multiple levels that fit that criteria. So for the chart below, we can see that we bought on an initial break of a previous high. We then targeted a profit just below the next potential resistance level and then targeted an exit just below the resistance level after that. So rather than taking a quick profit on our entire trade at the first resistance level, we were able to let part of the trade run and obtain greater profits.
Scaling for Success
So we understand that our strategies' trading logic is important, but so is how we enter and exit our trades. Scaling in and scaling out can enhance our gains but also at times reduce our risk. Using the methods above can improve your strategy, but remember to perform your own due diligence before placing any trades on your own account.
Forum on trading, automated trading systems and testing trading strategies
Error 145 Trade Server Return Code
angevoyageur, 2014.03.01 14:27
Hello,
This forum is about MT5/mql5, please post your question about MT4/mql4 on mql4.com forum.
Forum on trading, automated trading systems and testing trading strategies
Press review
newdigital, 2014.06.20 16:51
How to Develop Forex Trading Skills
Foreign exchange is the most liquid financial market because it involves trading currencies on a global level. It includes individuals, banks, corporations and governments, and is not solely for investment. News at the national level directly impacts the currencies, and it takes some time to develop Forex skills on the technical and fundamental level. However, if you intend to trade in the Forex market, it is important to gain a strong understanding of these skills. The amount of leverage used in Forex trading can create large losses off one mistake.
Step 1Find a broker that offers a practice account. Even before depositing money, make sure you check fee structures and other requirements because you do not want to practice on an interface you will exclude later due to high fees. Also, decide if you want a U.S. firm that offers a maximum of 20:1 leverage, or an international firm that can offer up to 500:1 leverage. That means you can get $20 of trading power for every $1 deposited, or $500 for ever $1 respectively.
Step 2
Open a paper trading account with the amount of leverage you want to use. If you are using an international account, only use 500:1 if you plan on using that amount of leverage for real. Also, set your starting cash to what you would use.
Step 3
Get used to the interface and the tools available, as they can differ greatly from what a stock trader would be used to, or even a different Forex brokerage. Knowing how to place the correct orders quickly is critical.
Step 4
While getting used to the interface, read books and articles that discuss Forex strategies, then try them out on a practice account. Do not just finish the book and move on to the next one. Familiarize yourself with the material you are reading.
Step 5
Familiarize yourself with both the fundamental and technical aspects of trading. The technical analysis in Forex is similar to stocks. The fundamental side is trickier because you are analyzing each country in a Forex pair because all trades in Forex involve the relative value between two currencies, such as the U.S. dollar vs. the euro. Also, the global economy weighs on both countries, and you have to decide the effect on each, then compare them relative to one another. Focusing on only one side of trading like some people do in stocks is less effective in the Forex market due to its scale and the volatility that comes with leverage. You cannot choose just technical analysis or just fundamental analysis because both have significant short-term and long-term impacts.
Step 6
Get used to the trading schedule because the Forex market is a global market, and is open 24 hours a day, five days a week. In the U.S., that runs from Sunday night to Friday, with deviations depending on your specific location. Trade your paper account as realistically as you would your real money. You do not want to be away from your computer when you have open positions unless you are using a long-term strategy with a significant cushion of cash free in your account to absorb drawdowns, which are declines in value of your account that could trigger a margin call. In Forex, a margin call will liquidate your positions right away if your account value drops fast enough unless you can deposit money right away.
Step 7
Once you can handle the schedule and the difficulty of profitably trading foreign exchange, you can deposit money and start trading for real. Practicing with a paper account is critical for skills-building because learning by doing is the most effective way to learn. Eventually, real money must be used to learn proper money management and hone your skills further.
Tips
High leverage is tempting, but less leverage can create a better trading environment with less account volatility. Using 10:1 leverage is usually enough.
Warnings
The high amount of leverage available in Forex trading is a benefit and a curse. Gains can come quickly, but so can losses; volatility is magnified, with small movements in the currency amounting to large gains or losses.
Most people who get into Forex trading blow a couple of accounts, which means you lose all the money you deposited.