Market Condition Evaluation based on standard indicators in Metatrader 5 - page 180
You are missing trading opportunities:
- Free trading apps
- Over 8,000 signals for copying
- Economic news for exploring financial markets
Registration
Log in
You agree to website policy and terms of use
If you do not have an account, please register
Forum on trading, automated trading systems and testing trading strategies
Forecast for Q3'16 - levels for Hang Seng Index (HSI)
Sergey Golubev, 2016.07.01 16:20
Quick Technical Overview: Technical Targets for Hang Seng Index - intra-day/daily breakout with bullish reversal
H4 price broke 100 SMA/200 SMA reversal area once once again after Brexit brekdown on Friday: the price broke 200 SMA to above for the primary bullish market condition. Price is testing 21.001 resistance level to above for the bullish trend to be continuing with 21,160 resistance as a nearest bullish target.
Daily price was almost recovered: price broke 200 SMA with 21,001 resistance to be tested for 21,160 bullish target.
Forum on trading, automated trading systems and testing trading strategies
Forecast for Q3'16 - levels for DAX Index
Sergey Golubev, 2016.07.01 21:04
Quick Technical Overview: Technical Targets for DAX Index - psy level at 10,000.0 to be tested for the bullish reversal
H4 price is on slowly recovering mode after Brexit breakdown: the secondary bear market rally was started with 9.794.1 resistance level to be tested to above for the next bullish reversal target at 9.977.7
If the price breaks 9.977.7 resistance level to above so the intra-day bullish reversal will be started, if the price breaks 9,499.9 support to below so the primary bearish trend will be resumed with 9,152.1 nearest bearish target, otherwise - the price will be on bearish ranging within the levels.
Daily price is on secondary rally with 9,783.3 resistance level to be broken, and the nearest next target is 10,000.0 psy level to be broken to above for the price to be reversed to the primary bullish market condition.
Forum on trading, automated trading systems and testing trading strategies
Press review
Sergey Golubev, 2016.07.04 08:08
AUD/USD Intra-Day Fundamentals: Australian Building Approvals and 25 pips price movement
2016-07-04 01:30 GMT | [AUD - Building Approvals]
if actual > forecast (or previous one) = good for currency (for AUD in our case)
[AUD - Building Approvals] = Change in the number of new building approvals issued.
==========
==========
AUD/USD M5: 25 pips price movement by Australian Building Approvals news event :
Forum on trading, automated trading systems and testing trading strategies
USD/CAD Technical Analysis 2016, 03.07 - 10.07: daily breakdown to the bearish reversal
Sergey Golubev, 2016.07.04 17:26
Daily price is on breakdown for the Ichimoku cloud to be crossed to below on open daily bar for the reversal of the price movement to the primary bearish market condition: the price is breaking 1.2864 support level for now for the bearish breakdown to be continuing and with 1.2654 level as a daily bearish target.
If D1 price breaks 1.2864 support level on close bar so the bearish trend will be started.
If not so the price will be on bullish ranging within between Senkou Span line of Ichimoku cloud and 1.3119 resistance level located in the bullish area of the chart.
SUMMARY : possible breakdown
TREND : daily bearish reversalForum on trading, automated trading systems and testing trading strategies
Press review
Sergey Golubev, 2016.07.05 07:56
AUD/USD Intra-Day Fundamentals: RBA Cash Rate and 41 pips price movement
2016-07-05 04:30 GMT | [AUD - Cash Rate]
if actual > forecast (or previous one) = good for currency (for AUD in our case)
[AUD - Cash Rate] = Interest rate charged on overnight loans between financial intermediaries.
==========
The Sydney Morning Herald article:
==========
AUD/USD M5: 41 pips price movement by RBA Cash Rate news event :
Forum on trading, automated trading systems and testing trading strategies
Press review
Sergey Golubev, 2016.07.06 08:55
USD/CAD Technical Analysis - daily bearish ranging near 200-day SMA reversal area (adapted from the article)
Daily price is located near and below SMA with period 200 (200 SMA) in the bearish area of the chart for the ranging within 1.3472 "bullish reversal" resistance level and 1.2654 "bearish continuation" support level:
If the price will break 1.3472 resistance level so the reversal of the daily price movement to the primary bullish market condition will be started.
If price will break 1.2654 support so the bearish trend will be continuing.
If not so the price will be on bearish ranging within the levels.
SUMMARY : ranging
TREND : bearishForum on trading, automated trading systems and testing trading strategies
Press review
Sergey Golubev, 2016.07.06 12:00
Bank of America Merrill Lynch - "We now expect EUR/USD to end 2016 at 1.05" (adapted from the article)
Bank of America Merrill Lynch predicted for EUR/USD price to be around 1.05 by 2016 year end, and at 1.10 by by the end of 2017:
"We revised our projections following the UK referendum. We now expect EUR/USD to end 2016 at 1.05, from 1.08 before, appreciating to 1.10 by the end of 2017, from 1.15 before. These projections will still keep the Euro undervalued, but not substantially, compared with our equilibrium EUR/USD estimate of 1.16. In our view, a much weaker Euro would affect the Fed’s policy reaction function, as the US data remains mixed, recently losing momentum."
If we look at the weekly chart so the price is located on the bearish market condition with the ranging within 1.1455 resistance level and 1.0936 support level. Breaking the resistance at 1.1455 will lead to the ranging bearish condition by the bear market rally up to the possible weekly bullish reversal. Alternative, if the price breaks 1.0936 support to below on close weekly bar so the primary bearish trend will be continuing up to 1.0516 support level as a the end-year bearish target.
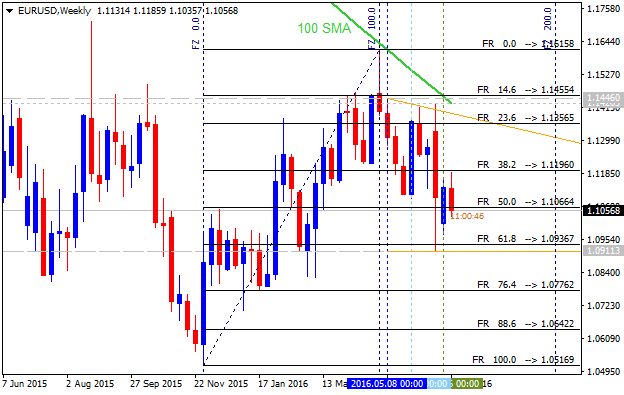
Most likely scenario for the long-term price movement for this pair is the following: ranging bearish market condition will be continuing within 1.11/1.05 ranging area.Forum on trading, automated trading systems and testing trading strategies
Press review
Sergey Golubev, 2016.07.06 20:03
EUR/USD Intra-Day Fundamentals: ISM Non-Manufacturing PMI and 35 pips price movement
2016-07-06 14:00 GMT | [USD - ISM Non-Manufacturing PMI]
if actual > forecast (or previous one) = good for currency (for USD in our case)
[USD - ISM Non-Manufacturing PMI] = Level of a diffusion index based on surveyed purchasing managers, excluding the manufacturing industry.
==========
"The report was issued today by Anthony Nieves, CPSM, C.P.M., CFPM, chair of the Institute for Supply Management® (ISM®) Non-Manufacturing Business Survey Committee. "The NMI® registered 56.5 percent in June, 3.6 percentage points higher than the May reading of 52.9 percent. This represents continued growth in the non-manufacturing sector at a faster rate. The Non-Manufacturing Business Activity Index increased to 59.5 percent, 4.4 percentage points higher than the May reading of 55.1 percent, reflecting growth for the 83rd consecutive month, at a faster rate in June. The New Orders Index registered 59.9 percent, 5.7 percentage points higher than the reading of 54.2 percent in May. The Employment Index grew 3 percentage points in June after one month of contraction to 52.7 percent from the May reading of 49.7 percent. The Prices Index decreased 0.1 percentage point from the May reading of 55.6 percent to 55.5 percent, indicating prices increased in June for the third consecutive month. According to the NMI®, 15 non-manufacturing industries reported growth in June."
==========
EUR/USD M5: 35 pips price movement by ISM Non-Manufacturing PMI news event :
Forum on trading, automated trading systems and testing trading strategies
Press review
Sergey Golubev, 2016.07.08 14:43
EUR/USD Intra-Day Fundamentals: Non-Farm Payrolls and 66 pips price movement
2016-07-08 12:30 GMT | [USD - Non-Farm Employment Change]
if actual > forecast (or previous one) = good for currency (for USD in our case)
[USD - Non-Farm Employment Change] = Change in the number of employed people during the previous month, excluding the farming industry.
==========
"Total nonfarm payroll employment increased by 287,000 in June, and the unemployment rate rose to 4.9 percent, the U.S. Bureau of Labor Statistics reported today. Job growth occurred in leisure and hospitality, health care and social assistance, and financial activities. Employment also increased in information, mostly reflecting the return of workers from a strike."
==========
EUR/USD M5: 66 pips price movement by Non-Farm Payrolls news event :
Forum on trading, automated trading systems and testing trading strategies
EURUSD Technical Analysis 2016, 10.07 - 17.07: ranging bearish
Sergey Golubev, 2016.07.09 10:14
Daily price is located below Ichimoku cloud on the bearish market condition with the ranging within the narrow key support/resistance levels:
Chinkou Span line is below the price indicating the ranging bearish market condition for the coming week, and Trend Strength indicator and Absolute Strength indicator are estimating the trend as the ranging bearish.
If D1 price break 1.0911 support level on close bar so the bearish trend will be continuing.
If D1 price break 1.1186 resistance level on close bar from below to above so the local uptrend as the bear market rally will be started.
If D1 price break 1.1446 resistance level on close bar from below to above so we may see the reversal of the price movement to the primary bullish market condition.
If not so the price will be on ranging within the levels.
SUMMARY : bearish
TREND : ranging