Forecast for Q3'16 - levels for US Dollar Index
Economic Releases that Move the US Dollar
As you can probably imagine, we could spend many lessons and multiple
hours going over each of the economic indicators that affect the price
of the US Dollar. It is for this reason, that before getting into any of
the actual indicators, I wanted to give everyone an overview of the
broad things that move the market. As we have discussed in previous
lessons the two broad categories that pretty much everything that moves
the forex market fits into, are trade flows and capital flows, as
covered in module 3 of this course.
Once you have an understanding of this, all that is necessary to
understand how economic numbers move the dollar, is to understand which
numbers are important to the market at the time, whether those numbers
fit into the trade flows or capital flows category, and how they should
affect the dollar as a result.
How the
market reacts to economic releases is generally determined by two
factors:
1. How important the market considers a particular release to be.
2. How close to market estimates the number comes in at. Remember that
markets anticipate news, so generally if an economic release comes out
as expected, there is very little if any market reaction to that
release.
How important the market considers a particular economic release to be,
is something that changes over time depending on what is happening from a
US Dollar fundamentals standpoint. If there are worries that the
economy is going into recession, then the market is going to be extra
sensitive to any numbers, such as non farm payrolls and consumer
spending, which may provide early warning signs that this is the case.
Conversely, if the economy is heating up and the markets are worried
that inflation may become a problem, then the most market moving numbers
may be price data releases, such as the CPI and the PPI. For your
reference, according to Dailyfx.com the most market moving indicators
for 2007, in order of importance were:
1. Non Farm Payrolls
2. FOMC Releases
3. Retail Sales
4. ISM Manufacturing
5. Inflation
6. Producer Price Index
7. The Trade Balance
8. Existing Home Sales
9. Foreign Purchases of US Treasuries (TIC Data)
We have discussed most of these indicators already, and for those which
we have not, a quick google search, and review of the indicator in the
context of whether it fits into trade flows or capital flows, should
answer the question of why they move the market.
Although I am probably a little biased since I used to work with the
people who run the site, I am a very big fan of Dailyfx.com as the place
where I go to find out what economic data is due for release, and for
commentary on the number after the release. They have a great global
calendar which you can find at the top of the site as well as tons of
both technical and fundamental commentary on everything that affects the
US Dollar and forex market in general.
For this lesson specifically, if you click the calendar button at the
top of the site you will see they have all of the economic data releases
from the major countries of the world with the time of the release, the
previous number, the forecasted number and the actual number which is
updated after the release. You will also notice here they have links for
the more important numbers giving a definition of the release, the
relative importance of the release, and the latest news release relating
to that release.
If you click back to the homepage of the site you will see lots of fx
related reports which the Dailyfx staff puts out throughout the day. Two
of my favorite reports are the Daily Fundamental report by Kathy lien,
and the US Open Market Points by Boris Schlossberg which you can find in
the middle of the page.
As we discussed in module 8 of our basics of trading course, the best way to get a feel for how economic numbers affect the market, and which numbers are in focus, is to start following the market on a daily basis and seeing how it reacts to various news events. As this is the case, I highly recommend following the commentary on Dailyfx.com as well as the forex commentary on InformedTrades.com, and start putting your analysis to practice on your real time demo accounts. If you have not registered for a free realtime demo account I have included a link above this video where you can do so.
Forum on trading, automated trading systems and testing trading strategies
Sergey Golubev, 2016.07.09 13:46
Fundamental Weekly Forecasts for Dollar Index, GBP/USD, USD/JPY, AUD/USD, USD/CAD, USD/CNH and GOLD (based on the article)
Dollar Index - "If there is any imbalance in one of these major regions of the world, it is unlikely that emergent pressures on the traditional dual mandate will lead the Fed to potentially-risky rate hikes. On the other hand, if any of these critical areas implode; the implications for global risk trends could prove a boon for the Greenback. The Dollar has seen its position as a safe haven intensify significantly recently with the options for reserve alternatives diminishing post Brexit (brining the second and third most liquid reserve currencies – Euro and Pound – down with it). In the event of a sentiment slide that pulls down equity markets like the S&P 500, the need for safe harbor would revive a dormant appetite for the benchmark."

Forum on trading, automated trading systems and testing trading strategies
Sergey Golubev, 2016.07.16 11:34
Fundamental Weekly Forecasts for Dollar Index, GBP/USD, USD/CAD, USD/JPY, NZD/USD, AUD/USD, USD/CNH and GOLD (based on the article)
Dollar Index - "Risk trends are a skewed support for the Dollar. Despite the charge to record high for equities, the Dollar has not lost the bulk of its post-Brexit surge. That is testament to the type of haven the Dollar represents (liquidity and primary reserve) as well as the dubious nature of the relentless and desperate push for yield. If equities falter and pulls other speculative-directed assets with it, however, the Dollar would readily draw the masses to its safe harbor."
Daily price is on ranging condition to be located near 200 day SMA waiting for the direction of the trend to be started. The price is breaking 200 SMA together with ascending triangle pattern to above for the bullish reversal. Alternative, if the price crosses 95.34 support level to below so the primary bearish trend will be resumed.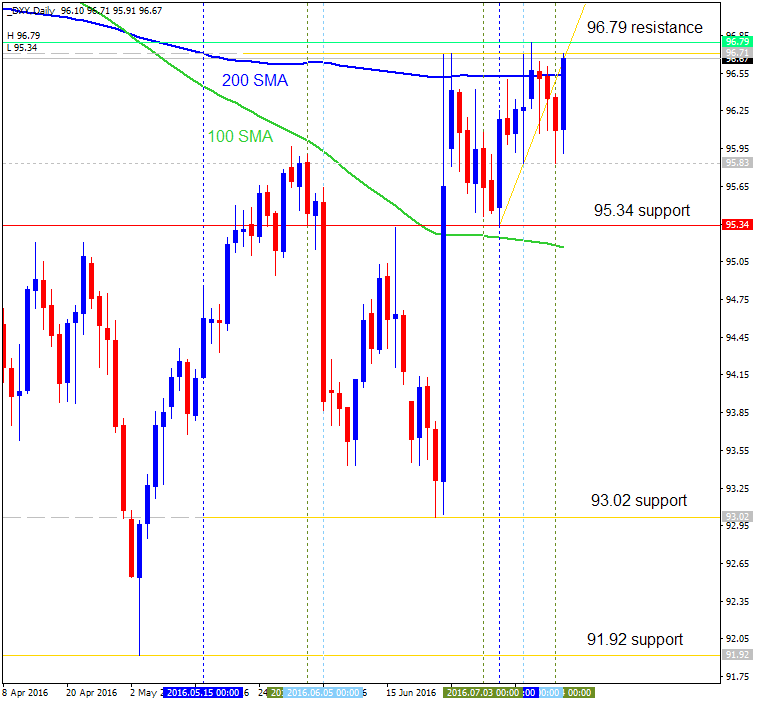
Dollar Index: End Of Week Technicals - Bullish To Continue or Correction To Be Started?
This trading week ended with some dilemma: bullish trend to be continuing in case the price breaks 97.32 resistance level, or the secondary correction to be started just in case of support level at 96.79 to be broken to below.
------------------
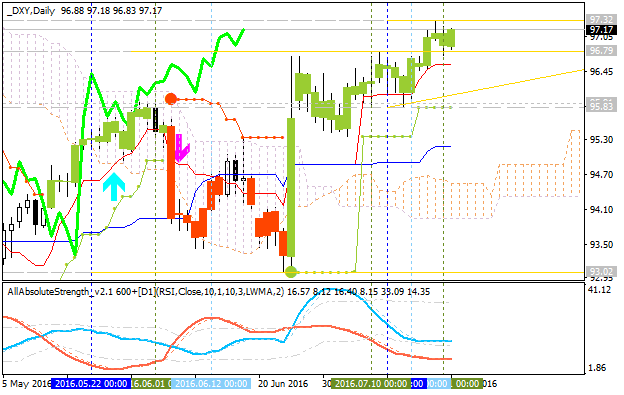
D1 price is on located above Ichimoku cloud for the bullish market condition with the ranging within 97.32/96.79 narrow levels.
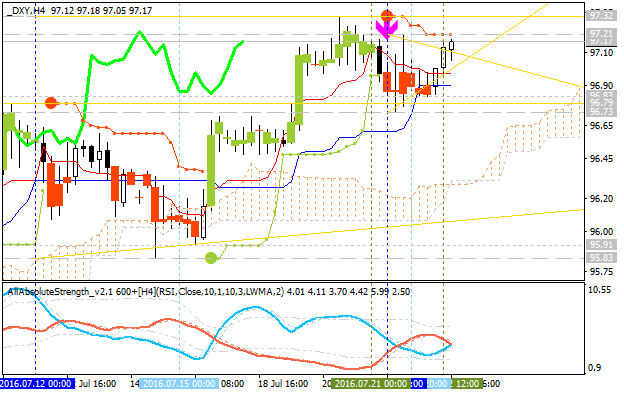
H4 price
is on bullish ranging with 97.21 resistance level to be tested for 97.32 level as a nearest target to re-enter. Chinkou Span line of Ichimoku indicator is located above the price for the bullish trend to be continuing by the direction. Absolute Strength insdicator is estimating the possible bullish breakout in the near future.
If H4 price breaks 96.79 support so the bearish reversal may be started with the secondary ranging way.
If not so the price will be ranging within the levels.
| Resistance | Support |
|---|---|
| 97.21 | 96.83 |
| 97.32 | 96.79 |
| N/A | 95.91 |
SUMMARY : bullish
Forum on trading, automated trading systems and testing trading strategies
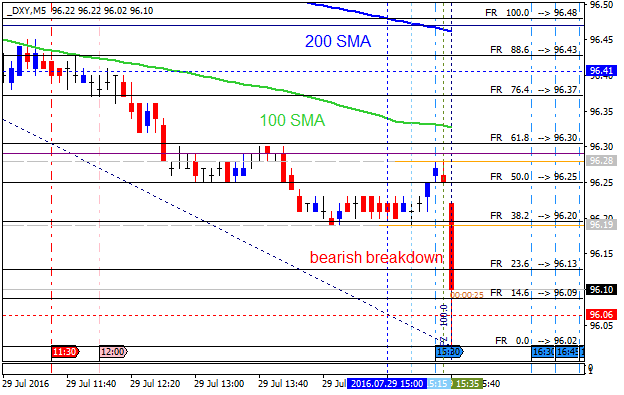
Sergey Golubev, 2016.07.29 14:51
Intra-Day Fundamentals - EUR/USD and Dollar Index: U.S. Gross Domestic Product
2016-07-29 12:30 GMT | [USD - GDP]
- past data is 1.1%
- forecast data is 2.6%
- actual data is 1.2% according to the latest press release
if actual > forecast (or previous one) = good for currency (for USD in our case)
[USD - GDP] = Annualized change in the inflation-adjusted value of all goods and services produced by the economy.
==========
- "Real gross domestic product increased at an annual rate of 1.2 percent in the second quarter of 2016, according to the "advance" estimate released by the Bureau of Economic Analysis. In the first quarter, real GDP increased 0.8 percent (revised)."
- "The Bureau emphasized that the second-quarter advance estimate released today is based on source data that are incomplete or subject to further revision by the source agency. The "second" estimate for the second quarter, based on more complete data, will be released on August 26, 2016."
- "The increase in real GDP in the second quarter reflected positive contributions from personal consumption expenditures (PCE) and exports that were partly offset by negative contributions from private inventory investment, nonresidential fixed investment, residential fixed investment, and state and local government spending. Imports, which are a subtraction in the calculation of GDP, decreased."
==========
EUR/USD M5: 31 pips range price movement by U.S. Gross Domestic Product news event
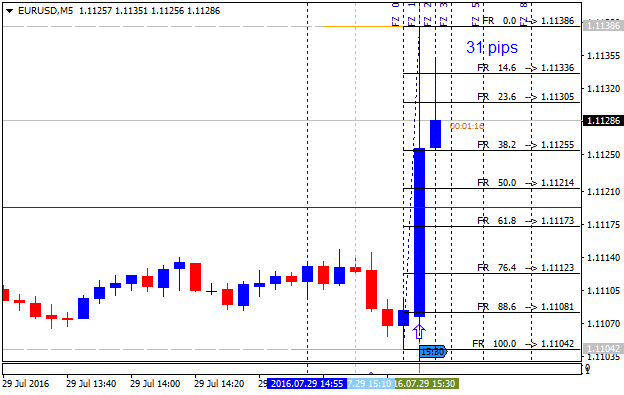
==========
Dollar Index M5: intra-day bearish breakdown by U.S. Gross Domestic Product news event
Forum on trading, automated trading systems and testing trading strategies
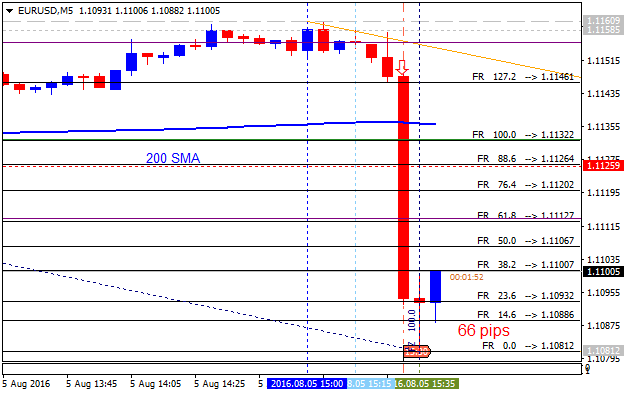
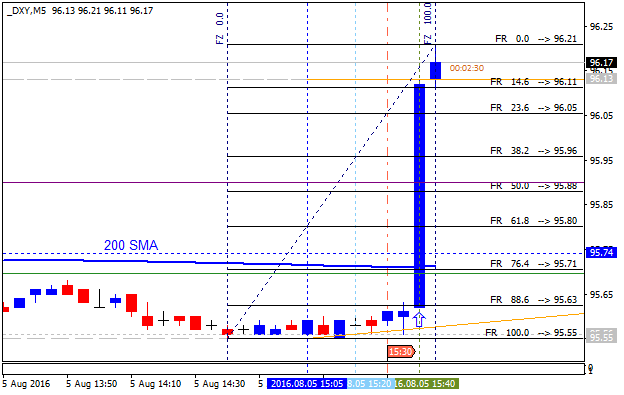
Sergey Golubev, 2016.08.05 14:53
Intra-Day Fundamentals - EUR/USD and Dollar Index: Non-Farm Payrolls
2016-08-05 12:30 GMT | [USD - Non-Farm Employment Change]
- past data is 287K
- forecast data is 180K
- actual data is 255K according to the latest press release
if actual > forecast (or previous one) = good for currency (for USD in our case)
[USD - Non-Farm Employment Change] = Change in the number of employed people during the previous month, excluding the farming industry.
==========
"Total nonfarm payroll employment rose by 255,000 in July, and the unemployment rate was unchanged at 4.9 percent, the U.S. Bureau of Labor Statistics reported today. Job gains occurred in professional and business services, health care, and financial activities. Employment in mining continued to trend down."
==========
EUR/USD M5: 66 pips price movement by Non-Farm Payrolls news event
==========
Dollar Index M5: price movement by Non-Farm Payrolls news event
Forum on trading, automated trading systems and testing trading strategies
Sergey Golubev, 2016.08.09 14:45
Staying USD Bearish - Morgan Stanley (based on the article)
- "As long as US inflation expectations remain low, the Fed is unlikely to raise rates early."
- "Hence, the Fed is likely to stay behind the curve, suggesting US real yields coming down again. However, it is not only the Fed which makes us USD-bearish."
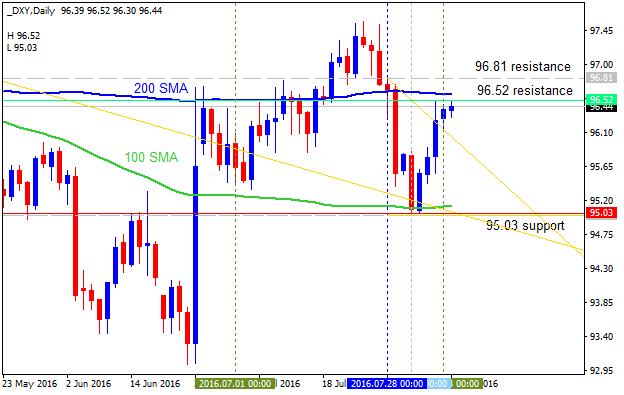
Dollar Index: ranging within 100 SMA/200 SMA for direction.
The price is located within 100 SMA/200 SMA for the ranging condition waiting for direction.
- if the price breaks 96.52 resistance on close daily bar so the bullish reversal will be started;
- if the price breaks 95.03 support level so the primary bearish trend will be resumed;
- if not so the price will be moved within 100 SMA/200 SMA channel.
| Resistance | Support |
|---|---|
| 96.52 | 95.03 |
| 96.81 | N/A |
Forum on trading, automated trading systems and testing trading strategies
Sergey Golubev, 2016.08.13 13:20
Fundamental Weekly Forecasts for Dollar Index, USD/JPY, AUD/USD, USD/CAD, NZD/USD, USD/CNH and GOLD (based on the article)
Dollar Index - "Barring a tangible change in rate forecast – for better or worse – the Dollar will be difficult to transition to clear trend against the backdrop of global indecision. The ‘Summer Doldrums’ are discouraging traders from participating and the Greenback is suffering both for its key liquidity appeal (safe haven) as well as its unique risk orientation via early rate hikes. While traders should monitor it for volatility, they should also be skeptical of trend for the currency."
Daily price is located between 100 SMA and 200 SMA in the ranging bearish area of the chart and within the following s/r levels:
- 96.52 resistance level located near 200 SMA in the beginning of the bullish trend on the chart, and
- 95.00 located below 200 SMA and near 100 SMA in the beginning of the primary bearish trend to be resumed.
Ascending triangle pattern was formed by the price to be crossed to above for the possible daily bullish reversal.
If D1 price breaks 96.52 resistance level on close bar from below to above so the bullish reversal will be started with 97.57 nearest daily bullish target.
If not so the price will be on ranging within the levels.
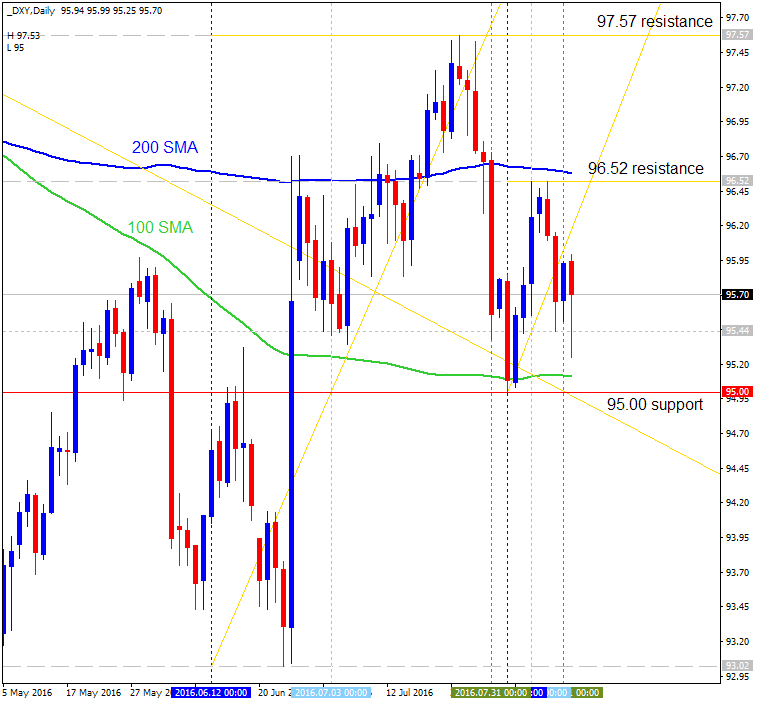
- Recommendation for long: watch close daily price to break 96.52 for possible buy trade
- Recommendation
to go short: watch daily price to break 95.00 support level for possible sell trade
- Trading Summary: ranging
| Resistance | Support |
|---|---|
| 96.52 | 95.00 |
| 97.57 | N/A |
Dollar Index Intra-Day Technical Analysis - bullish reversal or bearish trend to be resumed?
H4 price is on ranging condition located below Ichimoku cloud in the bearish area of the chart. The price is within the following support/resistance levels:
- 94.96 resistance level located near Senkou Span line of Ichimoku indicator in the beginning of the bullish trend to be started, and
- 94.08 support level located below Ichimoku cloud in the bearish area of the chart.
AllAbsolute Strength indicator is estimating the bearish trend to be continuing with the secondary ranging way.
| Resistance | Support |
|---|---|
| 94.96 | 94.08 |
| 95.66 | N/A |
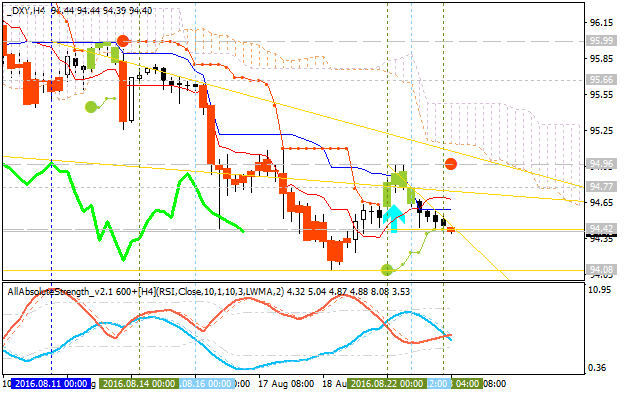
If
H4 price breaks 94.08 support level on close H4 bar so the primary bearish trend will be resumed.
If H4 price breaks 94.96 resistance level so the reversal of the intraday price movement to the primary bullish market condition will be started.
If not so the price will be ranging within the levels.
SUMMARY : bearish
Forum on trading, automated trading systems and testing trading strategies
Sergey Golubev, 2013.11.06 15:03
Based on - U.S. Dollar Index - USDX
U.S. Dollar Index (USDX) was introduced in March 1973, when the
Bretton Woods system ceased to exist. The index shows the ratio of U.S.
dollar against a basket of six major world currencies - the euro is
(EUR), Yen (JPY), British Pounds (GBP), Canadian Dollar (CAD), Swedish
krona (SEK) and Swiss Franc (CHF). As part of this basket each currency
has its own weight:
EUR - 57,6%
JPY - 13,6%
GBP - 11,9%
CAD - 9,1%
SEK - 4,2%
CHF - 3,6%
The composition of the basket of 1973 changed only once - in 1999, when the euro was introduced.
At the time of occurrence of the index had a value of 100 points. Historic lows it reached in March 2008 - 70.7 points, while the maximum value was recorded in February 1985 - 148.1 points. The index traded at the time of the global currency markets - 24 hours a day, 5 days a week. Trading on the Stock Exchange are ICE (Intercontinental Exchange) - The former New York Mercantile Exchange (NYBOT - New York Board of Trade). Moreover, the index is presented in the form of various traded instruments: the exchange funds (exchange traded funds, or ETF), mutual funds (mutual funds), stock options.
The index is calculated as a weighted geometric mean of the above
mentioned currencies according to the following formula:
USDXt = 50,14348112 x (EURt) -0,576 x (JPYt) 0,136 x (GBPt) -0,119 x
(CADt) 0,091 x (SEKt) 0,042 x (CHFt) 0,036
In the formula, the power coefficients corresponding to the weights of
currencies in the basket. Calculation of the index coincides with the
data used in calculating the Fed trade-weighted dollar index of
currencies of countries which form the main foreign trade turnover of
U.S..
Most of the international trade in the U.S. accounts for the euro area (57.6%), followed by Japan - 13.6% United Kingdom - 11.9% Canada - 9.1%, Sweden - and Switzerland 4.2% - 3.6 %.
How to use the dollar index on the forex?
It is important to understand whether you like it or not, dictates that the U.S. dollar trends of major world currencies, so the index is an excellent starting point for determining the strength or weakness of U.S. dollar currency pairs.
As a rule, the change trend of the index leads to changes in the trends of the currency pairs in which the USD and he is present. For example, during an uptrend USDX pairs with direct quote will also increase (eg, USDCHF, USDCAD), a couple from the back - slow down (it EURUSD, GBPUSD). Using technical analysis toolkit, such as candlesticks, support / resistance levels, moving averages, you can get an idea about the strength of the U.S. dollar in terms of long-term trends, the possible long-and short-term reversals, as well as changes in the attitudes of market participants.
- Free trading apps
- Over 8,000 signals for copying
- Economic news for exploring financial markets
You agree to website policy and terms of use
Quick Technical Overview: Technical Targets for Dollar Index - daily ranging for direction
H4 price is on bullish ranging within 96.42 resistance and 95.44 support levels. If the price breaks 96.42 resistance level to above so the bullish trend will be resumed with 96.71 target to re-enter, if the price breaks 95.44 support to below so the reversal of the price movement from the primary bullish to the ranging bearish condition will be started, otherwise - the price will be on ranging bullish condition within the levels.
Daily price is located between 100 SMA and 200 SMA on the ranging area of the chart within key support/resistance reversal levels.