Market Condition Evaluation based on standard indicators in Metatrader 5 - page 174
You are missing trading opportunities:
- Free trading apps
- Over 8,000 signals for copying
- Economic news for exploring financial markets
Registration
Log in
You agree to website policy and terms of use
If you do not have an account, please register
Forum on trading, automated trading systems and testing trading strategies
Press review
Sergey Golubev, 2016.05.14 15:12
Fundamental Weekly Forecasts for Dollar Index, GBP/USD, USD/CNH, AUD/USD and GOLD (based on the article)
Dollar Index - "The three-month rally in risk-oriented assets has started to falter, and a deepening of that slide could certainly agitate some haven appeal for the Greenback. However, full-scale risk aversion is the thousand point weight swinging above the market and what would most effectively leverage the depth of haven appeal that would activate the currency’s haven status. That said, we may not need such an extreme. With fears of currency wars growing, FX volatility could make for a more ready driver. Watch this week’s G-7 meeting for FX mentions."
GBP/USD - "GBP/USD stands at risk of facing range-bound conditions next week as market participants weigh the outlook for monetary policy, but the pair may continue to mark fresh monthly lows over the coming days should the exchange rate fail to hold above near-term support around 1.4290 (78.6% Fib retracement) to 1.4330 (23.6% Fib expansion)."
USD/CNH - "Chinese commodities rode roller coasters this week. Major commodities plunged to the daily limit-downs on Monday. Then they diverged on Thursday: black commodities extended losses while crops jumped higher with soybean and rapeseed hitting the daily limit-ups. However, on Friday, soybean oil, palm oil as well as five black commodities, dropped to the daily limit-downs again. China’s commodity market is less developed than in US or other major developed countries; it is also less regulated compared to Chinese equity market. Such dramatic moves in the commodity market could lead to a meltdown in the near term. If it happens, the panic may drive capitals rushing out of the country, similar as it was seen early this year cause by the tumbling equities. This is a potential risk for the Chinese Yuan as a significant increase in capital outflows often drives the currency lower."
AUD/USD - "The prospect of a more hawkish US central bank bodes ill for risk appetite at a time when investors seem increasingly concerned about a broad-based slowdown in global economic growth. As such, news-flow to that effect may send the sentiment-sensitive Aussie lower alongside share prices."
GOLD (XAU/USD) - "Retail Sales released on Friday topped expectations and while the print alleviates some concerns over the health of the consumer, the print does little to move the needle on central bank policy moving forward. If anything, it does leave the door open with the focus now shifting towards more significant data next week. Traders will be closely eyeing the release of the April U.S. Consumer Price Index (CPI) and minutes from April 27th policy meeting where we hope to get a more detailed picture of where the committee members stand as it pertains to the appropriate timing of future interest rate hikes. Keep in mind that of the Fed’s dual mandate, inflation remains the laggard; lending added significance to the current pace of price growth."
Forum on trading, automated trading systems and testing trading strategies
Forecast for Q2'16 - levels for Hang Seng Index (HSI)
Sergey Golubev, 2016.05.15 07:23
Hang Seng Index Technical Analysis 2016, 15.05 - 22.05: bearish ranging breakdown
Daily price is on breakdown with bearish reversal: the price broke Ichimoku cloud to below for the reversal of the price movement from the primary bullish to the primary bearish market condition. The price is testing 19,561 support level for the bearish breakdown to be continuing.
Weekly price is on bearish condition located below Ichimoku cloud and Senkou Span line which is the virtual border between the primary bearish and the primary bullish trend on the chart. The price is on ranging within 21,666 'bullish reversal' resistance and 18,221 'bearish continuation' support levels waiting for direction of the trend.
If D1 price will break 19,561 support level on close bar so the bearish breakdown will be continuing up to 18,221 as the next target.
If D1 price will break 20,447 resistance level on close bar from below to above so the reversal of the price movement from the primary bearish to the ranging bullish condition will be started.
If not so the price will be on ranging within the levels.
SUMMARY : ranging breakdown
TREND : bearishForum on trading, automated trading systems and testing trading strategies
Forecast for Q2'16 - levels for S&P 500
Sergey Golubev, 2016.05.15 12:26
S&P 500 Technical Analysis 2016, 15.05 - 22.05: breakdown to the ranging bearish reversal
Daily price is on possible bearish reversal to be started on daily open bar for now: the price is breaking Senkou Span line which is the virtual border between the primary bearish and the primary bullish trend on the chart. Chinkou Span line is breaking the price to below as well for the breakdown with possible bearish reversal to be started, and Absolute Strength indicator is estimating the ranging bearish condition to be in the near future.
If the price breaks Senkou Span line together with 2,030.25 support level so the bearish reversal will be started with the secondary ranging market condition: the price will be inside Ichimoku cloud.
If not so the price will be on ranging within the levels.
Forum on trading, automated trading systems and testing trading strategies
Press review
Sergey Golubev, 2016.05.16 12:23
Technical Targets for EUR/USD by United Overseas Bank (based on the article)
EUR/USD: intra-day bearish, daily correction
H4 price is located below 200 period SMA (200 SMA) for the ranging market condition within the following key reversal support/resistance levels:
If the price breaks 1.1361 level to above so the intra-day bullish reversal will be started, and if the price breaks 1.1282 level to below so the bearish trend will be continuing.
Daily price is located above 200 SMA for the bullish market condition: price is testing 1.1282 support level for the secondary correction to be continuing.
United Overseas Bank is considering the EUR/USD price to be on downtrend with 1.1215 target:
"The unexpected breach of 1.1350 and 1.1300 last Friday has shifted the risk to the downside. While the outlook for EUR is bearish from here, the downside potential appears to be limited to a test of April’s low of 1.1210/15. Downward momentum is only beginning to improve and a break back above 1.1400 is enough to indicate that a short-term low is in place."
Forum on trading, automated trading systems and testing trading strategies
Forecast for Q2'16 - levels for Brent Crude Oil
Sergey Golubev, 2016.05.16 17:25
Medium-Term Technical Analysis for Brent Crude Oil: weekly bullish reversal breakout or bearish ranging near reversal
Weekly price is on bearish condition located near below Ichimoku cloud and Senkou Span line which is the virtual border between the primary bearish and the primary bullish trend on the chart. The price is on secondary bear market rally by testing 48.25 resistance level for the secondary rally to be continuing with 53.95 bullish reversal resistancer level as the next nearest target.
SUMMARY : ranging
TREND : bearish ranging near bullish reversal levelsUSD to Russian Ruble: waiting for breakout
This is very interesting situation: all the developing patterns (for all the timeframes started with M30 up to MN1 for example) are showing uptrend, and it is the good signal for future possible breakout.
Forum on trading, automated trading systems and testing trading strategies
Press review
Sergey Golubev, 2016.05.17 08:55
AUD/USD Intra-Day Fundamentals: Reserve Bank of Australia (RBA) May Meeting Minutes and 80 pips price movement
2016-05-17 01:30 GMT | [AUD - Monetary Policy Meeting Minutes]
[AUD - Monetary Policy Meeting Minutes] = It's a record of the RBA Reserve Bank Board's most recent meeting, providing in-depth insights into the economic conditions that influenced their decision on where to set interest rates.
==========
==========
AUD/USD M5: 80 pips price movement by Reserve Bank of Australia (RBA) May Meeting Minutes news event :
Forum on trading, automated trading systems and testing trading strategies
Press review
Sergey Golubev, 2016.05.18 08:31
Trading the News: U.K. Jobless Claims Change (based on the article)
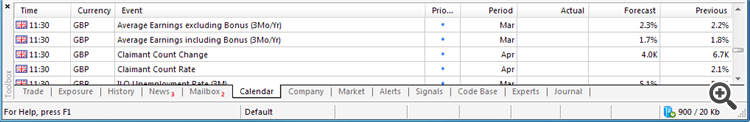
What’s Expected:
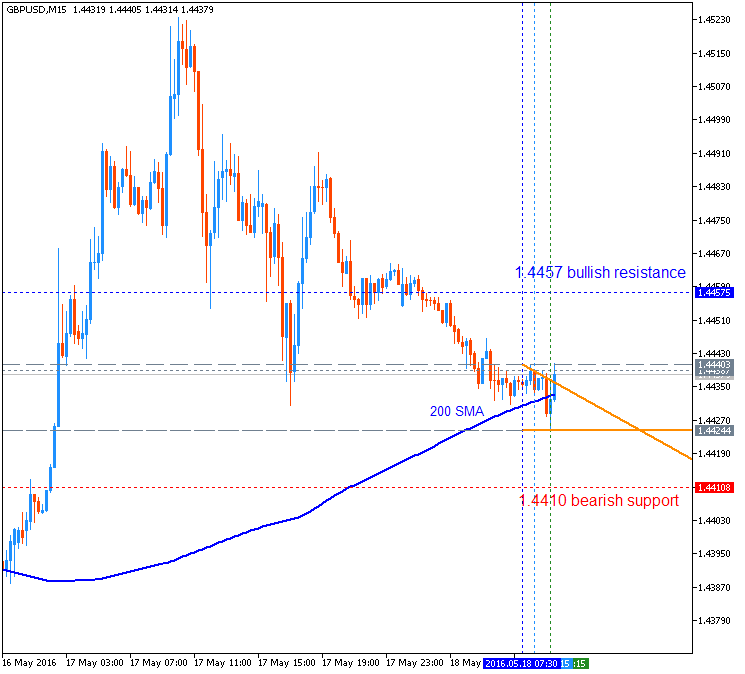
Anyway, if we look at GBP/USD chart so the price is located near 200 period SMA waiting for direction.
If the price breaks 1.4457 resistance to above on close bar so the bullish trend will be continuing;
If the price breaks 1.4410 support level to below so the bearish reversal will be started;
If not so the price will be on ranging condition within the channel of the levels.
Forum on trading, automated trading systems and testing trading strategies
Gold is Reaching at 1270
Sergey Golubev, 2013.07.01 21:04
How can we know: correction, or bullish etc (in case of using indicator for example)?
well ... let's take AbsoluteStrength indicator from MT5 CodeBase.
bullish (Bull market) :
bearish (Bear market) :
ranging (choppy market - means: buy and sell on the same time) :
flat (sideways market - means: no buy and no sell) :
correction :
correction in a bear market (Bear Market Rally) :
Forum on trading, automated trading systems and testing trading strategies
Forecast for Q2'16 - levels for USD/CAD
Sergey Golubev, 2016.05.20 09:15
USD/CAD Price Action Analysis - intra-day ranging bullish; daily bear market rally; 1.3154 resistance level is the key
H4 intra-day price is located far above 200 period SMA and 100 period SMA for the primary bullish market condition with secondary ranging between Fibo support level at 1.2837 and Fibo resistance level at 1.3154:
If the price will break Fibo support level at 1.2837 so the reversal of the intra-day price movement from the primary bullish to the primary bearish market condition will be started.
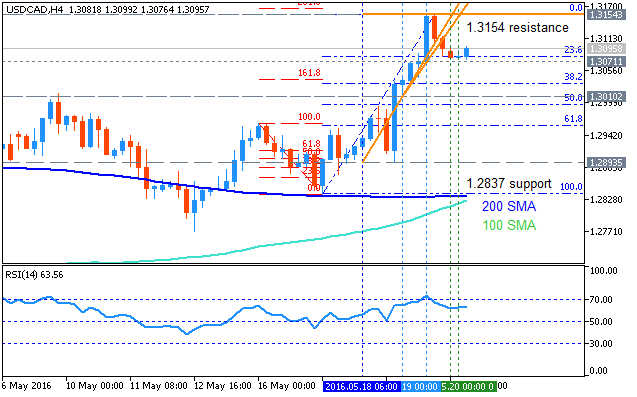
If the price will break Fibo resistance level at 1.3154 from below to above so the primary bullish trend will be continuing with good possible breakout of the price movement.
If not so the price will be on bullish ranging within the levels.
Trend:
H4 - ranging bullishD1 - bear market rally