Something Interesting in Financial Video December 2015
Forum on trading, automated trading systems and testing trading strategies
Something Interesting in Financial Video June 2013
Sergey Golubev, 2013.06.02 14:27
Reversals and Retracements
We talked about two patterns, those that continue trends and those that reverse trends. It is important to distinguish reversals which break trends with retracements within a trend and to mistake one for the other is obviously going to be loss making
Forum on trading, automated trading systems and testing trading strategies
Something Interesting in Financial Video June 2013
Sergey Golubev, 2013.06.03 09:07
Do Chart Patterns have to be Complete?
How perfect does a technical chart pattern has to be? What chart patterns really mean. The challenge for traders is to combine trend theory with reality. Does a triangle chart or head and shoulders chart pattern has to be perfectly formed for instance? There are very few perfectly shaped patterns.
Forum on trading, automated trading systems and testing trading strategies
Something Interesting in Financial Video June 2013
Sergey Golubev, 2013.06.03 13:06
Economic Data Releases to Follow
Forum on trading, automated trading systems and testing trading strategies
Something Interesting in Financial Video September 2013
Sergey Golubev, 2013.09.19 08:00
120. Economic Releases that Move the US DollarAs you can probably imagine, we could spend many lessons and multiple hours going over each of the economic indicators that affect the price of the US Dollar. It is for this reason, that before getting into any of the actual indicators, I wanted to give everyone an overview of the broad things that move the market. As we have discussed in previous lessons the two broad categories that pretty much everything that moves the forex market fits into, are trade flows and capital flows, as covered in module 3 of this course.
Once you have an understanding of this, all that is necessary to understand how economic numbers move the dollar, is to understand which numbers are important to the market at the time, whether those numbers fit into the trade flows or capital flows category, and how they should affect the dollar as a result.
As we learned in module 8 of our basics of trading course, how the market reacts to economic releases is generally determined by two factors:
1. How important the market considers a particular release to be.
2. How close to market estimates the number comes in at. Remember that markets anticipate news, so generally if an economic release comes out as expected, there is very little if any market reaction to that release.
How important the market considers a particular economic release to be, is something that changes over time depending on what is happening from a US Dollar fundamentals standpoint. If there are worries that the economy is going into recession, then the market is going to be extra sensitive to any numbers, such as non farm payrolls and consumer spending, which may provide early warning signs that this is the case. Conversely, if the economy is heating up and the markets are worried that inflation may become a problem, then the most market moving numbers may be price data releases, such as the CPI and the PPI. For your reference, according to Dailyfx.com the most market moving indicators for 2007, in order of importance were:
1. Non Farm Payrolls
2. FOMC Releases
3. Retail Sales
4. ISM Manufacturing
5. Inflation
6. Producer Price Index
7. The Trade Balance
8. Existing Home Sales
9. Foreign Purchases of US Treasuries (TIC Data)
We have discussed most of these indicators already, and for those which we have not, a quick google search, and review of the indicator in the context of whether it fits into trade flows or capital flows, should answer the question of why they move the market.
Although I am probably a little biased since I used to work with the people who run the site, I am a very big fan of Dailyfx.com as the place where I go to find out what economic data is due for release, and for commentary on the number after the release. They have a great global calendar which you can find at the top of the site as well as tons of both technical and fundamental commentary on everything that affects the US Dollar and forex market in general.
For this lesson specifically, if you click the calendar button at the top of the site you will see they have all of the economic data releases from the major countries of the world with the time of the release, the previous number, the forecasted number and the actual number which is updated after the release. You will also notice here they have links for the more important numbers giving a definition of the release, the relative importance of the release, and the latest news release relating to that release.
If you click back to the homepage of the site you will see lots of fx related reports which the Dailyfx staff puts out throughout the day. Two of my favorite reports are the Daily Fundamental report by Kathy lien, and the US Open Market Points by Boris Schlossberg which you can find in the middle of the page.
As we discussed in module 8 of our basics of trading course, the best way to get a feel for how economic numbers affect the market, and which numbers are in focus, is to start following the market on a daily basis and seeing how it reacts to various news events. As this is the case, I highly recommend following the commentary on Dailyfx.com as well as the forex commentary on InformedTrades.com, and start putting your analysis to practice on your real time demo accounts. If you have not registered for a free realtime demo account I have included a link above this video where you can do so.
Forum on trading, automated trading systems and testing trading strategies
Something Interesting in Financial Video June 2013
Sergey Golubev, 2013.06.20 00:12
What is FOMC Meeting
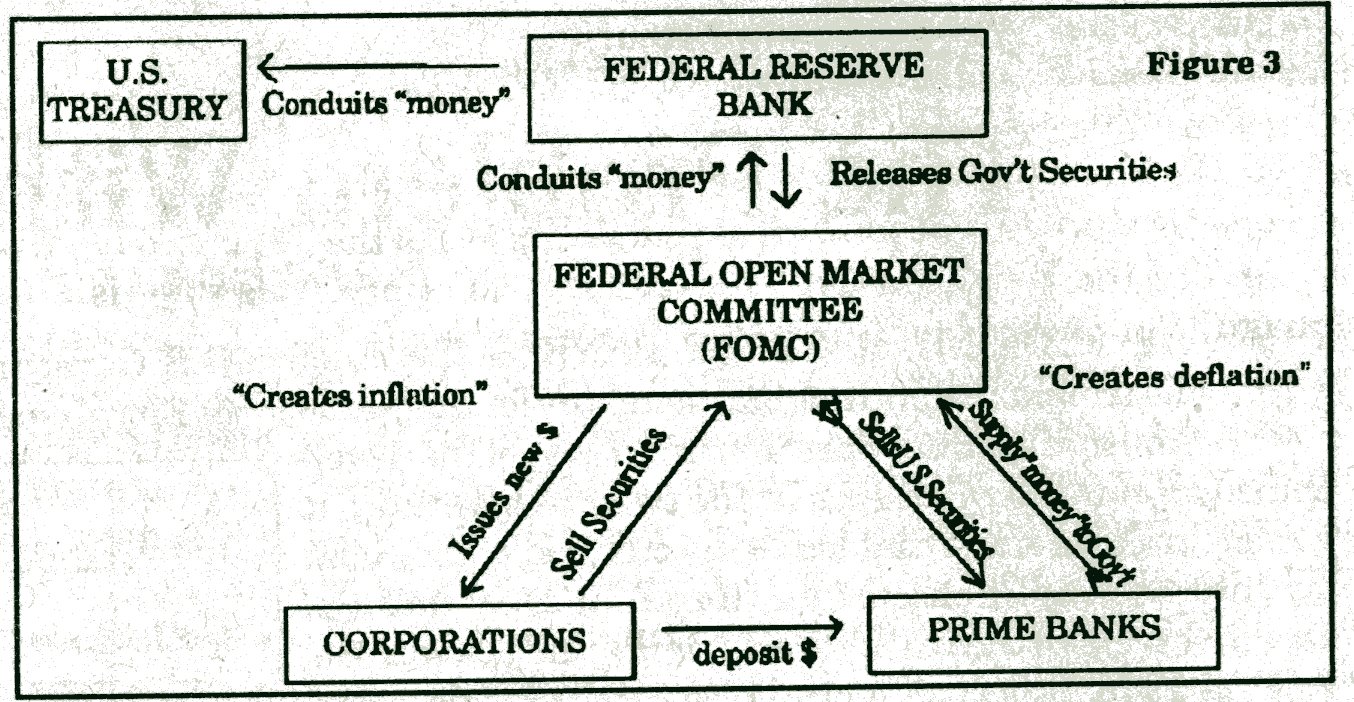
The Federal Open Market Committee (FOMC) is the policy-making arm of the Federal Reserve. It determines short-term interest rates in the U.S. when it decides the overnight rate that banks pay each other for borrowing reserves when a bank has a shortfall in required reserves. This rate is the fed funds rate. The FOMC also determines whether the Fed should add or subtract liquidity in credit markets separately from that related to changes in the fed funds rate. The Fed announces its policy decision (typically whether to change the fed funds target rate) at the end of each FOMC meeting. This is the FOMC announcement. The announcement also includes brief comments on the FOMC's views on the economy and how many FOMC members voted for and how many voted against the policy decision.
The Federal Reserve Explained In 7 Minutes
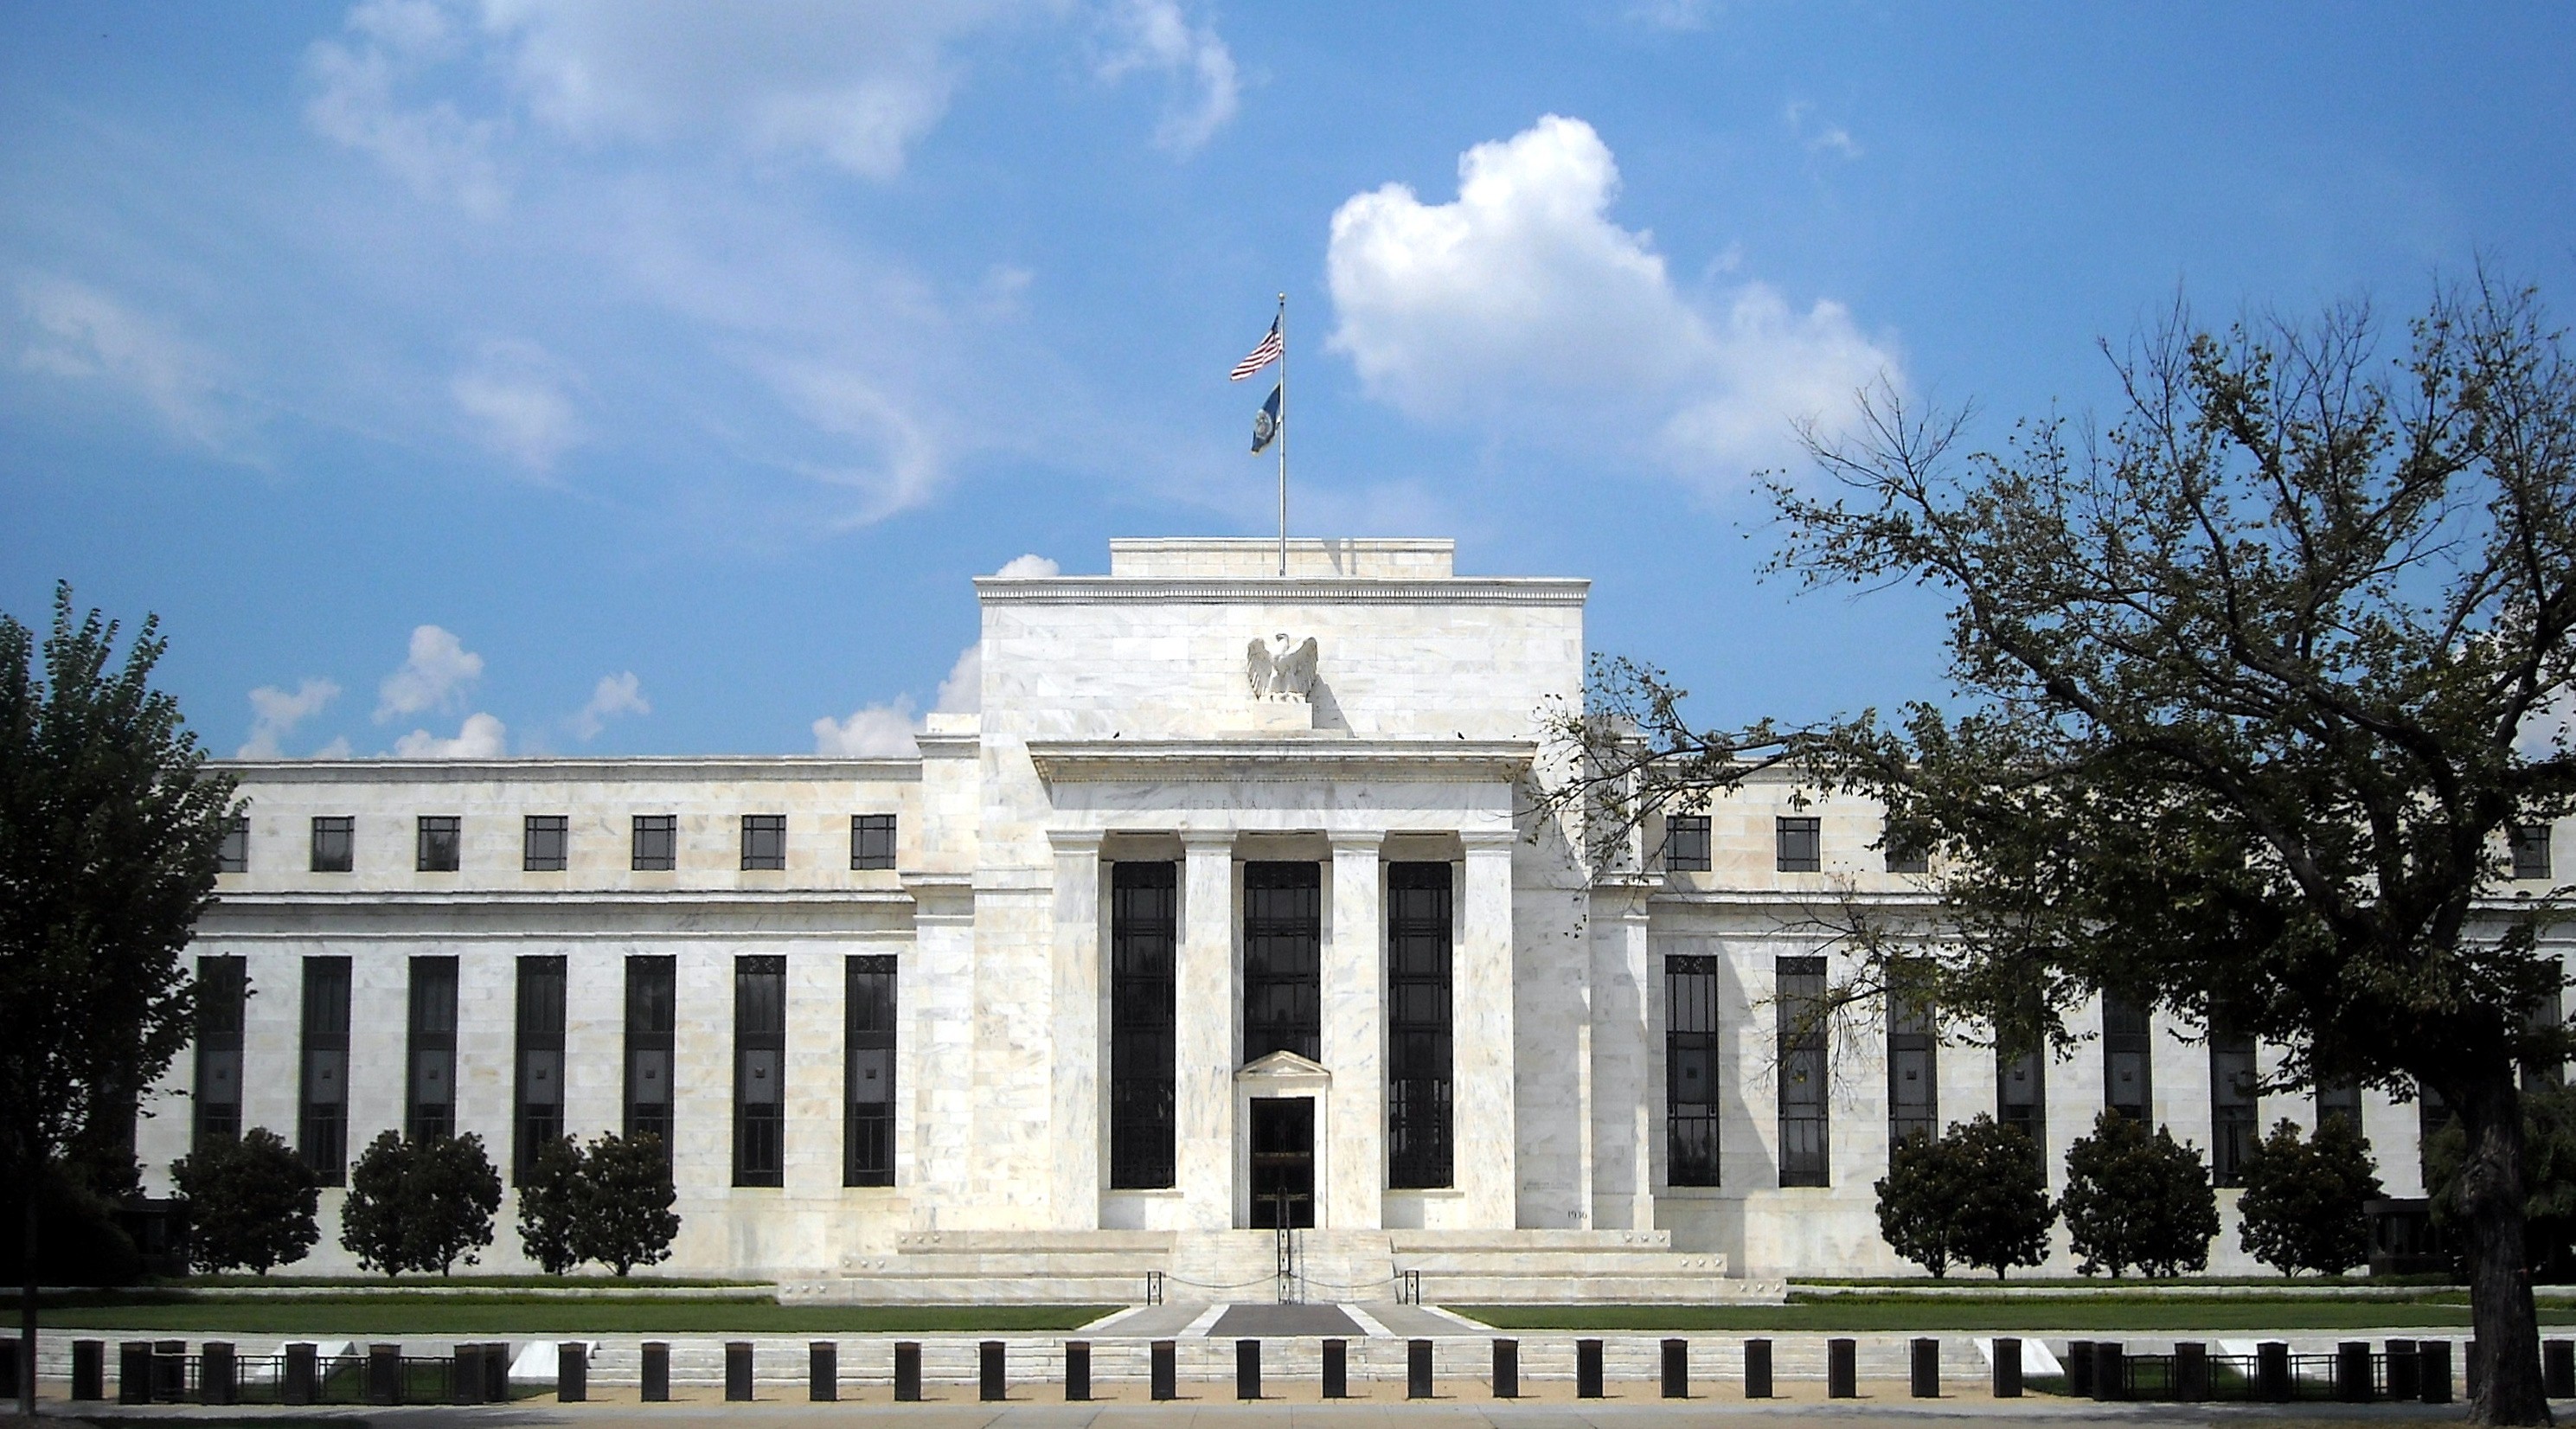
Chair Janet Yellen grabbed everyone’s attention this year when she implied that the Federal Reserve, aka the Fed, may raise interest rates for the first time in six years. The markets have been responding ever since, once again proving that the Fed holds a lot of the cards when it comes to the U.S. economy.
But what exactly is the Fed? And how did it become so powerful? Watch this video to understand:
Ichimoku Strategies Webinar
Ichimoku threads/posts on mql5.com forum
- The theory of the signals
- Ichimoku alert indicator with arrows
- Ichimoku alert indicator improved : warning alert mode was fixed and autosettings feature was added
=============
Ichimoku indicator description
- Tenkan Sen - moving average of the highest high and lowest low over the last 9 trading days. (Highest high + Lowest low) / 2 over the last 9 trading days
- Kijun Sen - moving average of the highest high and lowest low over the last 26 trading days. (Highest high + Lowest low) / 2 over the last 26 trading days.
- Senkou Span A - the average of the Tenkan Sen and Kijun Sen, plotted 26 days ahead. (Tenkan Sen + Kijun Sen) / 2 plotted 26 days ahead
- Senkou Span B
- the average of the highest high and lowest low over the last 52 days,
plotted 26 days ahead. (Highest high + Lowest low) / 2 over the last 52
trading days plotted 26 days ahead.
- Chikou Span - the closing price plotted 26 days behind.
=============
Canada: What is Gross Domestic Product (GDP)?
This video defines the value-added GDP and details how it is measured.
Gross domestic product (GDP) is one of the primary measures used by decision-makers, financial and other institutions to evaluate the health of the economy. An increase in real GDP is interpreted as a sign that the economy is doing well, while a decrease indicates that the economy is not working at its full capacity. Real GDP is linked to other macro economic variables such as employment, economic cycles, productivity and long-term economic growth.
GDP can be calculated according to three methods:
- by income;
- by expenditures; and
- by value added.
- Free trading apps
- Over 8,000 signals for copying
- Economic news for exploring financial markets
You agree to website policy and terms of use
Please upload forex video you consider as interesting one. No direct advertising and no offtopic please.
The comments without video will be deleted.