Can the SB chart be distinguished from the price chart? - page 26
You are missing trading opportunities:
- Free trading apps
- Over 8,000 signals for copying
- Economic news for exploring financial markets
Registration
Log in
You agree to website policy and terms of use
If you do not have an account, please register
a question for the topicstarter.
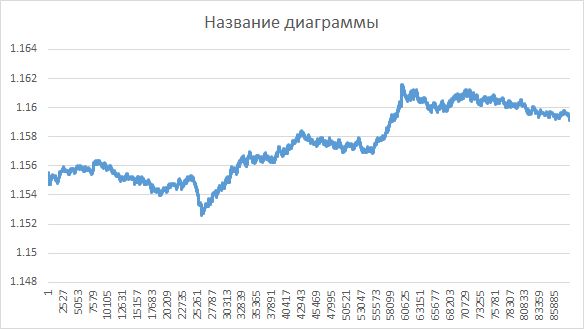
here's the graph.
is this a gsb or a price chart?
Dimitri, don't "poke fun".
There is a section of statistics - hypothesis testing. We have a sample (I checked both price increments with each tick, and just price values with each tick). And then there's the standard test, whether this sample meets the normality criteria of the distribution. We accept the null hypothesis and the alternative hypothesis about the nature of the distribution, calculate the criterion, and reject one of the hypotheses. I mostly used the Shapiro-Wilk criterion as I mostly tested for normality. I also tried touse Chi-Square test for uniformity and normality, and the null hypothesis (of uniform or normal distribution) was also rejected.
I may say something awful, which makes my blood run cold, but I can't refrain... In general half a year ago, communicated with one uncle, more precisely, a grandfather (62 years), professor of mathematics, who at his old age wanted an adventure and he tusanul of university professors in the domestic type of "hedge fund" )))). I have known this person for a long time, since college, we have corresponded and often drink beer, despite the fact that he is almost twice my senior. Well, the last conversation concerned classical statistics, in particular "hypothesis test", which "confused" me a little at university, to be frank, and the stoned professor was also "carried away" by it... about arbitrary quantiles about general arbitrariness of the Boolean dichotomy of confirmation/refutation of hypotheses, etc.. In short the essence of his stream of consciousness, for which he, probably, was very ashamed, as the academic scientist MUST be within the limits of the generally accepted views, is that in reality no statistical hypotheses cannot be reliably tested, more exactly it makes sense only in a very limited context of "sterile" phenomena and experiments, which rarely occur in nature. When dealing with price time series it is more advantageous to use fuzzy hypothesis probability criteria rather than "rigorous" confirmation/confirmation, so for a university economics teacher 97% noise in data means that the series is random, and for a quantum and 99% noise, only 99% noise and 1% signal, which if it can't be directly traded, can at least become a fixture, from combinations of hundreds of which it is still possible to draw 3-5% signal, which can already be used which may be used by professionals as signals.
It doesn't tell you anything. No one will be able to determine systematically.
If you do a study according to all the rules of statistics, i.e. give 100-200 pairs of plots, the guess will be 50/50.
It depends on how to form such a task, if SB series will be cumulative Bernoulli or uniform without heterocessionality, it is not a task but a mockery, but you can creatively generate SB then I think you will be right, but if you get involved in creativity then the border SB/non-SB will blur and it will not be clear to distinguish what from what.
Shame on you, as an academic scientist MUST stay within conventional wisdom, that in reality no statistical hypothesis can be reliably tested,
What do you mean?
Hypothesis testing always involves a level of significance. That is, we accept the hypothesis that has been put forward with that probability (usually 95% or 99%). The meaning of the word "reliable" is apparently 100% certainty ? The professor is absolutely right - no hypothesis can be accepted with this level of significance.
What do you mean?
Hypothesis testing always involves a level of significance. That is, we accept the hypothesis put forward with exactly that probability (usually 95% or 99%). The meaning of the word "reliable" is apparently 100% certainty ? The professor is quite right - no hypothesis can be accepted at that level of significance.
Well yes, maybe I had the wrong interpretation, I thought that one can unambiguously confirm for example "randomness/non-randomness" by some statistical criterion, and it turns out that for one efficient market according to one criteria, for others not so, But then the "science" of such constructions is noticeably reduced, it becomes heuristics, arbitrary, in uni they say unambiguously that "the market is efficient", it makes no sense to speculate on price fluctuations for a long time without insiders, you can only invest for a long time, hoping for long-term economic growth.
And the hypotheses themselves as separate entities make little sense then, what makes more sense are continuous distributions of hypotheses, like probability histograms of which hypotheses at which probabilities are true/probable. In general the very conceptof "statistical hypothesis" is not much shaken as far as I am concerned, if the hypotheses are infinite.
The key word is 'sometimes'.
Yes, the "hospital average" market shows neither reversion nor trending.
The skill of the researcher is to find those moments when properties differ from zero.
More accurately predicting them in the future, anyone can find them on history.
More accurately predict them in the future, anyone can find on history.
You look at people's signals. Some have 95 percent or more profitable trails out of 1000. Do you think they have traded on the history?
The less experience in trading the greater the percentage of noise in the mind.
You look at people's signals. Some have 95 percent or more profitable tracks out of 1,000. Do you think they have traded on history?
it means they are oversubscribed. that's the secret.
I can congratulate you on your assertion.
The spread is outlived by all without exception. Good thinking)).