From theory to practice - page 19
You are missing trading opportunities:
- Free trading apps
- Over 8,000 signals for copying
- Economic news for exploring financial markets
Registration
Log in
You agree to website policy and terms of use
If you do not have an account, please register
Now, just a moment, Vladimir.
1. I am getting real time data for EURJPY, right now. This is the daily statistics from the ECN account from which the DC, according to his assurance, delivers directly from the exchanges.
2. I was deeply impressed by the fact that Nikolay was speaking about the average frequency - 1 tick per 3 seconds, and I have the same data.
3. there is no exponentiality typical of Markovian processes - and this is good. But why the dip in 3 seconds?
What kind of mysticism is this? We don't really believe in it, do we?
Until now I thought we were talking about the OTC market Forex, and it turns out that you have exchanges. Then I'm sorry, my knowledge will not help you.
Nikolai: "The average frequency of ticks in many brokerage companies is 3 - 3.5 sec. You are twisting his words for some reason. Is there no difference for a physicist in your face, exactly 3 or 3-3.5?
You don't haveexponentiality in either of the above figures. The residual (Yet) is too large. Take the integral from 11 to infinity of 69211*exp(-0.7*t) and compare it to 222.
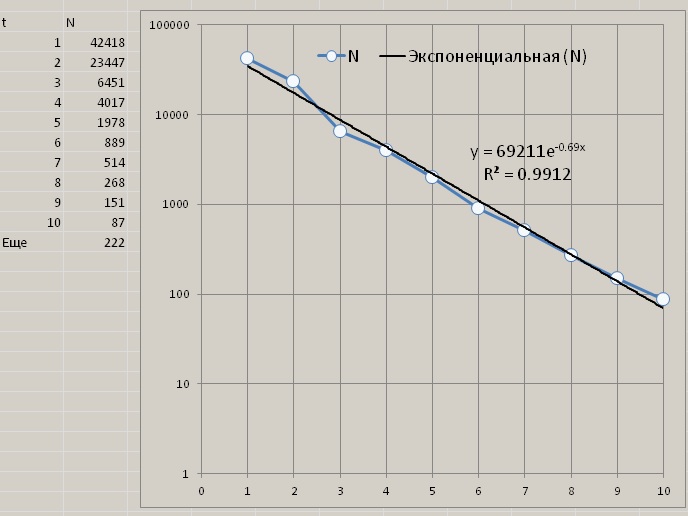
The failure can also be seen in the first picture, if, as is usual when looking for exponential dependences, you put a semi-logarithmic anamorphosis on it.And how do you see trades there, or any results at all? It just draws a quote chart and a channel around it.
Is there any description of the project? It's unreadable - no names, no comments, the scheme is confusing, I don't know what's connected with what, where there is an entry and exit.
What version of Vissim do you have? The 6th version doesn't make any sense.
In addition, there is a dip around 3 seconds, as if the DC is deliberately cutting out the data.
I started a few days ago to make, as you say, exponential increments in time steps at the moments of course reading. When you also explained how to do it (RNG, conversion to exponential law, counting integer part, adding 1 second), I did it too. But then I came to the conclusion that I simply do not understand what I am doing. I did not see the sense in it. I decided to wait. Now I think I understand. Because of your question to everyone - why the failure at 3 seconds. I thought, why shouldn't it be? Tics are less frequent at night, more frequent during the day, then less frequent and less frequent. Hence the many humps and troughs in the sampling frequency distribution by time step between ticks. I thought that the frequency of ticks must be related to market activity. I searched through my code and found some data characterizing this activity. And I built this activity histogram:
It looks like your failure. Or a hump. Now more details. Minutes of USDCHF for 125 weeks from 02.02.2015 till 30.06.207, from OHLC we take OHL and count x = Abs (H - O) y = Abs (O - L) A = max(x,y). Thus, for each minute of the day with number i from 0 to 1439 we obtain activity A(i) for i minute. Not all days in this period were trading, but the total number of such minute activities is still close to 625. For each i, we calculate the average of all available days. In order to ignore outliers, we calculate the median average. In general, we smooth it out as best we can. The goal was to see activity changes over the course of a day. And also the effect of another, moving average, in which the same activity characteristic was applied to the i-minute, but with OHLC over a period symmetrically surrounding the i-minute. For example, for a period of 11 minutes, A(i,11).
The bottom line of the top figure is A(i,5). A moving average with a run ahead of 4 minutes. Even it is not very smooth at 125 weeks, in spite of several hundred data and median averaging. The data A(i) is plotted at the very top, with a "gap". The step numbers in the histogram indicate a gain in activity of 2 5-digit points. All in all, I don't see the point in generating exponential rate momentum steps. Nor do I see any reason to hope to get an exponential or any other distribution in the histograms https://www.mql5.com/ru/forum/221552/page22#comment_6167122.
The very bottom figure only demonstrates that there is a pattern. It shows each of the curves multiplied by the square root of the time period covered (top row, right). Before the multiplication, the values in the curves shown differed by a factor of 18, and after the multiplication, they differed by a factor of 20. This is about the law of the square root.
The topics I have created, I see, are of little interest to anyone.
Tezka, your threads are a rare example of constructiveness on the forum. That they are "of little interest" is only a seeming phenomenon to you. How do you define interest? By participation? I, for example, find them very interesting, but even my engineering education level does not allow me to take an active part in the discussion. And there are quite a few such silent readers, I suspect.
Regarding the nagging and negativity - there is an explanation too. According to official statistics 90-95% of traders are losers. The real statistics is even worse. Negative in your branches comes from these same loser losers, angry about the endless losses and from the envious, unable to perceive and use your approach to trading. Of course, you are more accustomed and comfortable to communicate in a familiar environment of approximately equal level and understanding colleagues. Traders, on the other hand, most of them are nervous and withdrawn. But do not pay attention to the dirt, be above it.
And most importantly: if you do manage to prove that financial markets (especially forex) can be "hacked" using mathematics and physics, it will be a revolutionary breakthrough worthy of a Nobel Prize. You will make history, breathe faith into traders who have spent years and decades to no avail.
Do not stop! Don't give the evil tongues a reason to sneer at "just another physics whiz"!
Here's what I was thinking, my friends.
I see that not many people are interested in the topics I have created. Besides, I am tired of being nagged by ignoramuses for terminology and style of presentation.
So - if anyone needs, copy for yourself selected moments of the discussions. Not my comments, but those of the smart people who participated in the exchange of opinions.
In the evening all the threads I created will be deleted.
Good luck to everyone!
Respectfully,
Alexander_K
Believe me, they are very interesting.
About evil tongues - "good glory lies, bad glory runs". There is always more negativity on the Internet than positivity. Alas.
Here's what I was thinking, my friends.
I see that not many people are interested in the topics I have created. Besides, I am tired of being nagged by ignoramuses for terminology and style of presentation.
So - if anyone wants, copy for yourself selected moments of the discussions. Not my comments, but those of the smart people who participated in the exchange of opinions.
In the evening all the threads I created will be deleted.
Good luck to everyone!
Respectfully,
Alexander_K
Keep writing, may be we`ll get close to the Grail! Where can we go without you! :-)
Write to us, maybe we'll get close to the Grail!
To paraphrase Winnie the Pooh - the Grail is such an object, that if it's there, it's not.
If several of these Grails are placed on MOEX, they will simply stop working and the Grail will disappear - there is not enough liquidity in the glass for several Grails. My guess is that it will last a bit longer on DC Forex.
Here's what I was thinking, my friends.
I see that not many people are interested in the topics I have created. Besides, I am tired of being nagged by ignoramuses for terminology and style of presentation.
So - if anyone wants, copy for yourself selected moments of the discussions. Not my comments, but those of the smart people who participated in the exchange of opinions.
In the evening all the threads I created will be deleted.
Good luck to everyone!
Respectfully,
Alexander_K
Zraz you so, that I found in this thread people who have not written on the forum for years, I thought disappeared already, but no, read the forum only interesting do not find anything. And you have a branch marked. And they always have battles, and sometimes even with virtual fights and bans for a week.
I started a few days ago to make, as you say, exponential time step increments at the moments of course reading. When you also explained how you implemented it (RNG, conversion to the exponential law, counting the integer part, adding the 1st second), I also did it. But then I came to the conclusion that I simply do not understand what I am doing. I did not see the sense in it. I decided to wait. Now I think I understand. Because of your question to everyone - why the failure at 3 seconds. I thought, why shouldn't it be? Tics are less frequent at night, more frequent during the day, then less frequent and less frequent. Hence the many humps and troughs in the sampling frequency distribution by time step between ticks. I thought that the frequency of ticks must be related to market activity. I searched through my code and found some data characterizing this activity. And I built this activity histogram:
It looks like your failure. Or a hump. Now more details. Minutes of USDCHF for 125 weeks from 02.02.2015 till 30.06.207, from OHLC we take OHL and count x = Abs (H - O) y = Abs (O - L) A = max(x,y). Thus, for each minute of the day with number i from 0 to 1439 we obtain activity A(i) for i minute. Not all days in this period were trading, but the total number of such minute activities is still close to 625. For each i, we calculate the average of all available days. In order to ignore outliers, we calculate the median average. In general, we smooth it out as best we can. The goal was to see how activity changes over the course of a day. And also the effect of another, moving average, in which the same activity characteristic was applied to the i-minute, but with OHLC over a period symmetrically surrounding the i-minute. For example, for a period of 11 minutes, A(i,11).
The bottom line of the top figure is A(i,5). A moving average with a run ahead of 4 minutes. Even it is not very smooth at 125 weeks, in spite of several hundred data and median averaging. The data A(i) is plotted at the very top, with a "gap". The step numbers in the histogram indicate a gain in activity of 2 5-digit points. All in all, I don't see the point in generating exponential rate momentum steps. I also don't see any reason to hope to get an exponential or any other distribution in the histograms https://www.mql5.com/ru/forum/221552/page22#comment_6167122
The bottom figure only demonstrates that there is a pattern. On it, each of the curves is multiplied by the square root of the time period covered (top row, right). Before the multiplication, the values in the curves shown differed by a factor of 18, and after the multiplication, they differed by a factor of 20. This is about the law of the square root.
Congratulations you have discovered the forex sessions )))
The first little rise at the beginning of the chart is Sydney (Australian session)
The second one, also not very big, is Tokyo (Asian session)
At the end of the Asian session Europe opens and for about an hour they trade together.
And finally the last peak is the end of Europe and the beginning of the Americas.
Here's what I was thinking, my friends.
I see that not many people are interested in the topics I have created. Besides, I am tired of being nagged by ignoramuses for terminology and style of presentation.
So - if anyone wants, copy for yourself selected moments of the discussions. Not my comments, but those of the smart people who participated in the exchange of opinions.
In the evening all the threads I created will be deleted.
Good luck to everyone!
Respectfully,
Alexander_K
Personally for me the most interesting forum topic for all the time I've been here. And that's if you take into account that everything written here is difficult for me to understand.