yeah i think so too but the point is the correct evaluation of such a connection should give 50 on most of them. right? by the way have you tested your theory on the order and 8 minutes?
That's where I started.
on M1 you can clearly see the movement in that time, from and to, and... then a flat.
Just don't count the candles, look at the time.
no index will help you until you start to see what's going on and why on the chart
on M1 you can clearly see the movements during this time, from and to and ... then a flat
just don't count the candles, look at the time.
The sticky instrument will not help you unless you can see on the chart what's going on and why
i have a very intensive experience of five years, i've been struggling with the same regime as Alexander_K has been struggling with for the past two weeks, except i've been programming in two languages and created my own terminals - similar to MT4 on java and robots with indicators on mql.
I have a really bold question:)
Do you really think you can tell "why" a movement is happening on the chart?)
the chart is already an indicator of the trading history
which is what makes the price move.
mostly - overestimated, as close to the price as possible unreasonable risk
I mean, from this point of view.
the simplest description, the equivalent formula for price increase: delta_price=sellVolume-buyVolume
look where the USDCAD is and look here:
In general - nothing new, but it loses as always to the majority.
;)
But how to see it on the chart - that's another story, but a little higher, and not just a little too, and not once in this thread and not only, I've already mentioned it...
Oooh! I remember remember these charts, they were posted in the branch where we decided whether the price was random or not).
By the way, by the way - what are these charts?
1) On the basis of what (if we take only the principle) are they built?
2) Relative to which period are these characteristics evaluated?
3) Why are these charts so accessible to most traders (if available)?
It`s nothing personal, just like a professional to a professional.
As for the losses, yes, you're right, the market has some kind of law of stabilization, or as it is called the efficient market theory (frustrated because according to this theory the price should follow a straight horizontal line and then jump to different levels), the market closes the "gaps", where it makes some extra money, except for the political background.
When I look at my model, if there are some clear segments where the price can make some profit, it literally "pulls" to them. And the closer it is to that area, the more chaotic its behaviour is.
I've noticed from my trend-flat model that if my model has a clear area where you could make a profit, the price "pulls" there. And the closer it gets to that area, the more chaotic it gets.
of course
I've noticed this for about 6 years, but the formula is a nut.
yes, there are questions based on naked logic that will find their answers, except for the 3rd one.
3) because buying on the hay is promising, but until the sellers have their deposits wiped out, and then there will be those who bought unsuccessfully
But then there is also a high risk of getting dumped on the multilevel market noise... Because of the struggle between the conditional "buyers" and "sellers".
Martin Cheguevara: But then there is also a high risk of merging in the multi-level market noise... Because of the struggle between conventional 'buyers' and 'sellers'.
In that proportion, the fight is irrelevant and the price is definitely going against the sellers:
Martin Cheguevara: Yes there is and it's very simple called the coefficient of variation.)
Read about it I suggest. This coefficient has done me a great disservice.
This coefficient doesn't show plots it shows "extreme" states of the market price - an absolute flat and complete chaos. and what do you think between these states have in common?) Correct! Outliers)
You won't believe me, but whenever I hear the word average... ...I'm instantly terrified.
You can't apply this formula to forex, because averaging of any kind usually leads to late buying or selling and there will be a loss.
Allow the use of cookies to log in to the MQL5.com website.
Please enable the necessary setting in your browser, otherwise you will not be able to log in.
You are signed in. Two-factor authentication has been disabled. Set it up again and scan a new QR code, or continue with two-factor authentication disabled.
ahah crafty)))
yeah i think so too but the point is the correct evaluation of such a connection should give 50 on most of them. right? by the way have you tested your theory on the order and 8 minutes?
That's where I started.
on M1 you can clearly see the movement in that time, from and to, and... then a flat.
Just don't count the candles, look at the time.
no index will help you until you start to see what's going on and why on the chart
That's where I started.
on M1 you can clearly see the movements during this time, from and to and ... then a flat
just don't count the candles, look at the time.
The sticky instrument will not help you unless you can see on the chart what's going on and why
i have a very intensive experience of five years, i've been struggling with the same regime as Alexander_K has been struggling with for the past two weeks, except i've been programming in two languages and created my own terminals - similar to MT4 on java and robots with indicators on mql.
I have a really bold question:)
Do you really think you can tell "why" a movement is happening on the chart?)
I have a very busy five years, I've been pushing for the last two weeks in about the same way that AlenaK has been pushing for about five years.
I have a covaaaaar question:)
Do you really think you can tell "why" a movement is happening on a chart?)
the chart is already an indicator of the trading history
what is it that makes the price move?
it's basically an overestimation, as close to the price as possible
here's how it is from this point of view
the simplest description, the equivalent formula for price increase: delta_price=sellVolume-buyVolume
look where the USDCAD is now and look here:
Forum on trading, automated trading systems and trading strategies testing
FOREX - Trends, predictions and implications 2018
sterva, 2018.12.20 20:46
There's only one thing that confuses me with the Canadian.
I reversed it, but.......
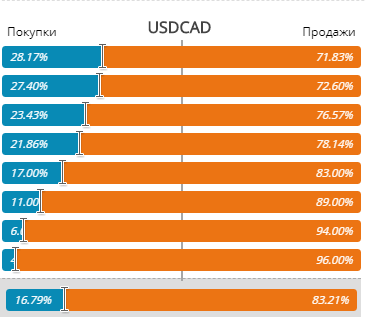
All in all - nothing new, but loses as always most
;)
the chart is already an indicator of the trading history
which is what makes the price move.
mostly - overestimated, as close to the price as possible unreasonable risk
I mean, from this point of view.
the simplest description, the equivalent formula for price increase: delta_price=sellVolume-buyVolume
look where the USDCAD is and look here:
In general - nothing new, but it loses as always to the majority.
;)
I remember those charts when we tried to decide if the price is random or not).
There are only logical questions that can be answered, except for the 3rd one
3) because it is promising to buy on hawks, but only until the sellers run out of deposits, and then there will be those who failed to buy
of course
I've noticed this for about 6 years, but the formula is a nut.
yes, there are questions based on naked logic that will find their answers, except for the 3rd one.
3) because buying on the hay is promising, but until the sellers have their deposits wiped out, and then there will be those who bought unsuccessfully
But then there is also a high risk of merging in the multi-level market noise... Because of the struggle between conventional 'buyers' and 'sellers'.
In that proportion, the fight is irrelevant and the price is definitely going against the sellers:
In this proportion the struggle is irrelevant and the price is definitely going against the sellers:
Yes there is and it's very simple called the coefficient of variation.)
You won't believe me, but whenever I hear the word average... ...I'm instantly terrified.
You can't apply this formula to forex, because averaging of any kind usually leads to late buying or selling and there will be a loss.