How to trade triangle patterns ? Where to Enter and where to Exit?
I think you post is inappropriate and video in it.
The name of the video is the following:
How to Trade Symmetrical Triangles
We do not need to have special commercial tool to trade those patterns. Because there are a lot of free tools on CodeBase which we all can
use.
----------------
This is the video which I found (I spent less then 5 minutes to find).
If you do not like this video (which I found) so you can
found the other video (or you can cr eate the video) which can help to all of use to trade symmetric triangle patterns using free tools from
CodeBase.

- 2019.08.24
- www.mql5.com
Forum on trading, automated trading systems and testing trading strategies
Sergey Golubev, 2014.03.29 08:51
How to Trade a Triangle (based on dailyfx article)- GBPJPY broke out of a 967 pip symmetrical triangle that had a target over 180.00
- The advance from the breakout point of 171.13 was halted at 173.56 and price turned down
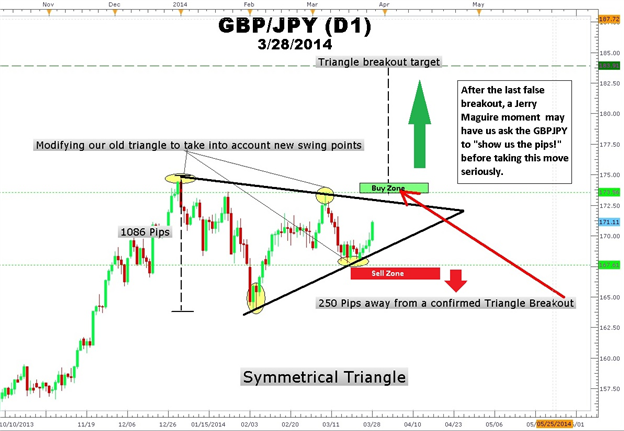
- A new triangle can be drawn taking into account the new swing points created by the false breakout
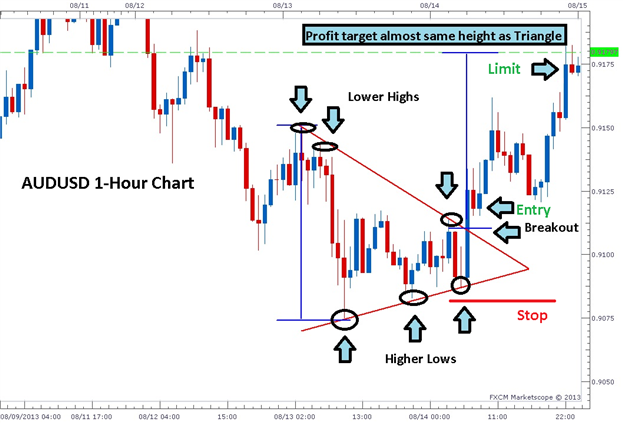
Not only can the stop be placed just outside the pattern, but a limit can be determined by measuring the height of the pattern and projecting this distance in pips from the breakout point. This is called a measurement objective.
Thomas Bulkowski in his book, Encyclopedia of Chart Patterns stated that symmetrical triangles meet their upside targets 66% of the time. However, the recent GBPJPY triangle that was posted in my March 4th 2014 article was part of the 33% of triangle breakout failures.
Learn Forex – GBPJPY Symmetrical Triangle False Breakout
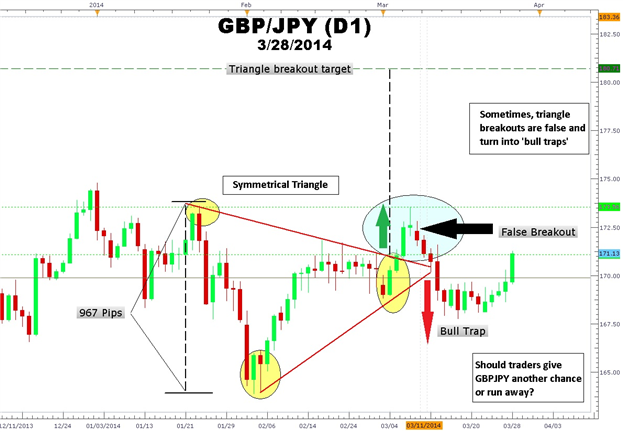
As you can see in the chart above of the GBPJPY symmetrical triangle, a breakout happened at 171.13. Initially, wide ranging candlesticks breaking above the top of the symmetrical triangle may have led traders to believe the up move had more to go. However, the doji candlestick pattern was joined by a bearish candlestick forming a Japanese candlestick evening star pattern at 173.56 capped this rally.
From this point, we can see an acceleration in bearish price action as a series or red candlesticks form Bullish breakout traders are now caught in what is called a “bull trap” in the 167.60 area. Stops are triggered and longs are shaken out. Today, we see a strong surge in yen weakness and GBPJPY rebounds. The question now is, “Should traders give GBPJPY another chance?”
Learn Forex – GBPJPY Daily Chart Revised Symmetrical Triangle
A New Triangle Emerges
If the fundamental and technical reasons that existed when the trade was made still exist after a stop out, then we would consider re-entering the trade. However, forex triangle traders may make modifications to the initial triangle in order to take into account the new swing highs and swing lows.
First of all, the new swing high which was created by the false breakout is connected to a higher previous high. Next, the new swing low which was created by breakout below support is connected by an upward sloping trend line from the previous swing low. The result is a new symmetrical triangle with new buy and sell parameters. New limits are set as well.
How to Trade this New Triangle
The breakout method for trading a symmetrical triangle has not changed. However, the triangle has become bigger. Despite the big GBPJPY big 350-pip run-up today to 171.05, GBPJPY is another 250 pips from making a confirmed triangle breakout. Triangle resistance is at 172.70 area making a long GBPJPY trade too early of a proposition now.
If and when GBPJPY trades above 173.56, a stop can be placed beneath the last swing low of the triangle at around 167.40 with an upside target of 183.91. On the other hand, a close below 167.40 would trigger a sell signal for a bears to trade the triangle south with a target of 156.75.
After the last false breakout, traders may ask GBPJPY to “show them the pips” with a confirmed triangle breakout before going long GBPJPY a second time
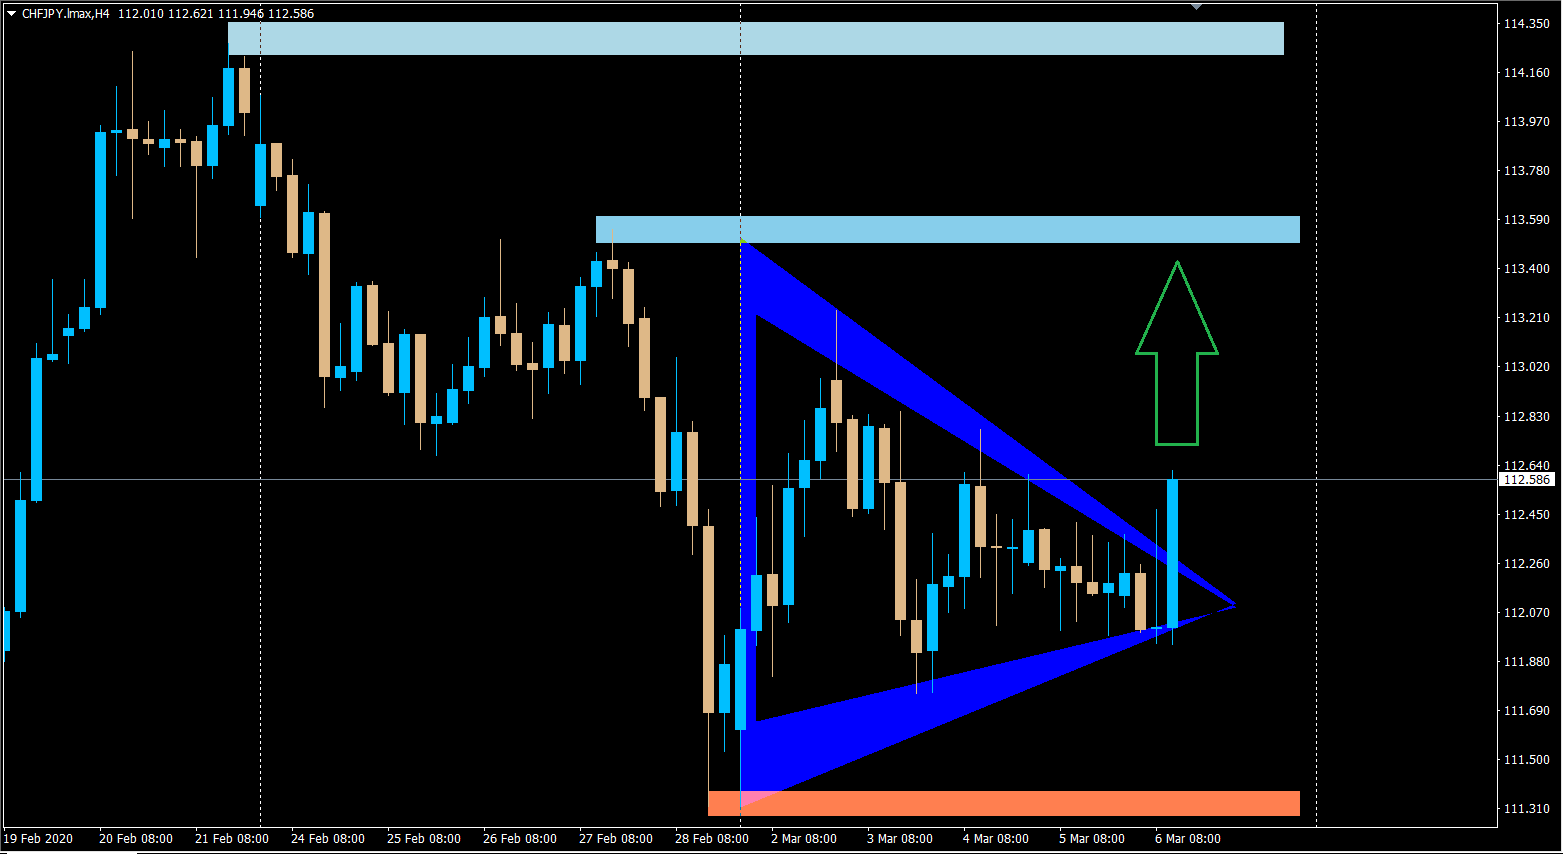
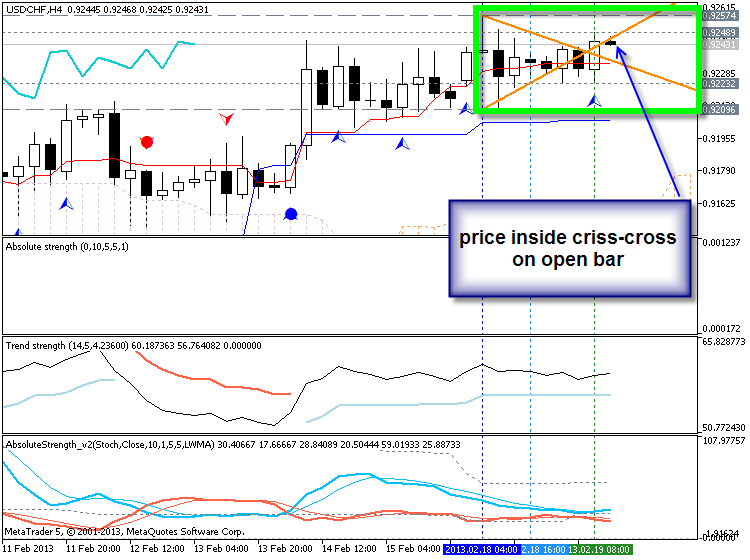
It seems a solid breakout in H4 Timeframe.
Forum on trading, automated trading systems and testing trading strategies
Market Condition Evaluation based on standard indicators in Metatrader 5
Sergey Golubev, 2013.09.05 09:53
3 Easy Triangle Patterns Every Forex Trader Should Know - Symmetrical Triangle
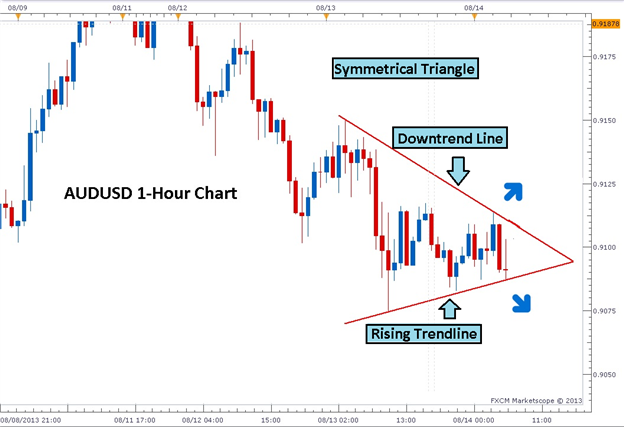
The first type of pattern is the symmetrical triangle pattern. It is formed by two intersecting trendlines of similar slope
converging at a point called the apex.
In the above example of a symmetrical triangle you can easily see on the AUDUSD 1-Hour chart the intersection of a rising trendline and a downtrend line at the bottom of a larger trend. Sellers are unable to push prices lower and buyers can’t push price to new highs.
Examples -
and from post #705 -
----------------
The following free indicator from CodeBase is used for patterns:
MaksiGen_Range_Move
MTF - indicator for MetaTrader 5

- 2013.11.05
- www.mql5.com
Examples -
and from post #705 -
----------------
The following free indicator from CodeBase is used for patterns:
MaksiGen_Range_Move
MTF - indicator for MetaTrader 5
Thank you so much.Sergey golubev.
If you go to this thread https://www.mql5.com/en/forum/12423/page667
so you will find some indicators from CodeBase (on almost every post).
Absolute Strength indicator?
Let me check ...
Yes,
it is on post #6635 (in the end of the post by the
link to the other post) - this post with the links: #475
-
----------------
AbsoluteStrength - indicator for MetaTrader 5
Fixed
version and how to use - this page https://www.mql5.com/en/forum/10401

- 2020.03.04
- www.mql5.com
- Free trading apps
- Over 8,000 signals for copying
- Economic news for exploring financial markets
You agree to website policy and terms of use
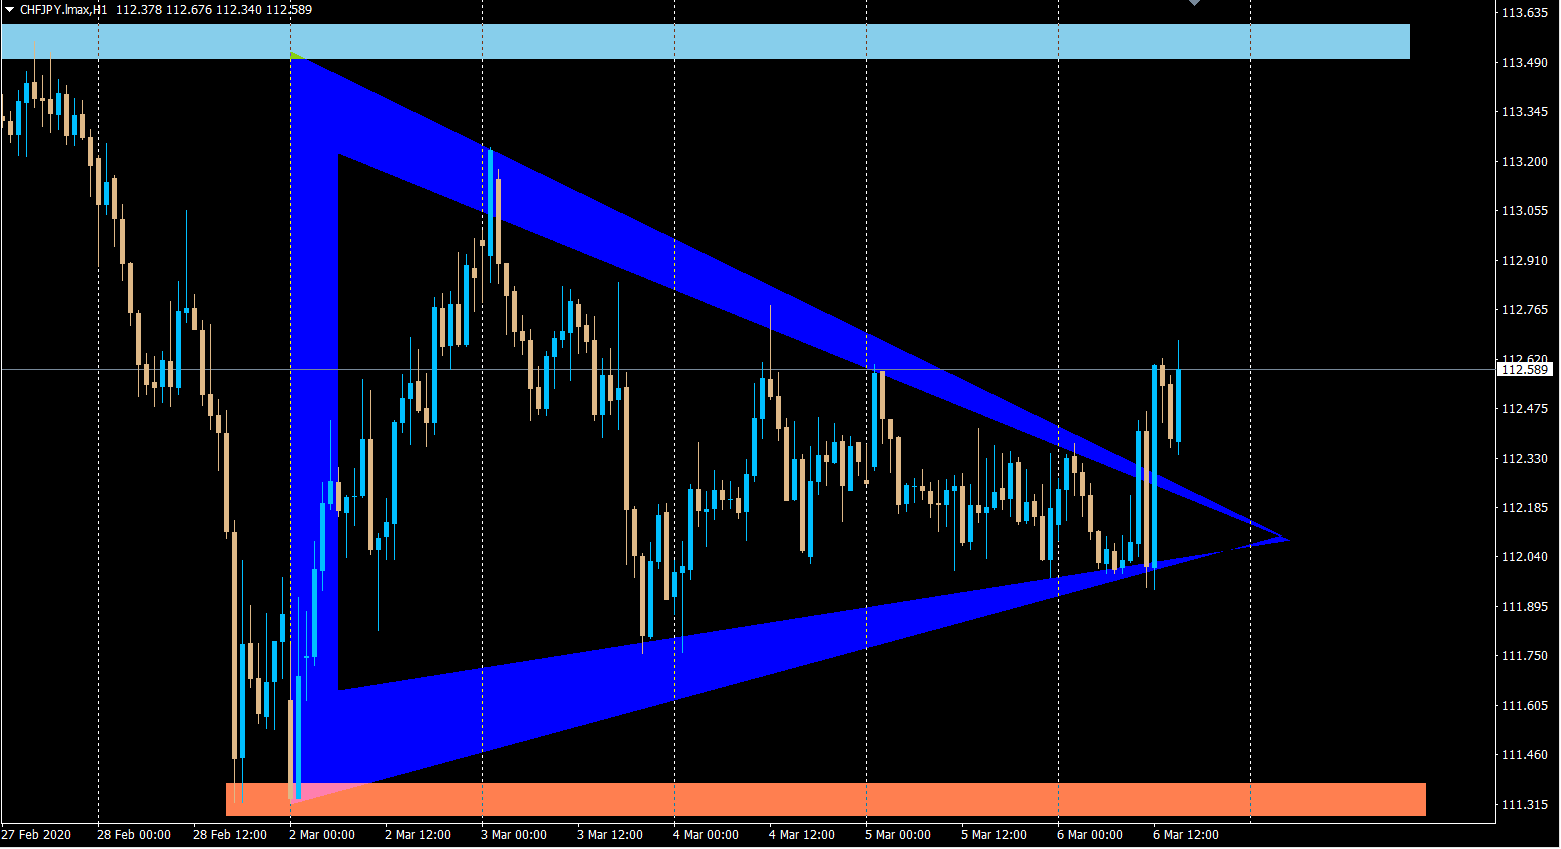
There is a Live symmetrical Triangle Pattern formed in CHFJPY - 06-03-2020
Since Symmetrical Triangle Patterns are trend continuation pattern,and the live trend in bullish in major trend and bearish in minor trend in CHFJPY.
*Is it a valid pattern ?
*How to calculate breakout levels ?
*Should I look for BUY or SELL Breakout ?
*Should i enter immediately after the breakout ?
*where to set trade Exits (SL AND TP)?
(Looking for knowledgeable conversation on this triangle trading patterns)