Indicators: AbsoluteStrength
Hot to use this indicator :
newdigital, 2013.07.01 21:04
How can we know: correction, or bullish etc (in case of using indicator for example)?
well ... let's take AbsoluteStrength indicator from MT5 CodeBase.
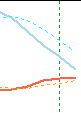
bullish (Bull market) :
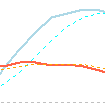
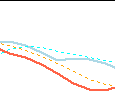
bearish (Bear market) :
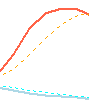
ranging (choppy market - means: buy and sell on the same time) :
flat (sideways market - means: no buy and no sell) :
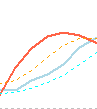
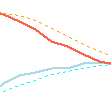
correction :
correction in a bear market (Bear Market Rally) :
Choosing [Refresh] menu item causes indicator to give strange results.
How to reproduce:
(1) This is the indicator added to a chart
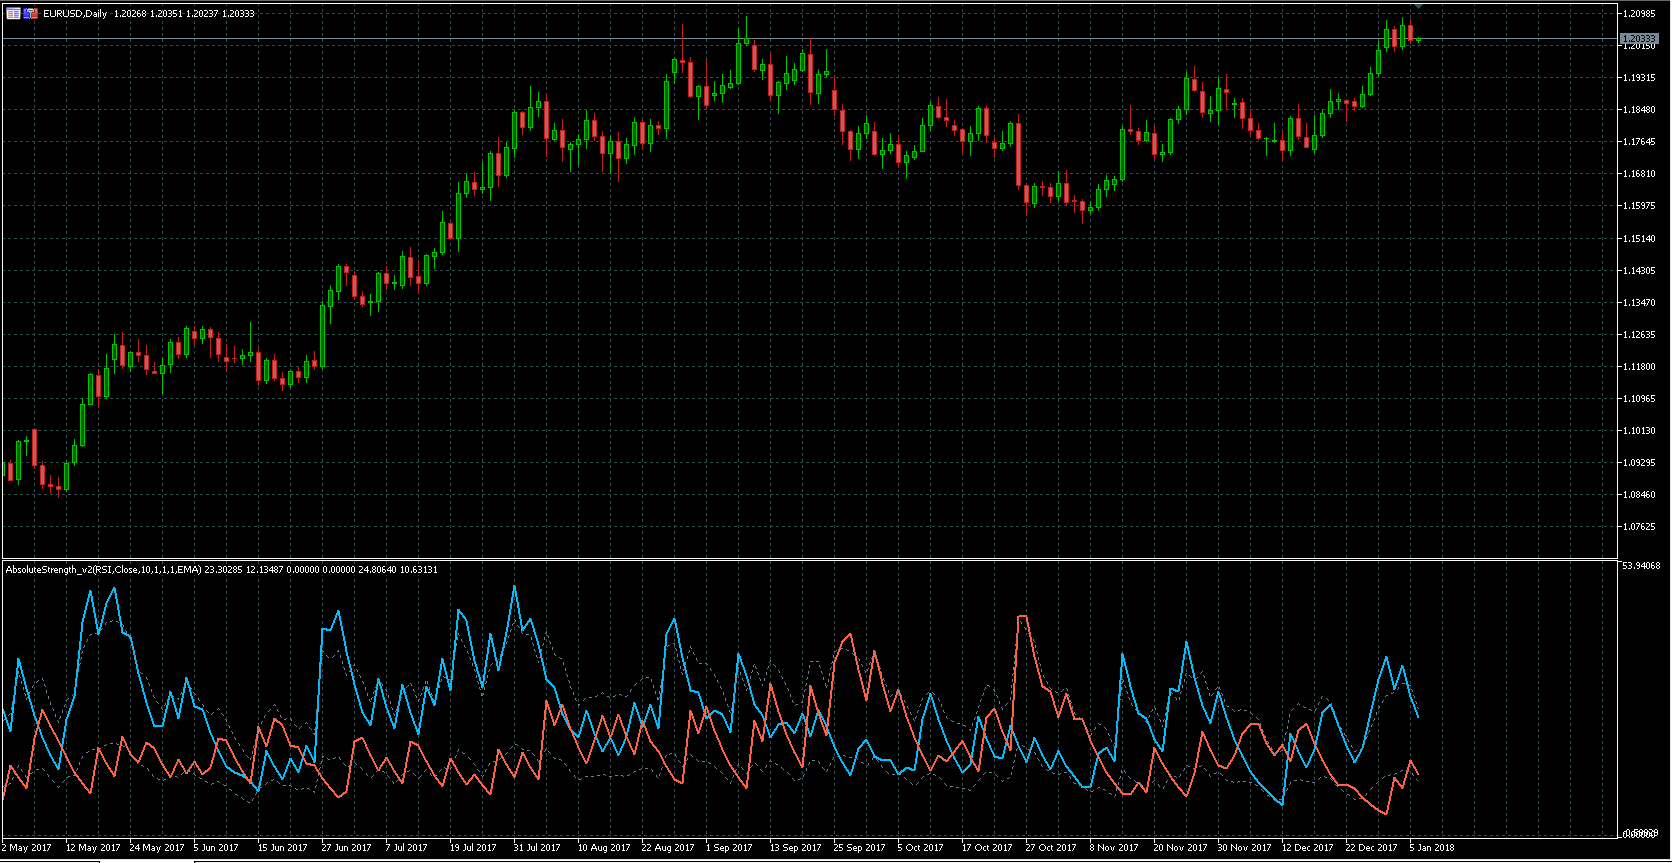
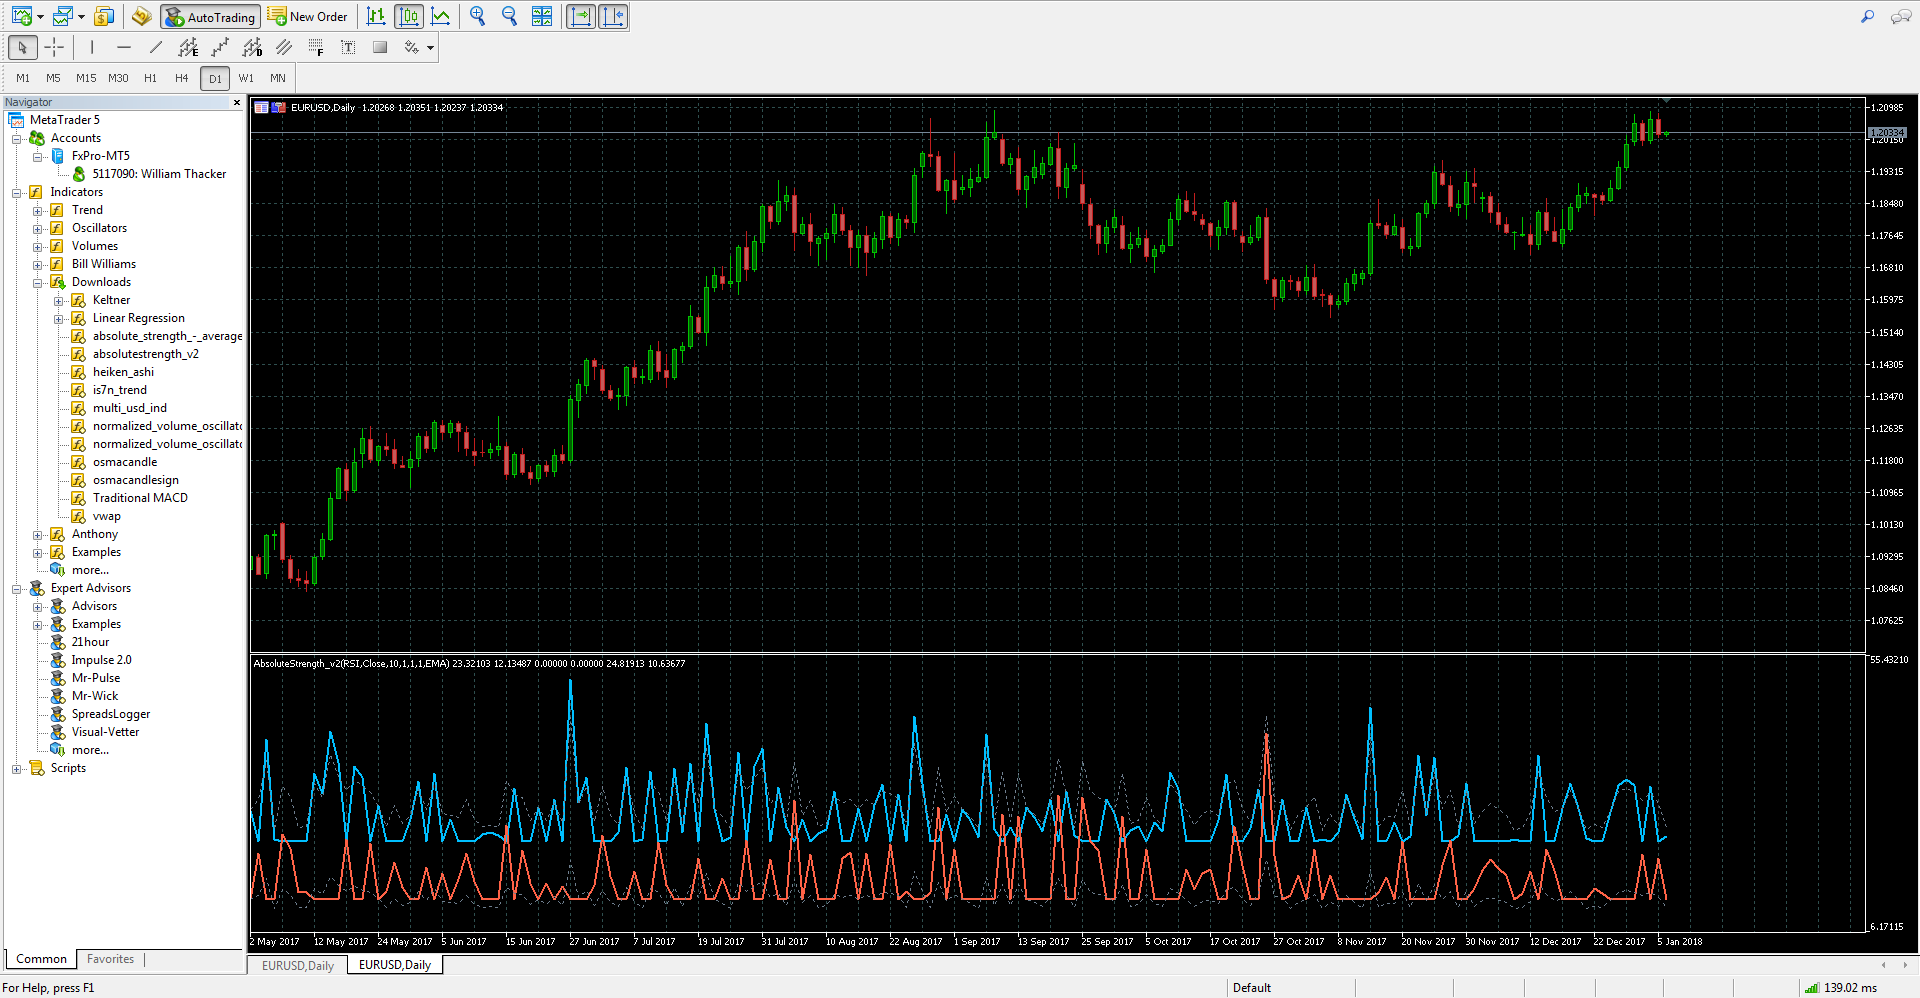
(2) Now choose the [Refresh] menu item

(3) Note the strange appearance of the blue and red lines as compared to (1) above.

Fixed (fixed version attached).

I am having having above error, is this error coming because of old build. currently i have following build:

Thanks for the indicator, Igor!
'iTime' error still in place... Could you fix it please?
Best Regards, Andrei.
Fixed (fixed version attached).
what paramenter do you use in your sar indicator in this H1 timeframe or m15 trading timeframe?
Choosing [Refresh] menu item causes indicator to give strange results.
How to reproduce:
(1) This is the indicator added to a chart
(2) Now choose the [Refresh] menu item
(3) Note the strange appearance of the blue and red lines as compared to (1) above.
Is there a fix to this problem?I am still experiencing, after a few hours, the lines are distorted and even refresh button is used. @Sergey Golubev

- Free trading apps
- Over 8,000 signals for copying
- Economic news for exploring financial markets
You agree to website policy and terms of use
AbsoluteStrength:
The oscillator that displays forces of Buyers (Bulls) and Sellers (Bears) separately.
Author: Igor Durkin