How to create a scanner
- Determining how previous order closed
- breakouts in hourly chart
- [ARCHIVE]Any rookie question, so as not to clutter up the forum. Professionals, don't pass it by. Can't go anywhere without you - 5.
This is the examples -
----------------
CodeBase
- Volatility Trader and Breakout EA (X-liquidex) - expert for MetaTrader 4
- Breakthrough volatility - expert for MetaTrader 4
- Stretch Breakout Channel - indicator for MetaTrader 4
- Example of A Simple Breakout Trading Robot - expert for MetaTrader 4
- 2 Days Breakout - expert for MetaTrader
- Last Kiss Breakout - expert for MetaTrader 4
- 2 MA Channel Breakout - indicator for MetaTrader 4
- Multi-Trendlines Breakout - expert for MetaTrader 4
- Consolidation Breakout - expert for MetaTrader 4
- more on CodeBase here.
Articles
Forum on trading, automated trading systems and testing trading strategies
Indicators: Dserg - LinRegression Breakout
Sergey Golubev, 2014.02.07 04:32
Trading the Break (adapted from dailyfx article)
- Breakouts emanate from range-bound markets as new information pushes prices higher or lower.
- These breaks can often be accompanied with increased volatility that can prove devastating
- Risk-Reward ratios are of the upmost importance, so traders can mitigate the damage of false breakouts while maximizing the reward of successful entries.
Since future price movements are, in essence, unpredictable; identifying
with and trading in the direction of the trend gives the trader the
chance to jump on the side of any bias that may have been seen in the
market. And if those biases (trends) are to continue, the trader can
potentially make three, four, or five times the amount they put up to
risk.
Unfortunately, trends don’t always exist. More common is the condition with which prices aren’t displaying some element of a bias; when prices move in a range-bound fashion for an extended period of time. And because there is a lack of a bias, knowing how to trade in these situations can be quite a bit more difficult. But traders have two choices: They can trade as if the range is going to continue, or they can trade the range in the expectation of a breakout of those range-bound prices.
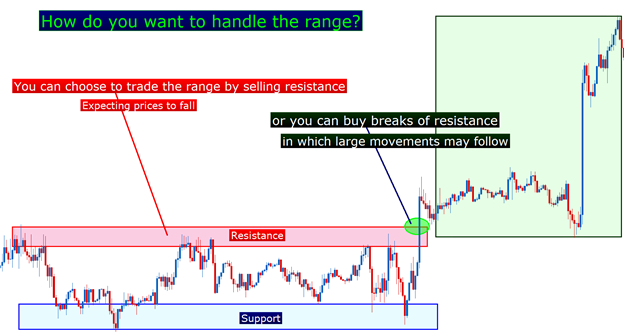
Breakouts
When prices do break-out from a range, the movement can be fast,
violent, and extremely large. Imagine a rubber band being pulled all the
way back, until eventually it pops; that’s somewhat similar to what can
happen when a breakout takes place.
Trading a breakout is not for the faint of heart. Often the breakout
will come from a news event, or a data announcement, or some other
reason that causes traders to push prices being the previously defined
support and resistance levels.
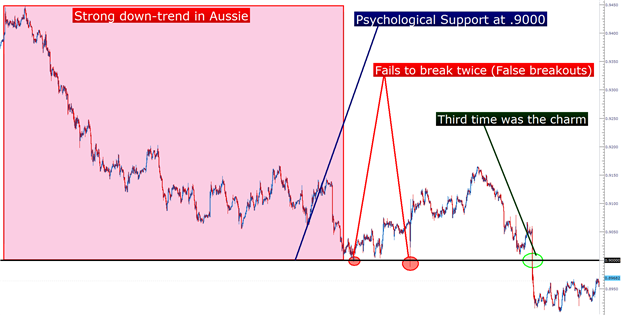
It often takes more than one attempt to catch a breakout
It’s this extreme pickup in volatility that makes trading breakouts so
difficult; as the accompanying price movements can swing dangerously in
both directions, and there will be many instances in which support
and/or resistance get broken, only to see prices reverse and move in the
opposite direction. This is the dreaded ‘false breakout.’
Because of the heightened volatility around such events, and given the
risk of false breakouts; traders often need to focus more heavily on
risk and reward while being more aggressive: cutting losers even quicker
while also looking for larger profit targets when they find themselves
on the right side of the trade.
Probabilities
Traders will often assign a lower probability of success to breakout
strategies because of the aforementioned reasons. If a trader thinks
they can usually win 1 out of every two trend trades, they will often
look to win 1 of every 4 breakout trades.
And because breakouts have a lower probability of success, traders need to adjust risk-reward ratios accordingly: Looking at even tighter stops, and even larger profit targets.
So, we’ve warned you against the risks of trading breakouts; a logical
question that follows is often ‘why would anyone trade breakouts when
there might be a trend somewhere that can be traded?’
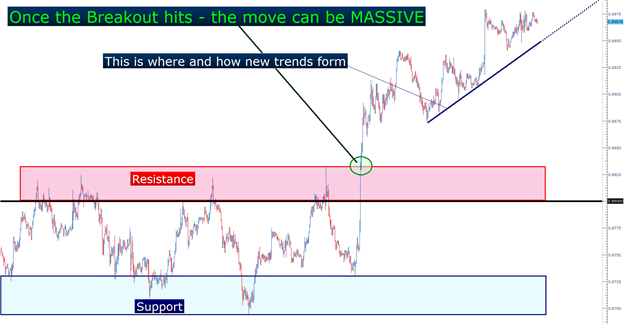
Well, the beauty of the breakout is in the potential. When a breakout
does work, the upside can potentially be huge (just like the downside is
huge, but can be addressed or offset with tighter stops).
New trends often form from an initial breakout; and this is a very natural life-cycle in financial markets. Let’s look at an example to illustrate
How to Trade Breakouts
The key ingredient to trading a breakout is Support and/or Resistance.
These levels that may see changes in order flow are the same prices that
traders can look to enter upon breaks.
Pivot Points are an extremely common option for breakout traders.
Traders can look to these price levels for potential breakout moves,
while placing entry orders just outside of these prices so that once a
pivot point yields to a price surge, the entry is initiated and the
trader is in the position.
Another common option for trading breakouts is including the Price
Channels indicator (often called ‘Donchian Channels,’ after famed
breakout-trader Richard Donchian). Price Channels will show the highest
high, and the lowest low over the past x periods (x being the number of
candles input by the trader). When prices approach these levels, they
may go on to make higher highs, or lower lows; and this is the essence
of a breakout entry.
The same type of logic can be utilized around psychological whole
numbers, or round levels like 1.3500 on EURUSD or .9000 on AUDUSD. These
round-number price levels will often see a large number of stops or
limits, and this can stop a trend dead in its tracks, at least
temporarily. But when a subsequent approach towards that level takes
place, the number of stops or limits may not be able to hold back the
surge of selling (or buying in the case of an up-trend).
This leads to one of the more common ways of trading breakouts;
incorporating price action and previous market movements into the
analysis.
Forum on trading, automated trading systems and testing trading strategies
Sergey Golubev, 2013.11.13 07:42
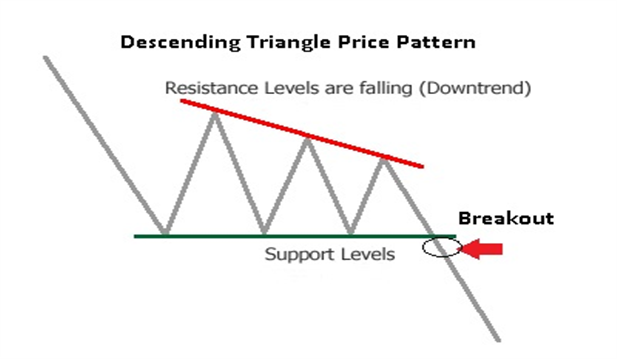
How to Trade a Descending Triangle
Talking Points
- Triangle price patterns can be used in Forex trading to identify potential breakout setups
- Descending triangles form when a rising trend line and a horizontal support line converge
- Traders can look for the breakout from the descending triangle to signal the continuation of the AUDJPY down move.
===============
What is a Descending Triangle pattern?
A descending triangle pattern is consolidation price pattern composed of
lower swing highs pushed lower by an established downtrend line
converging with a horizontal support made up of a series of swing lows
located in roughly the same area. Another name for the descending
triangle is the right triangle pattern due to its similarity to the
geometric shape of the same name. The height of the triangle meets the
horizontal support at a 90 degree angle.
Usually, descending triangles form as profit taking by sellers is met
with bargain hunting buyers. However, the buying pressure is mutted as
higher lows are not made. A news release or economic announcement could
be the catalyst required to push price out of this coil tilting the
balance strongly in the seller's favor. Unlike its cousins, the
symmetrical triangle and ascending triangle, the descending lacks
significant bullish participation indicated by that lack of higher lows.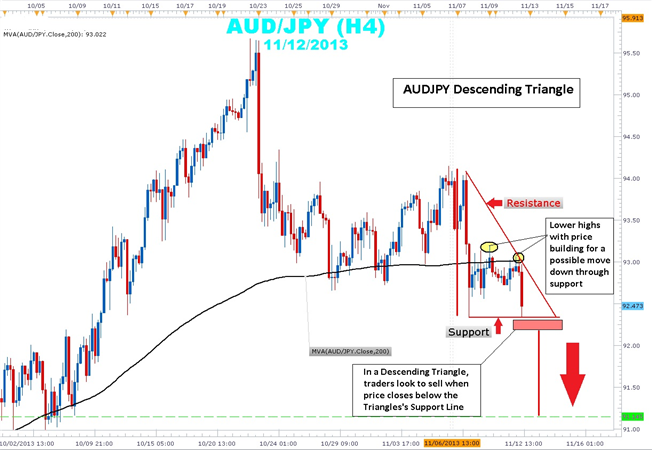
Taking a look at the current AUDJPY 4-hour chart, you can clearly see
price action bound between a descending trend line that connects the
11/6 swing high of 94.15 to 11/12 swing high of 93.05. This swing high
is a lower swing high than the 11/10 93.19 swing high showing the
building strength in the downtrend. Current price action within the
triangle is below the 200 simple moving average (SMA), a key indicator
that traders use to determine bullishness or bearishness.
Traders will watch price action for a 4-hour candle close below support
to confirm that there is follow through in a potential breakout. Stops
can be placed near the middle of the triangle just above the 93.00 and
200 SMA. The height of the triangle is a little over 170 pips. By
extending this height from the support level of a potential breakout
zone, look for a possible target of 91.14. The profit target coincides
with the lows seen back on October 2nd.
In summary, descending triangles can be an excellent way to rejoin a
downtrend that clearly illustrates risk and reward. Price has a tendency
to break form the descending triangle in a downward direction.
Developing a Volatility Based Breakout System


- 2025.09.22
- www.mql5.com
- Free trading apps
- Over 8,000 signals for copying
- Economic news for exploring financial markets
You agree to website policy and terms of use