Something Interesting in Financial Video April 2017
Currency Correlations, Part I
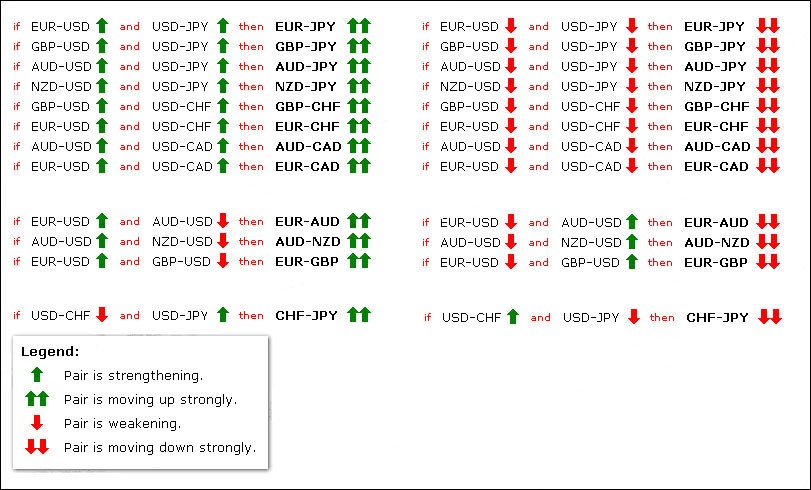
A short video introducing traders to the subject of currency correlations.
Currency Correlations, Part II
The second video in a two-part series on currency correlations.
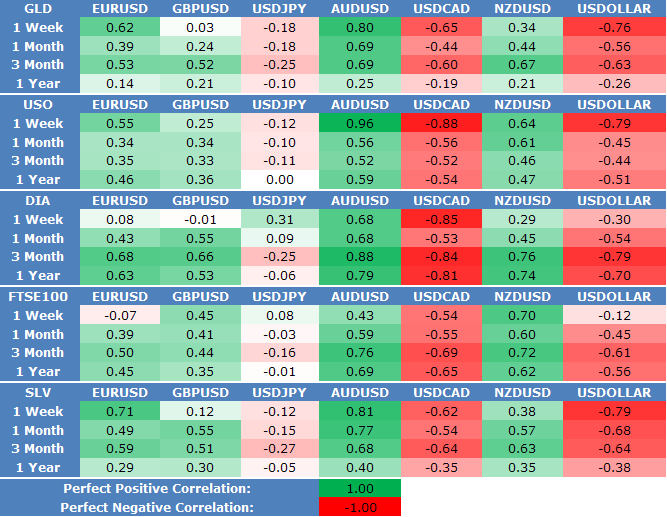
The 'Big Daddy' of Moving averages is the 200 period moving average. We are going to examine the roll of the 200 period simple moving average (SMA) as it relates to a couple Forex currency pairs.
How to Trade Binary Options Ep. 1 - 60 Second Binary Options
This is 20 minute video with text so it is very comfortable to watch. From the author:
The first 7 minutes is intro/educational while the remaining video is filled with trade examples from 10 charts over the past 2 weeks.
How to trade Head and Shoulders in Forex
Trading head and shoulders is possibly one of the easiest Forex trading strategies available. In this video we discuss the structure of head and shoulders while also providing in-depth instructions on how to set your profit target and where to insert your stop loss. We also look at its counterpart - the inverse head and shoulders.
Forum on trading, automated trading systems and testing trading strategies
Mazoem, 2006.11.09 06:00
This is information from www.babypips.com
I an not claiming it as mine, just thought it may help you.
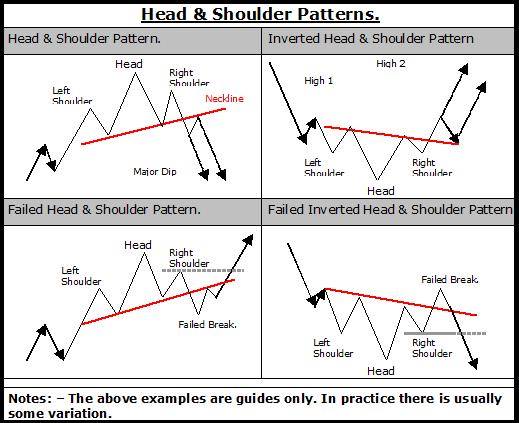
Head and Shoulders
A head and shoulders pattern is also a trend reversal formation. It is formed by a peak (shoulder), followed by a higher peak (head), and then another lower peak (shoulder). A “neckline” is drawn by connecting the lowest points of the two troughs. The slope of this line can either be up or down. In my experience, when the slope is down, it produces a more reliable signal.
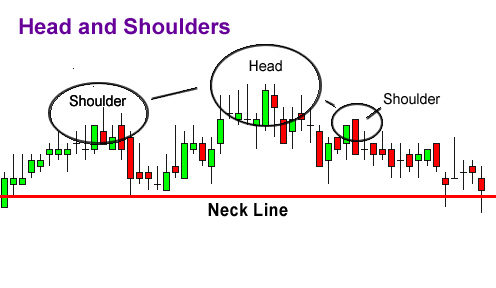
In this example, we can visibly see the head and shoulders pattern. The head is the 2nd peak and is the highest point in the pattern. The two shoulders also form peaks but do not exceed the high of the head.
With this formation, we look to make an entry order below the neckline. We can also calculate a target by measuring the high point of the head to the neckline. This distance is approximately how far the price will move after it breaks the neckline.
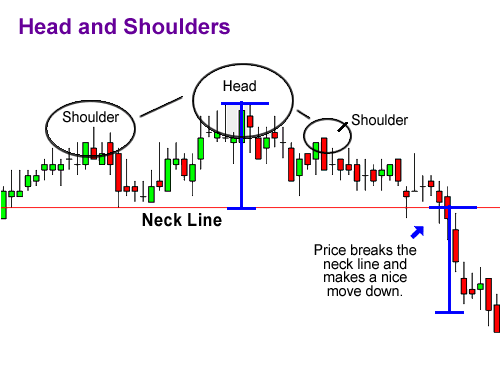
You can see that once the price goes below the neckline it makes a move that is about the size of the distance between the head and the neckline.
The indicator you posted is showing the formation, along with the neckline- thats the yellow line in your screen shot.
Head And Shoulders Chart Pattern
More video :
- How to trade Head and Shoulders in Forex
- How to Trade the Head and Shoulders Pattern Part 1
- How to Trade the Head and Shoulders Pattern Part 2
Scalping the forex market
All the ins and outs on scalping the Forex market. May Chris dives into the world of Scalping where he explains in great detail how this style of trading can be accomplished in the Forex market. This live webinar not only clarifies how a trader can scalp but also provides every Forex trader with a great guidance and extra tips.
- Free trading apps
- Over 8,000 signals for copying
- Economic news for exploring financial markets
You agree to website policy and terms of use
Please upload forex video you consider as interesting one. No direct advertising and no offtopic please.
The comments without video will be deleted.