REQ HA Offline Chart - page 5
You are missing trading opportunities:
- Free trading apps
- Over 8,000 signals for copying
- Economic news for exploring financial markets
Registration
Log in
You agree to website policy and terms of use
If you do not have an account, please register
well in here its holiday so i dont have a lot of time but something is wrong in my charts using the indi
i open a new chart eurusd 1min and attached the indi
i open a offine chart and at 13 but it does not refresh
i know its a bit stupid but can someone please can say what are the steps to create the chart
well in here its holiday so i dont have a lot of time but something is wrong in my charts using the indi
i open a new chart eurusd 1min and attached the indi
i open a offine chart and at 13 but it does not refresh
i know its a bit stupid but can someone please can say what are the steps to create the chartThey have to refresh
Attach something like daily data (from here : https://www.mql5.com/en/forum/178698 ) to the offline chart, and you should see that the chart is receiving ticks and that it is changing as much it is supposed to change
Also, you can set the smoothing parts of both smoothings to 1 and then you will clearly see that the chart is receiving ticks and changes when it needs to change.
If it does not refresh (waiting for data message all over the chart) then you have to close that chart and open it again - that is one of the things of this new metatrader 4
Hi Mladen , Thanks for your answer and explications. Sorry if I asked an another question but when you said that on daily charts the signals of the step ma are pretty accurate you mean attaching the HA indicator on a normal DAILY Japanese candlestick chart and trade with the offline HA charts (M10 for instance)or just putting the STEP MP indicator on normal candlestick chart ? Because if I attached the HA indicator on H1, H4, and D1 chart the offline chart give completely différents informations . For instance on GBP/JPY if I attached the HA indi on H1 it willl give me a buy signal from STEP MA + confirming with XO and candle. But I put it on daily it will give me a sell signal on the offline chart. Thanks a lot for sharing and help
Just one very simple indicator that will help when HA charts are used for trading
It simply displays the "real" price of the source time frame (the time frame that produced the offline chart) on chart as a line. That way user can see all the price deviations, see what is going on with current price and estimate all the past price deviations that are, with an aid of this very simple indicator, clearly visible on chart too.
The values displayed with the gray line are the ones displayed with this indicator (also, it is visible that I used 15 minute chart as a source for this example and that the indicator is displaying the close price of the 15 minute EURUSD chart) :PS: that is a free indicator. Anybody can download it (it really is not a complicated indicator)
PS: just a small change in the price display (it is simple but I managed to make it autodetect wrong if source for the chart is daily chart and if it is Monday). Now it detects correctly which is the "mother" chart of the offline chart
Offline chart is already at version 3.06 and is correcting some problems that aere happening on weekends (where there were no ticks) but right now what I am working on is a dll - metaquotes did make us problems with the file flush function and it seems that it needs to be transferred to pure windows API in order to make it work as fast as it can - metatraders flush is simply not satisfactory
I think my request is very likely ..
Is there a possibility to have an EA based on stepma indicator?
Latest version of HA smoothed offline chart generator. It is reorganized internally in order to make it simpler. Some problems that were noticed in "no tick times" (weekends, for example) are corrected. As already mentioned : it is no holly grail, but it is useful as a basis for a system (during this testing time we had trending periods as well as ranging periods - it seems to be a good basis for trending systems that - with proper MM - are not going to depend on 20% of total trades that will recover and gain the rest of 80% trades that were losing - sometimes it seems quite the opposite - even using 15 minute chart as a source produced an average of 4 to 5 days trend streaks)
________________
Enough PR: use at your own discretion. I recommend manual trading for now and try it in combination with other stuff. I usually use step ma of probability density function ma (like on the example)
Hi Mladen , Thanks for sharing the indicator. Today I took a trade on GBP/JPY and as you can see there is a pretty big gap between my order and what the chart is showing. Is this normal ? Sorry if it's a noob question but I'm new to HA charts. Thanks for your help.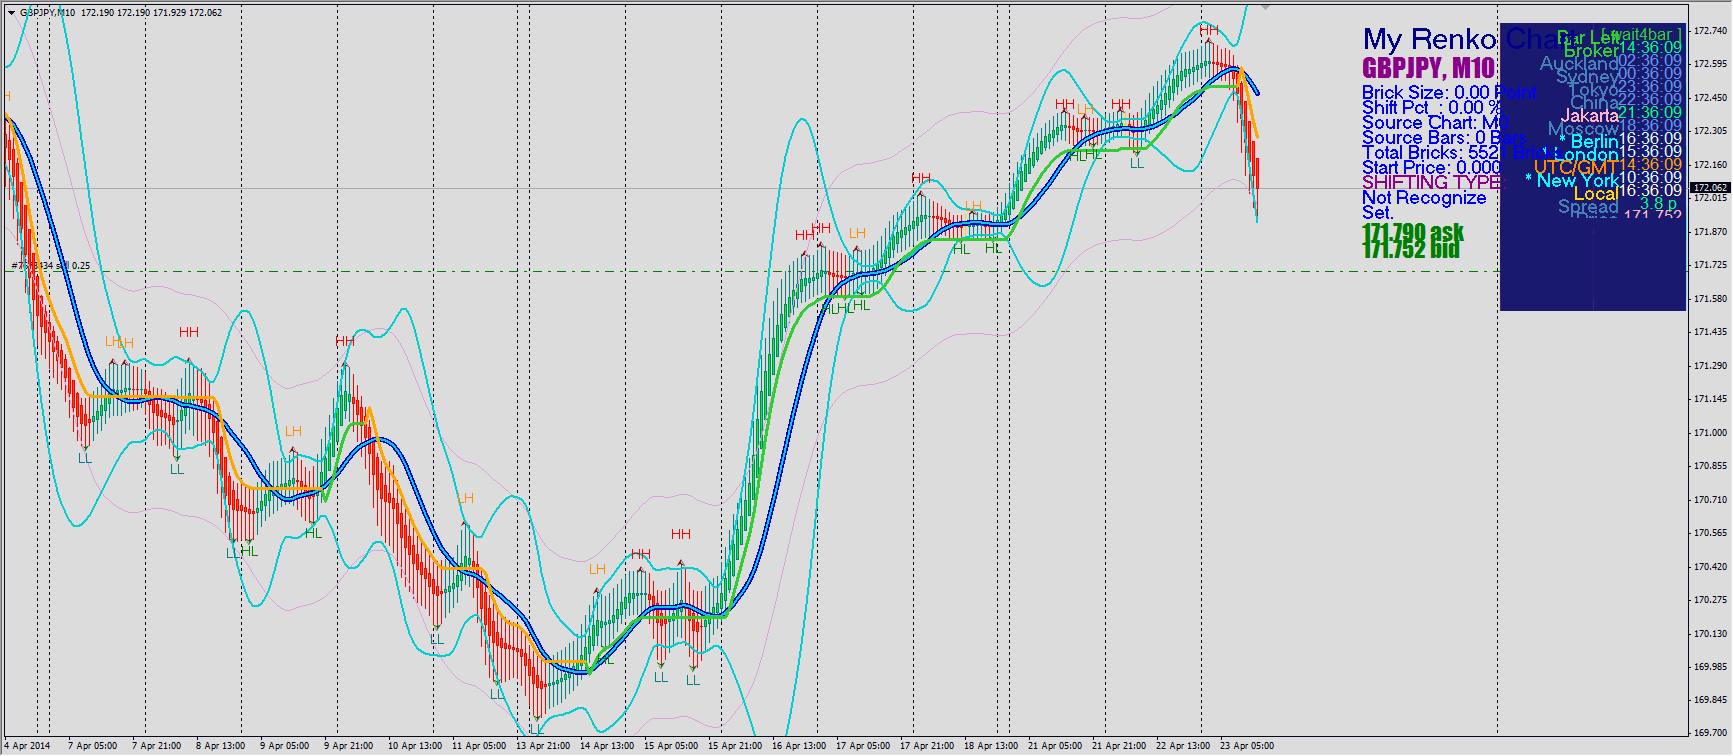
Hi Mladen , Thanks for sharing the indicator. Today I took a trade on GBP/JPY and as you can see there is a pretty big gap between my order and what the chart is showing. Is this normal ? Sorry if it's a noob question but I'm new to HA charts. Thanks for your help.
borgonuovo
That is why I am always using the display price values (from this post https://www.mql5.com/en/forum/183208/page3) along on the chart - to see the "real" price. In my opinion HA chart should not be used in signaling mode (the chart itself) or else it will be just another heiken ashi indicator. The idea would be to filter out the insignificant price changes and then to apply something else to that filtered prices
The good thing with HA is that it has all the 4 prices - meaning that all indicator will work. All. With the aid of displaying the real price and with some patience one has to wait. I am using StepMA pdf as a primary indicator for decisions. What I have found out is that it (step ma pdf) tends to catch longer (a few days) price moves even when 15 minute chart is used as a basis. Of course, that there will be some losses, but even when I take into account the worst case scenario - the loses are smaller than gains.
_________________
PS: at a moment I do the following : I attach the step ma pdf to ha chart (15 minute EURUSD source chart) with default values, and then I wait that after the first initial trend change signal given by step ma pdf the price comes in the vicinity of step ma. Then I enter the order in the direction of the trend showed by step ma
I am not telling that this is the only way how this chart can be traded, but it seems OK from the analysis made
Also, take into account that step ma parameters should be adjusted for each and every symbol ("steps" can not be the same for all symbols). Take some time to experiment with parameters. And by all means use the price display indicator to get a real picture what exactly was going on with the price and when were the actual good entries taking place (if you do not use the price display, it can mislead you)
Dear sir
i am trying all kinds of indicators and ea's on the charts
so far the stepma looks the best
i found this indi in the forum but i cant see the different colors in the stepma line