Harmonic Analysis - page 174
You are missing trading opportunities:
- Free trading apps
- Over 8,000 signals for copying
- Economic news for exploring financial markets
Registration
Log in
You agree to website policy and terms of use
If you do not have an account, please register
Guys, thanks so so much for your help and guidance, its nice to find a thread where people are willing to help us new folk.
I have read Scott's book and about to read it for a second time and make notes.
Just wanted to ask a couple of questions if I may
1) In order to find patterns do you manually scan different pairs and timeframes? as I just read that there are services out there that tell you about emerging patterns etc
2) Do you follow the exact rules as laid out by Scott in his book or have you modified this with the experience you have now gained trading these patterns? as I have noticed on some forums/threads that people modify and apply their own rules (ratios) to the patterns
Thanks1) Personally I manually scan pairs I follow. I know there are some services out there that tell you emerging patterns but it's not free as you know. I tried one of services (I didn't pay at all since it was just trial) but I didn't get satisfied. I don't need that kind of services because I can find patterns by myself. I've considered myself operating such service as the cheapest available (like $5 per month) but I haven't commence it yet because I'd like to refine and sophisticate my trading skills more and more. Anyways like I said I manually scan pairs I follow on different timeframes like 15m, 30, 1h, 4h, daily and weekly. 5m chart is not my cup of tea because it's too noisy.
2) Basically I follow exact ratios of each patterns but I have my own rules too. For instance, If B of pattern is 59 XA retracement, I call it "tradable" gartley. If B is 75 XA retracement, I call it butterfly even though some people say "it's gartley". Anyhow important thing is that you have to have your rules. I have my own rules that are based on ratios of harmonic patterns. Don't trade live if you don't have your own solid rules because it'll be unsure and unclear.
AUDJPY 4h - Potential bullish gartley. D of the gartley could be C of a bearish cypher.
EURGBP 4h - Potential bearish 5-0.
AUDJPY 4h - Potential bullish gartley. D of the gartley could be C of a bearish cypher.
Hi,
On my Mt4 the B point doesn't touch the 61.8 !!! I take it like a gartley with a perfect entry point on the Weekly and Monthly Support at 88.6% XA Thanks for sharing... Nice opportunity I think...
Regards
Hi, On my Mt4 the B point doesn't touch the 61.8 !!! I take it like a gartley with a perfect entry point on the Weekly and Monthly Support at 88.6% XA
Thanks for the info. Different server, different data. I don't like this We all should have same data. The AB=CD pattern completes around that support you're talking about.
GBPUSD 30m - Potential bearish bat. Structure level around D1 is the first key to watch.
GBPUSD 30m - Potential bearish bat. Structure level around D1 is the first key to watch.
Hi,
Yes Good opportunity here on this Bearish Bat... Seems going well with this WW... Entry Near The EPA were the price should reverse on the other side
Regards
Hi,
I really Dislike When We Don't Have any Pullback on the CD Leg like we have right now on the GBPUSD... What do you think Ryu of That? Do you take such trades??? I prefer Skip these ones.... What I saw very often is when the price goes straigh up like this without any retracement the pattern fire... But I m still not comfortable with this.... Do u have any advice or comments???
Thanks in advance
Regards
Hi traders,
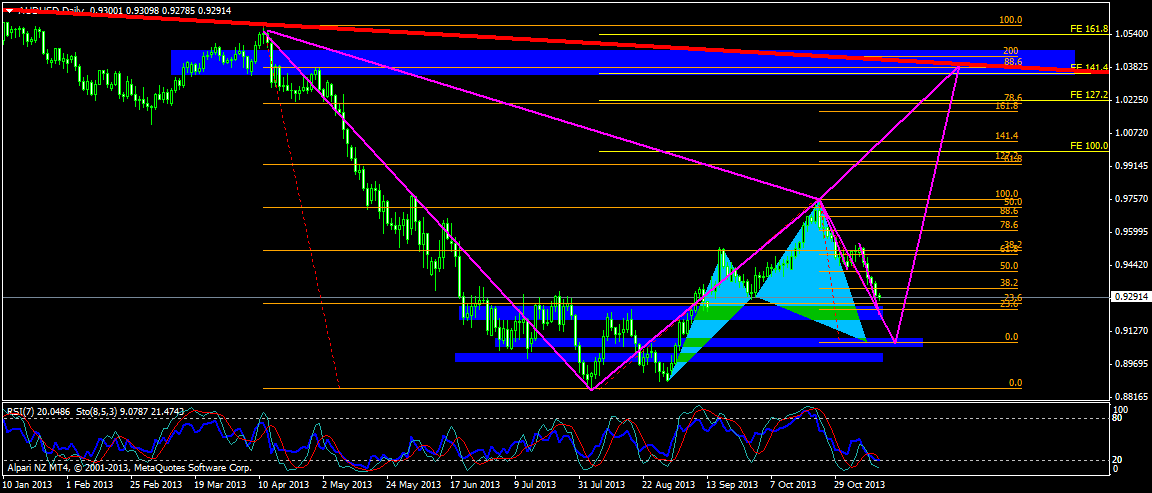
I have found an emerging bull cypher on AUDUSD H4 chart. The level of D point is at 0.907 (three internal fibo confluence XC 78% ext BC 141% and 127% projected fib ext of the smaller imp leg on the DX leg of cypher). This cypher could give a good reason to step into aggressive C trade of forming D1 bear bat. The D point of the bat is at the weakly downtrend line (red line on the top).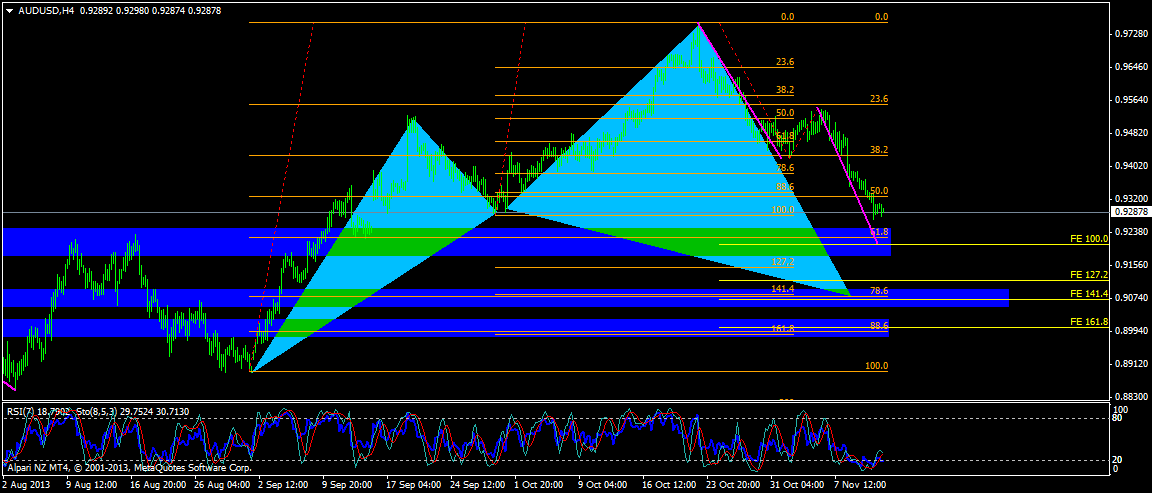
Hi, I really Dislike When We Don't Have any Pullback on the CD Leg like we have right now on the GBPUSD... What do you think Ryu of That? Do you take such trades??? I prefer Skip these ones.... What I saw very often is when the price goes straigh up like this without any retracement the pattern fire... But I m still not comfortable with this.... Do u have any advice or comments??? Thanks in advance Regards
First of all, look at the pic below. Before the UK data released, Demark 9 had been there telling us that the pair might go up and boom it went up. Well if you feel uncomfortable, then don't that's the best option. Price went up and touched DR2 where some structure support/resistance sit and then price bounced a bit and kinda tested the level of B of the bearish bat. Now it may go up again and complete the bat. Again, if you feel uncomfortable, don't take this and stay out of it. There are patterns on different pairs. This pair is not the only one