Advanced trading lessons - page 16
You are missing trading opportunities:
- Free trading apps
- Over 8,000 signals for copying
- Economic news for exploring financial markets
Registration
Log in
You agree to website policy and terms of use
If you do not have an account, please register
now
now i know this about the target side of the trend line.
on that same monthly candle a i draw a counter trend trend line.
after two points in steep filtered trend the third point falls off the highs, and moves right.
then i expect a base line after the closed monthly candle, i expect a candle over lap with this base.
then i expect a a one shot new high that falls off the highs of the monthly target side trend line.
this is where i take counter trend trades.
lots more work needs to make this easier. we work on this more latter.
we work on the base line. The base is: the top of the step in a down trend and the bottom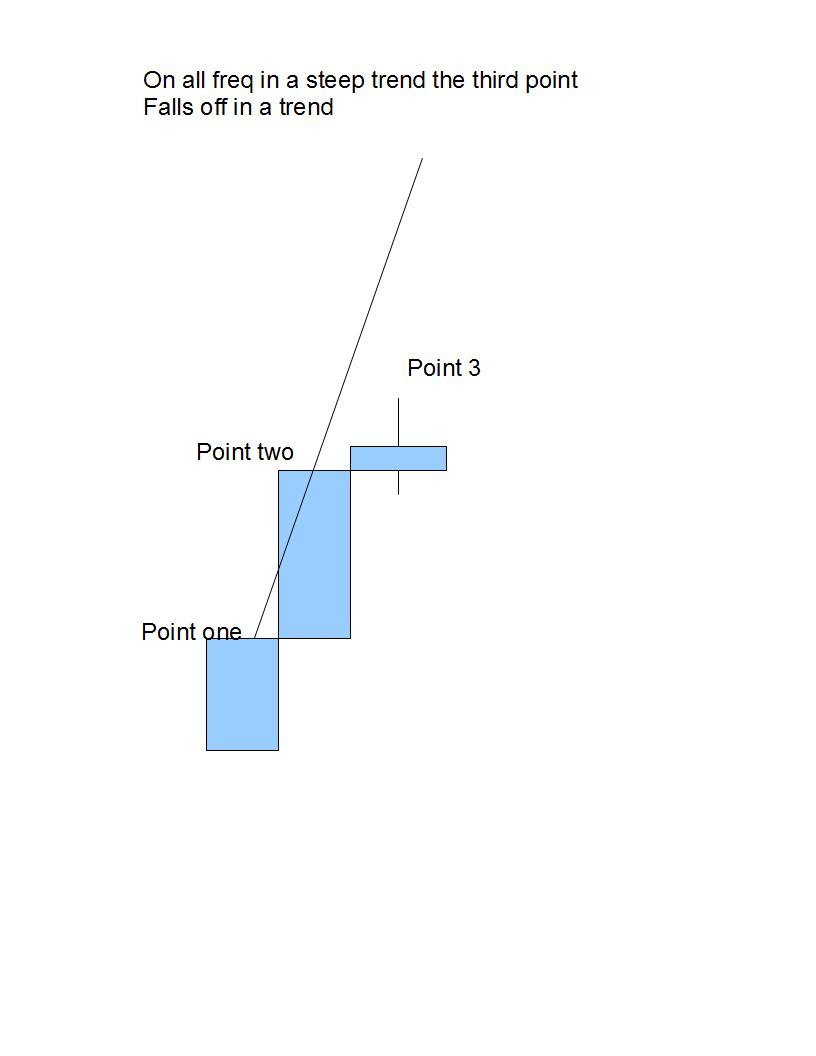 of the
step in an up trend.
so we look at how steep the upper time frame is, compared to the base line and physical price.
this lets you know about major counter trends.
the clue
this is not just a clue it is reality of a trend.
the clue is the length of time for a base line is the reality clue.
in this example i split the monthly candle in half.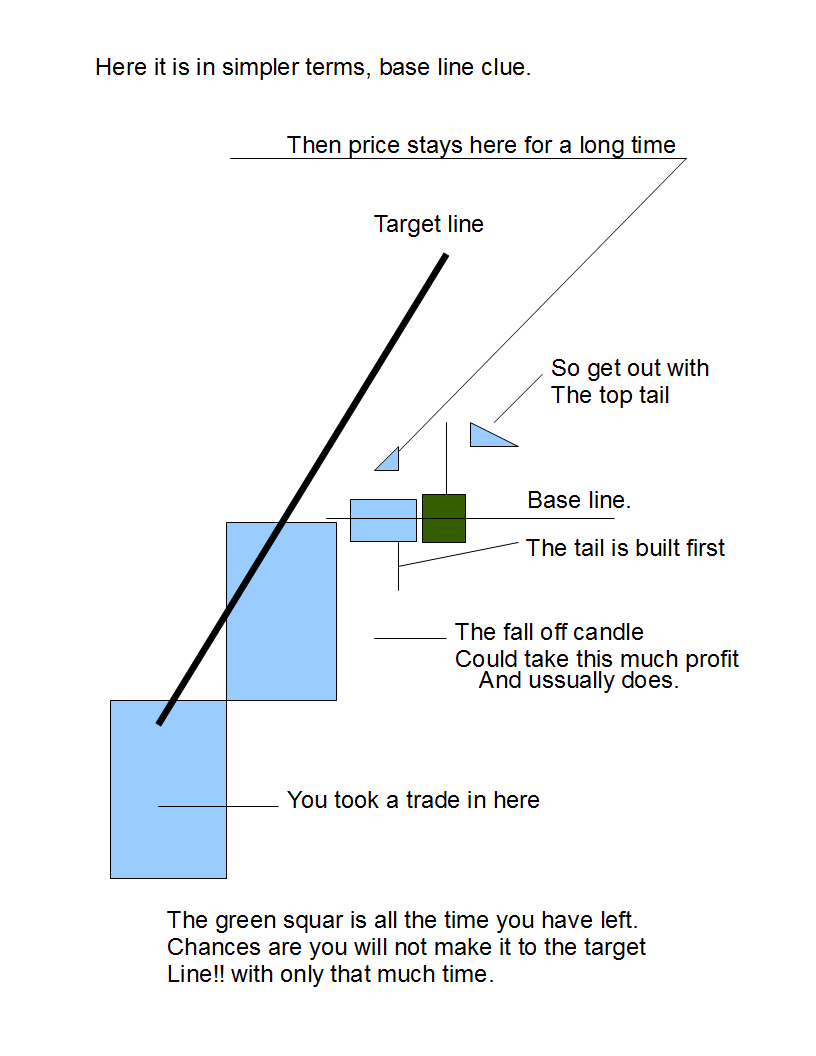
i will show you
every one is different.
me i want as much as i can get in trend on the inner slope.
when that slope is over then i take what i have.
but i have to have an emergency exit plan.
so targets to me is when i suspect a fall off going away from the target line.
latter we could go back to that target line much higher, with new inner slope.
so once i counter trade on the monthly i expect 4 hr swings, and daily trap on the down side.
then i get out and go with the trend.
every one is different but this is what i like to do. i will show you some chart examples another day.
i have a big knight of football watching with the guys.
i know this part is confusing,.... we will keep on this for awhile..
after
after the fall off a new inner slope starts that will most of the time be strong with trend.
price will usually physically strike the target line and slide down it a ways. this is typical
for the trend. this is an easy target. we will look at this also.
the target side of the trend
this is one of the most difficult things to teach, and it is the hardest thing to learn.
if traders learn this they become elite status traders. so stick with me here. this last part may seem like
a bunch of junk so far, but i am going some place with all of this.
when i am done with this section, and traders get it. at that moment you get it. your mind will be blown
away. you will never see trading the same. the problem is there is so much to teach where do i start.
how can i explain this as simple is possible.
1. we know the target side falls away from the target trend line in a trend.
2. we know after falling away it can go back to the target side.
lets start by the things we have not talked about yet. lets list them.
target side. not discuses yet
1. advertised close on the target side
2. physical price on the target side.
3. channel shift on the target side.
4. inside the right side candle.
5. critical points.
6.cone.. and wedge.
7. data transfer on the target side.
8. the target side compared to the entry side.
in order for me to teach the complete market traders need the complete story.
no trader needs to be complicated, or stressed out. so what i do is separate the sides into two subjects.
the target side is my analysis, and the for destinations.
the entry side is my analysis for entry.
drawing
1. drawing a channel with out an over lay trend line is worthless.
2. what is smart is to draw the channel with the over lay's larger time frame, and track physical
price inside of it.
what does physical price do typically inside this channel? so i know what to expect.
is there clues along the way?
lets start with examples of physical price in swing form inside a larger time frame channel.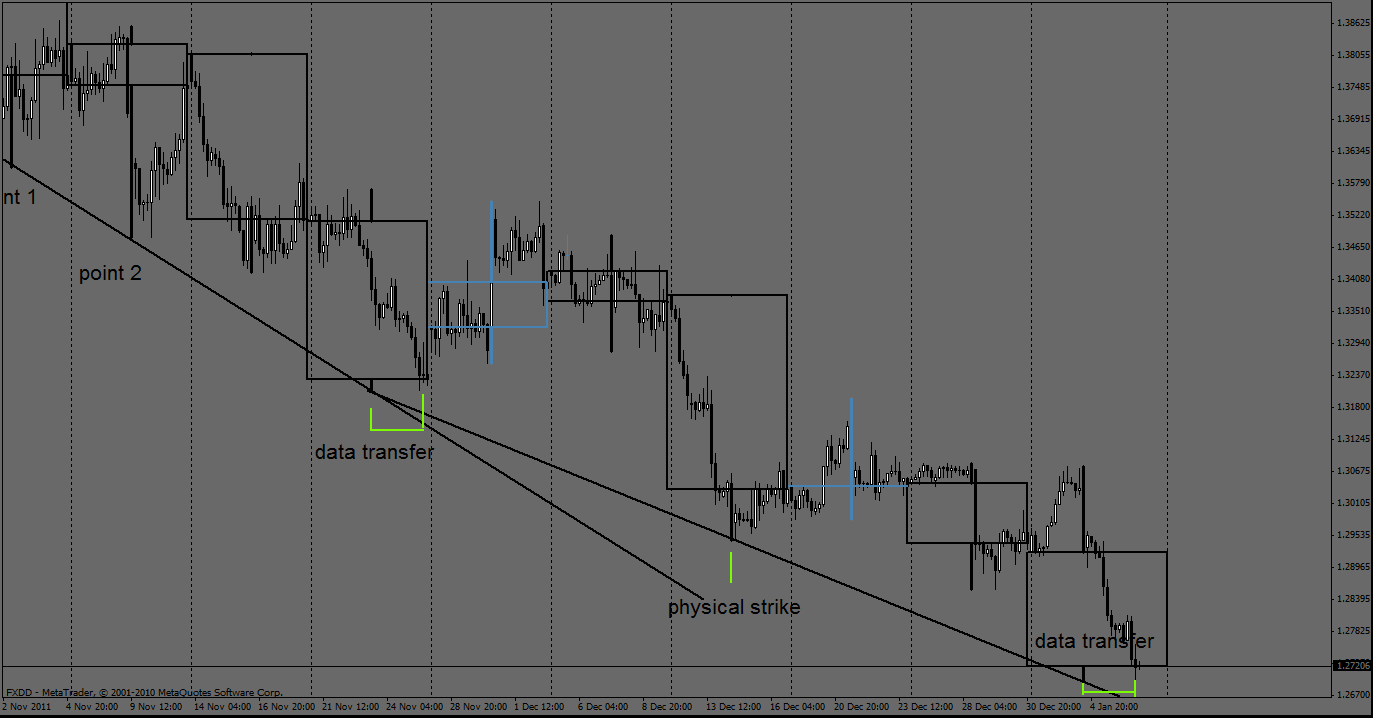
oops this is the 4 hr eur /usd with weekly over lays.
what traders have to realize
what traders have to realize is this:
when you are on time frame in trend, what you have learned in the past about tracking trends will not work.
its imposable for it to work. why because on time frame as trader, there is always a higher time frame
that you are within!!!!!!!!!!
those time frames can expand and contract, move right. have deep momentum to it's slope, and upon reaching for
it devastates the slope your trading from.
i use to be channel trader years ago. with no knowledge of how it worked. my partner use to ask me" what
does it mean when we break outside of channel"? i use to say things like we are most likely channel shifting.
i use to think they worked like this: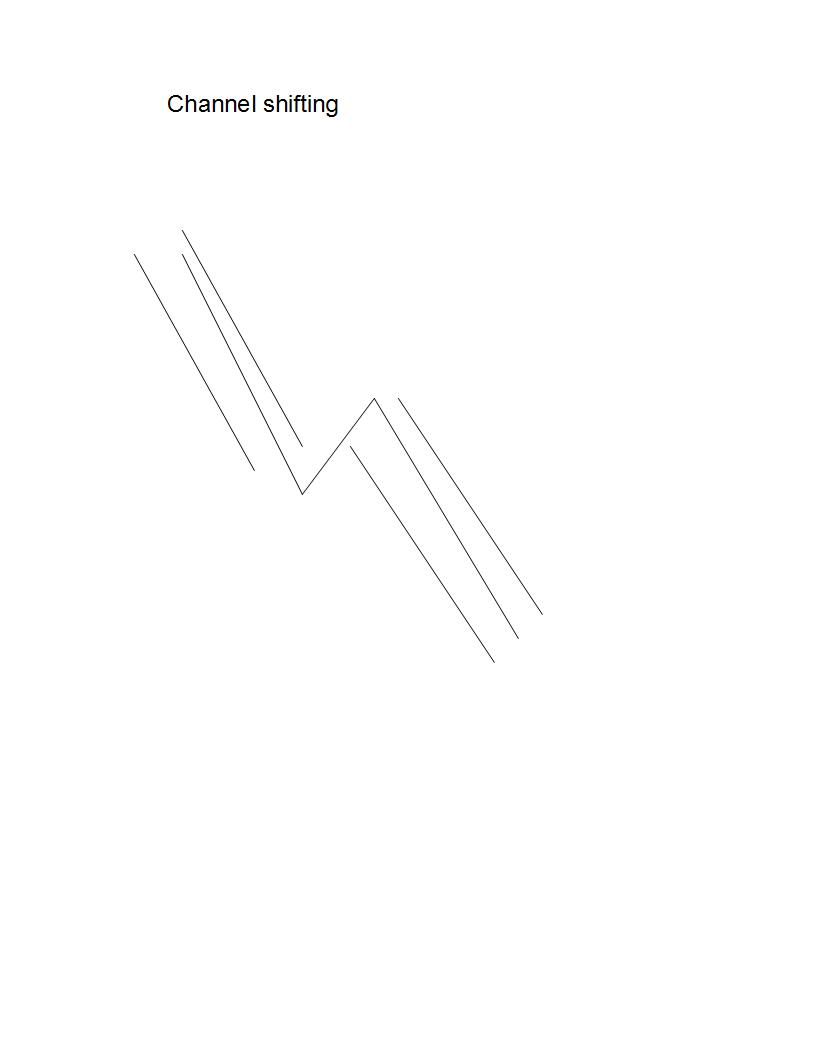
and they can work like this, but this very basic, and only the beginning of the story.
later i started
later i start using mtf channels. that was a disaster! lol
they looked something like this: i quickly found out that was not any good.
why was this not working?
the reason is inner and outer slopes with the trend moving to the right on all time frames
compared to my time frame i was on. plus time frames new opens.
not to mention the constant trend line breaks, on all frequencies.
the reality of channels. is what i wanted to know!! what was the reality of channels. i do not
create the market if i did i would make it more simple.lol
simple or not i needed to find the reality of them.
the reality is this:
on the entry side of a trend channel-- we know the upper time frame trend line--- with physical
price the trend line is eventually physically tested, then eventually crossed. ( this is done with the top of the steps in down trend) or the range. that's the reality of the entry side.
on the target side of the upper time frame trend line that makes the channel. what is that reality?
the reality is this: we know that that line can be physically tested also just like the other side. both sides
can be tested with physical price or data transfer. they both can be crossed also!! the target side T.L. is crossed
when a upper time frames channel is being met with inner slope swings. when that upper time frames outer
slope is expanded beyond the range of the lower time frame.
what is the differences between the entry side trend line, verses the target side trend line?
they both can do the same things. data transfer. physical. price strikes. crossing the trend line for a time and then
cumming back inside the channel later.
the differences are:
the entry side of the trend line can cross eventually and not go back to the old channel , where the target side
always has to come back.
the other differences is: the entry side of the market is challenged by weakness or counter trending.
the target side is challenged by strength or the inner slope trending side.
if i were just to make up a drawing right now it would be eraser for you then the live market.so let me work on that
i need a break so this will be awhile.
when we look at over lays
when we look at over lays, with support or resistance we can overlays on one freq.
telling us on thing that can be true, then look at another higher freq. that is false.
remember the trade we were managing. and we wanted to know weather to get out
or stay in for a bigger target.
with the 4hr time frame, with weekly over lays the chart said take profit and get out. and turn around
go long.
this is what we were looking at.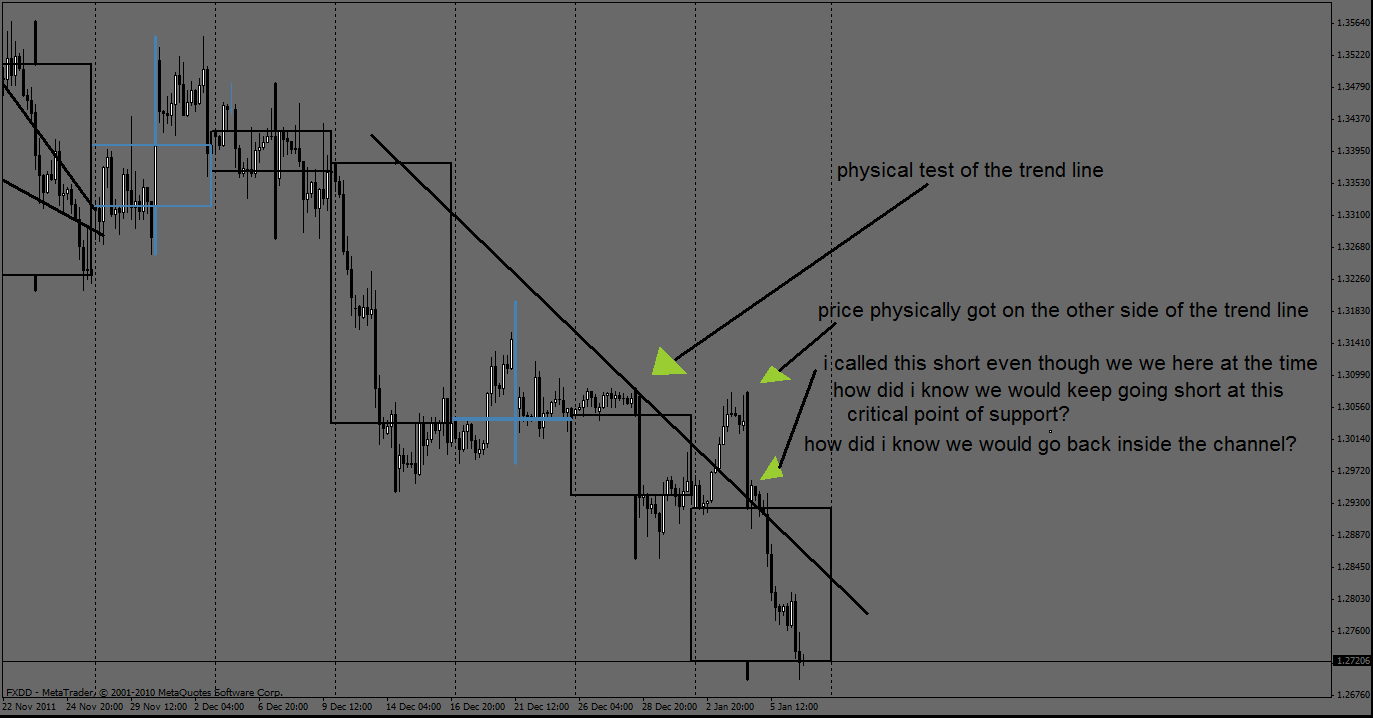
what i did was do a target analysis, how i did this was increase my freq. to the daily with monthly
overlays.
this is where time came is not only did we start a new week it was the start of a new month.
so i needed to see what the monthly potential was.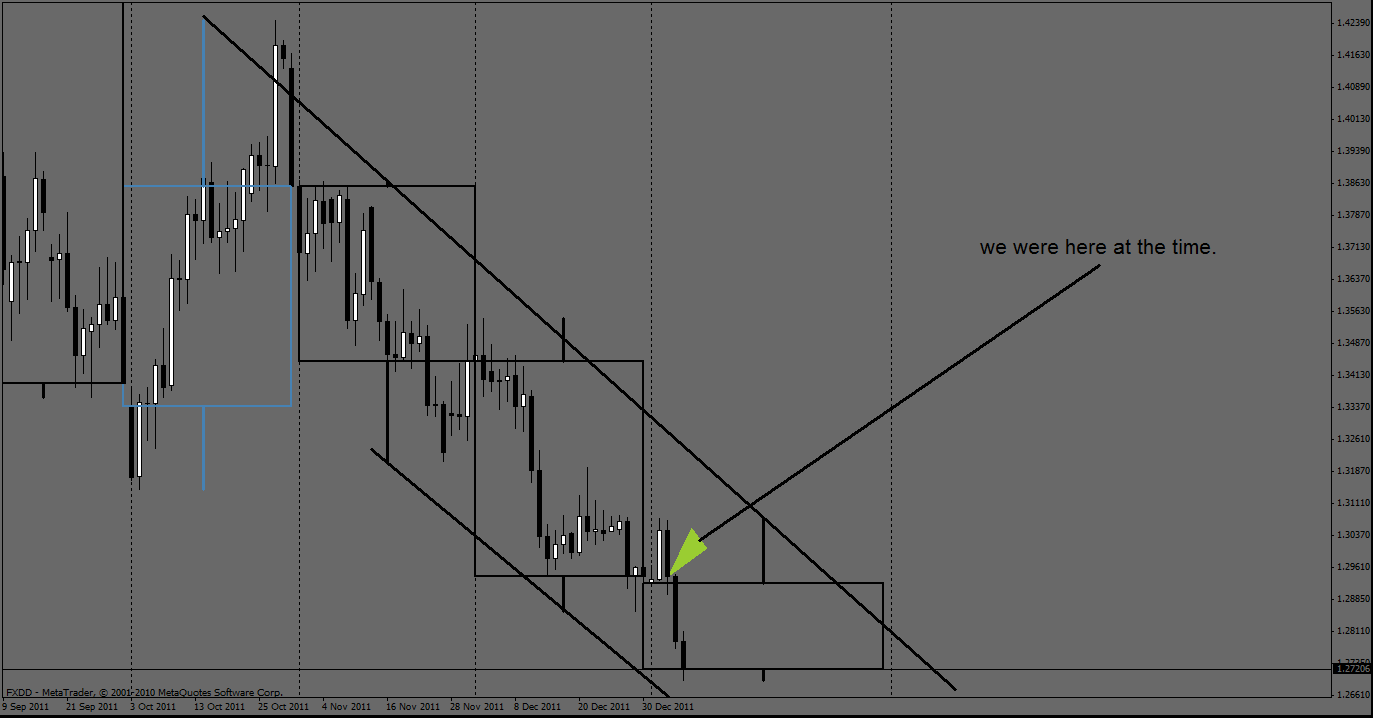
this is how physical price can move out side of channel T.L. then go back inside a channel T.L.