Simple Ichimoku System - rules for the systems
Description of the indicator.
Lines of the indicator:
- Tenkan-sen;
- Kijun-sen;
- Senkou Span A;
- Senkou Span B;
- Chinkou Span.
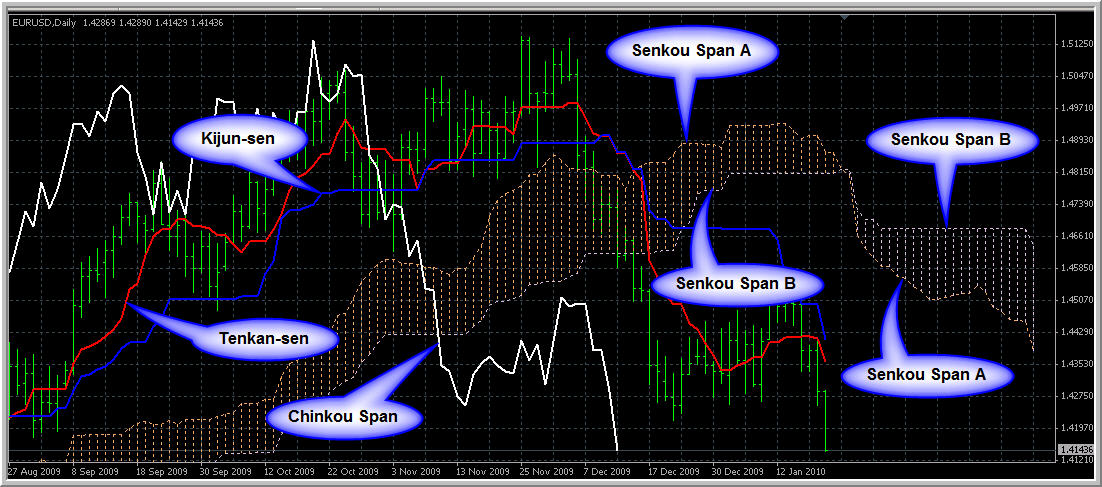
The space between Senkou lines is the cloud. If the price is located between Senkou Span A and Senkou Span B lines (inside this cloud) so the market is ranging (if the cloud is big enough) or flat (if the cloud is small). In this case Senkou Span A and Senkou Span B lines are support and resistance lines.
If the price is inside the cloud and - Tenkan-sen and/or Kijun-sen lines are located in almost horizintal way so Ichimoku Sanjin suggested to use some other indicators to estimate the future of the price movement.
By the way - some traders are using Tenkan-sen and Kijun-sen lines (located in almost horizontal way, or at some angle of) to estimate the future possible trend strength. And they are using those Tenkan-sen and Kijun-sen lines only to predict the direction and the strength of the possible trend in the future. Just to be ready.
If the price is above the cloud so Senkou Span A and Senkou Span B are the first and second support lines. If the price is below the cloud so Senkou Span A and Senkou Span B are the first and second resistance lines.
Some traders said that if the cloud was/will be changed by color (you can see it from the image) - so it indicating the changing the trend in that future period of time.
If Chinkou Span line is crossing the price so it is the signal to enter (for buy or for sell). It is most strongest signal in this indicator. But this signal to enter is coming late sometimes so it is necessary to look at the other indicator' lines for confirmation. Please note: Chinkou Span line should cross the price on the closed/previous candle and no in horizontal way (it should be at angle of at least 45 degrees). Besides, this crossing should be done for candle chart as for line chart too.
By the way - this Simple Ichimoku System is ystem to trade on closed/previous bar rule: eery crossing, every signal and every estimation/ealuation of every indicator of this system should be considered in closed/previous candle.
Kijun-sen is the main line for trend in this indicator. If the price is above Kijun-sen line so, most proably, the uptrend will be continuing. If the price is crossing Kijun-sen so, most probably, the trend will be changed soon.
Tenkan-sen is reversal line: if this line is on uptrend or on downtrend - it indicates the trending market (uptrend or downtrend respectively). If Tenkan-sen line is going on almost horizontal way - it id flat (ot ranging) - price is inside the channel between 2 support/resistance lines which is near each other.
Some people are using Tenkan-sen/Kijun-sen crossing as the signals for buy or sell. But to say the true - this kind of crossing can not be strng and having many false signals. So, every cross or every Ichimoku signal should be conformed by the other indicator's lines or other indicator's signals (to increase the probability for good entry to the market).
There are some more complicated rules for Ichimoku indicator: trading based on and Senkou Span lines. Those rules are based on the location of those lines concerning each other and estimating the enter to the market on the direction of Tenkan-sen or Kijun-sen line. I will not decribe those very specific way of trading as we are not using it in this system.
And there are some other complicated rules which we are not using here. It is the following: all the lines (Tenkan-sen, Kijun-sen, Senkou Span A, Senkou Span B, Chinkou Span) are used in the same way as Moing Averages indicators crossing with different period of the indicators. And traders are uing it together with Fibo and candle analysis and having very good results. But we are not uing this trading method in this system.
Any indicator's line is immediately re-act on the new extremum created. Besides, if we can see - Chinkou Span line is similar with Momuntum indicator by meaning. Thus, we are gaving in this 1 indicator:
- multiplied signals to enter to the market
- support/resistance lines and prediction of the support/resistance ituation in the future;
- direction of the market, market condition evaluation, and predition on the future;
and so on.
And it is just 1 indicator only acted as complex trading system. Some people can not believe but it is the real true: this indicator was finally created by 1 Japanese newspaper writer in Tokyo before World War II. But ... I can say more: the general concept for this indicator was invented in Japan in 18 century by one of Japanese mathematician, and Ichimoku Sanjin just continued this research. And for now - we are having one of the most powerful tool for trading with 70% of the probability of the winning trades. Just 1 indicator created in the beginning of 20 century based on the research which was done in 18 century in Japan!
Timeframe and Settings.
As we know - this indicator was created for stock market for D1 and W1 timeframe. But many traders are using it for forex for H4, D1 and W1 timeframe.
D1 timeframe is more comfortable to trade. Because in case of D1 - we do not need to look at Metatrader's charts all the time. In case of H4 - it may be more difficult: I traded H4 timeframe long time ago (channel trading system) and stopped only because it is difficult to be near PC without sleeping for many days ...
D1 timeframe - it is much more easy: just check the charts in the morning for possible enter once or 2 times in a day.
The settings (input) of Ichimoku indicator as 9, 26, 52 created for stock market - may be valid for the forex for H4, D1 or W1 timeframe.
There are some traders who are using H1 timeframe only (with different settings). And some other traders are using M5 tmeframe with great sucess but with very different settings/input of the indicator.
So, some general recommendation about the settings of the Ichimoku indicator based on the timeframes you are trading:
- for M5 timeframe: 72-144-288;
- for H1 timeframe: 12-24-120 or 120-240-480
- H4 and D1: 9-26-52 or 5-10-20.
- for W1 timeframe: 9-26-52.
Stop loss and take profit.
Do not trade without stop loss. Especially if trading D1 or H4 timeframe. Stop loss value is the price of nearest dot or arrow (in most of the cases), or nearest support/resistance line (most often - borer of the cloud).
I am using price of dot/arrow for stop loss in most of the cases. Stop loss is not small by value for D1/H4 timeframe as we can see from the charts so we should have initial deposit enough to trade those timeframes.
Stop loss is moved by trailing stop. In my trades in the beginning of this thread I used trailing stop as 30 - 50 pips (4 digit pips). But in reality - it should be not less then 50. Stop loss should not be moved by trailing stop in aggressive way, especially on D1 timeframe. Let the profit run.
So, the trade may be closed by stop loss (moved by trailing stop). Or we can close the trade if price will touch/cross some support/resistance line (usually - border of the cloud) if we do not want to trade inside the cloud in ranging unpredictable market condition.
Classical Ichimoku indicator's stop los and take profit values suggested by the author of this indicator (Ichimoku Sanjin):
- if we are trading on the direction of the cloud so take profit values are Senkou Span A and Senkou Span B lines. Stop loss in case case can be somewhere outside the trend, or we can use Parabolic SAR indicator (Ichimoku Sanjin suggested Parabolic SAR indicator for stop loss in this case).
- if we are trading from the cloud so our stop loss should be somewhere near Kijun-sen line, next stop - Senkou Span A and Senkou Span B lines (borders of the cloud). Take profit in this case: Kijun-sen line reversal, or - how suggested the author of Ichimoku indicator - fix take profit value.
Generally - we can have 1 or 2 signals per 2 weeks per pair. And generally - we can have 100 - 300 pip (4 digit pips) per pair in a month (for D1 timeframe). It is just an averaging stats decribing by some traders.
Trading inside the cloud is one of the good trading technique to use this indicator. In this case the borders of the cloud (Senkou Span A and Senkou Span B) are support/resistance lines and some guiding lines for stop loss and take profit values (should be behind those lines), and we are trading on the direction of Tenkan-sen line inside the cloud in the ame way as we are trading inside the channel. Some traders are having the avegaring profit days as 40 pips (4 digit pips) just using this technique only.
But we all understand that in this case - the cloud should be big enough to indicate the ranging market condition. We can not use this technique in case of small cloud (flat).
Some traders stimated some stats for stop loss and take profit values for Ichimoku systems. We can use it for this system as some recommendations for example:
Stop loss (4 digit price pips):
- For M5 ... H1: some traders are using stop loss = 15 pips for all the pairs in any situation. Not for H4, D1 and W1.
- For H1 (in case we are trading on H1 timeframe):15 - 30 pips for EURUSD; 20 - 40 pips for GBPUSD; 35 - 50 pip for USDJPY; 30 - 80 for USDCHF.
- for H4, D1 and W1 timeframes: near the most strongest indicator's line or signal. For D1 it can be 100 or 200 pips.
- for H4, D1 and W1 timeframes: behind the cloud.
- for any timeframe: dot or arrow of PriceChannel_Signal indicator.
Description of the indicator.
There are 2 kind of the signals producing by the indicator:
- signal to enter;
- signal to re-enter.
There are some example of those signals on the chart:
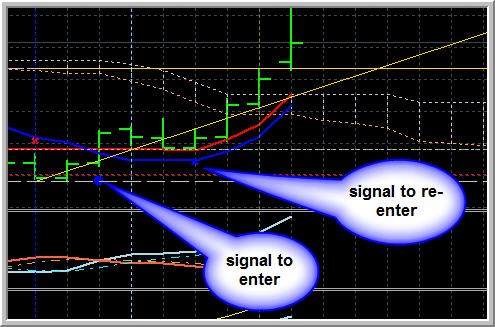

'Signal to enter' meaning - it is the signal to open the trade, or confirmational signal.
'Signal to re-enter' - it is to open one more order on same/this direction, or continuing confirmation.
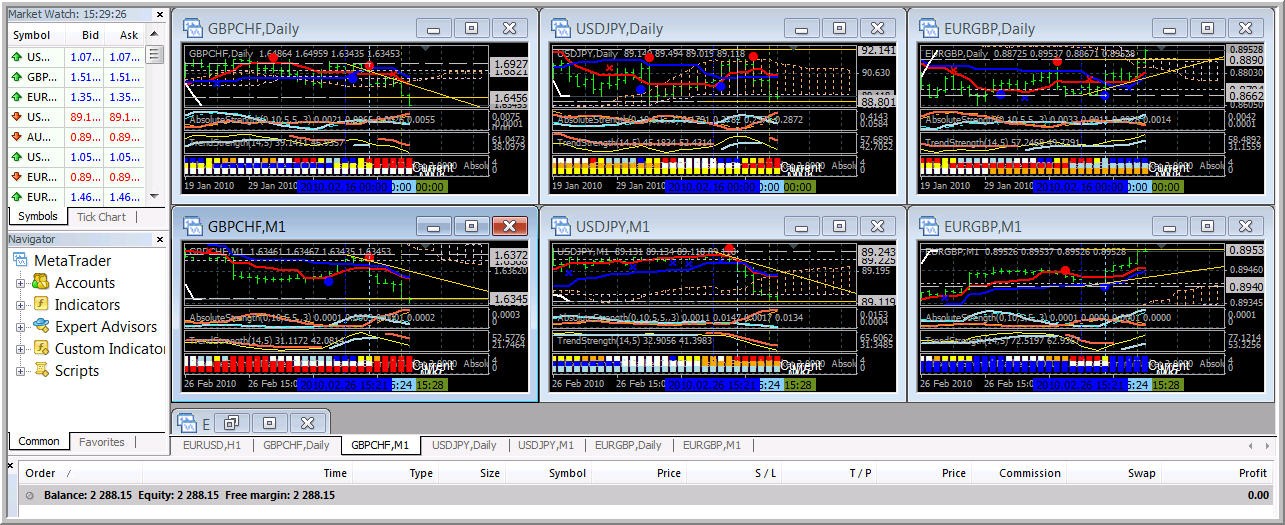
Timeframe and Settings
This indicator is used for Simple Ichimoku System for H4 and/or D1 timeframe as confirmational indicator:
For Simple Ichimoku Scalping M1 timeframe - this indicator is the main trading indicator:
Some description of the settings:
- UseReEntry = 1; // Re-Entry Mode: 0-off,1-on
If 1 so we have signal to re-enter on the chart.
- AlertMode = 1; // Alert Mode: 0-off,1-on
If 1 so we will have alert on closed bar about signal to enter or re-enter.
- WarningMode = 1; // Warning Mode: 0-off,1-on
If 1 so we will have alert on open bar about signal to enter or re-enter.
Use AlertMode = 1 or WarningMode = 1.
There is no need any alert or warning mode alert in case of trading H4/D1 timeframe.
AlertMode = 1 is used for M1 timeframe.
Close Bar Trading Rules.
PriceChannel_Signal indicator is the signal indicator's family.
Signal indicators are the ones giving the signal to open the trade by dot or arrow or any. For example, Asctrend signal, BrainTrend_signal, simple EMA crossing (if we are using this crossing to open the trade so it is signal crossing), and so on.
There is one rule to use all signal indicators (including this PriceChannel_Signal indicator):
Close Bar Trading Rules.
Some more explanation.
There is some forex programming terminology used by forex coders and some traders: "closed bar trading", "open trade on 1st bar" and so on.
For example - it is the bars enumeration on the chart in the way as it used for programming in forex:

So we see that current open bar is the bar #0.
Previous bar is the bar #1.
Some traders/coders call this bar #0 as open bar, current bar, or zero bar and so on.
Bar #1 is previous bar, or closed bar, and so on.
So whatever we call those bars - we know that bar #0 is open bar, and bar #1 is closed or previous bar.
Close Bar Trading Rules are the following:
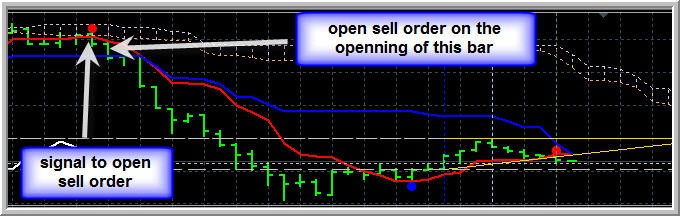
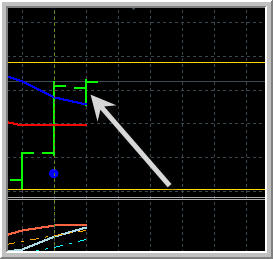
all signal indicators (including this PriceChannel_Signal indicator) should be used on closed bar. For example: we see the dot on the bar #0, we will wait until this bar #0 will be closed and new bar will be opened. So, we must open the trade on the closing the preious bar and openning new bar (if the signal will exist of course).
We see it from the image: signal is on bar #1 (previous or closed bar), new bar is open and we will open the trade.
It is general rule to use all signal indicators: trading on closed bar.
Of course, there are some special trading technique trading on open bar but we are not using it on those our systems (this special technique is used to trade on open bar or/and together with some repainting indicators which is very complicated technique to trade). We are using simple trading rules to trade on closed bar.
By the way, if AlertMode = 1 so it is alert when the signal is on close bar. Means: alert when the signal is on the bar #1. WarningMode = 1 - alert when the signal is on the bar #0.
Bar #0 is open unfinished bar so the signal can be disappeared if it is on the bar #0 (for all the indicators with no exception). That is why we are trading on closed bar: the signal must not be disappeared if on closed bar (in case of any signal indicator using).
---------
Some more about bars.
One reason why many traders do not believe in backtesting of unknown EAs is the following: EA can be coded on open bar, and we all know that open bar is bar #0 which is unfinished bar. Means: EA can be very good with backtesting but losing with live trading. That is why some traders do not trust backtesting at all: we never know what the author programmed inside this code in case of commercial EA for example - close bar or open bar.
If you speak with forex progfammer and he will ask you about the rules for your system to code so try to describe your rules with numbers of the bars.
For example:
"enter if the signal on bar #1 with confirmation of the indicator on bar # ...; close the trade if 2 lines crossing on bar # ... with confirmation of ... on bar # ...".
Please note: any forex programmer is coding those bar numbers inside the code so if you will use this enumeration - it will be much more easy for you and for programmer to understand each other.
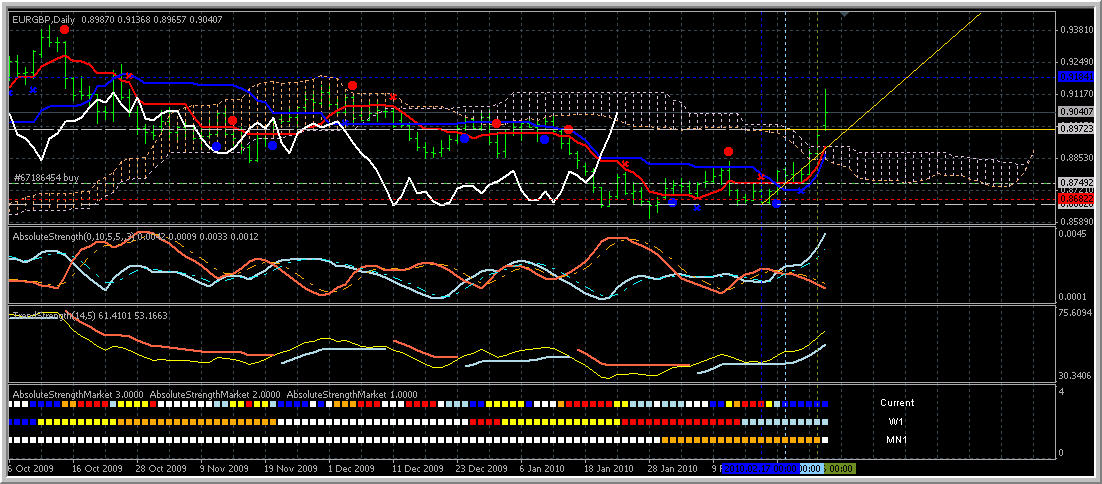
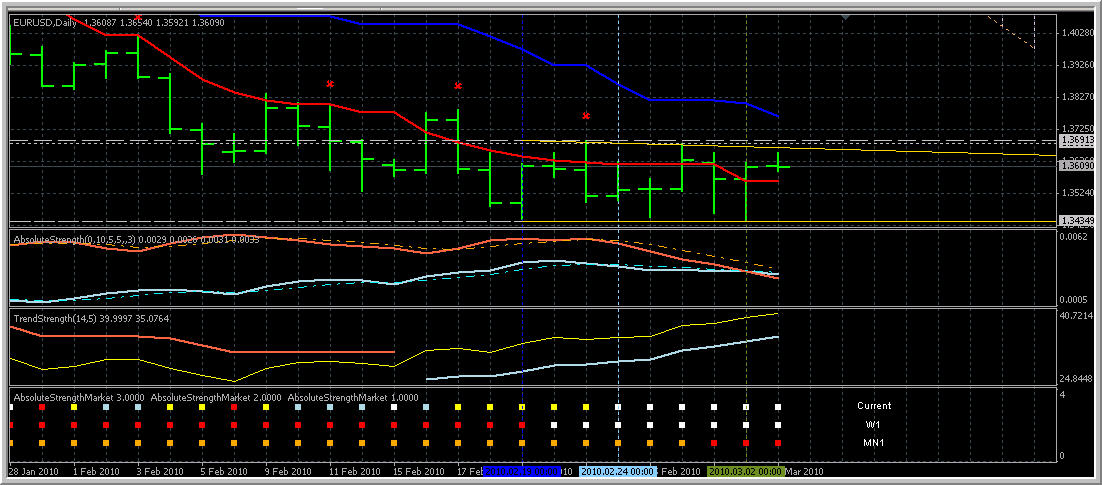
Description of the indicator.
In this indicator the price is divided on to two parts:
- downtrend (brown color);
- uptrend (blue color).
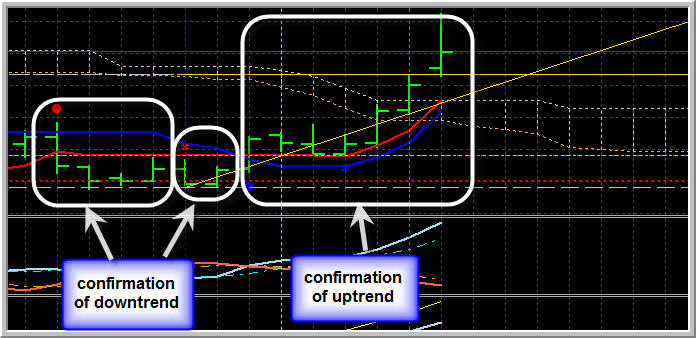
Strong uptrend (UP):
blue solid line is above blue dotted line and blue solid line is above brown solid line.
Strong downtrend (DOWN):
brown solid line is above brown dotted line and brown solid line is above blue solid line.
Non-trading zone (NTZ) for sell (NON TRADE FOR SELL):
brown solid line is below brown dotted line.
Non-trading zone (NTZ) for buy (NON TRADE FOR BUY):
blue solid line is below blue dotted line.
Correctional buy (BEAR MARKET RALLY):
blue solid line is above blue dotted line and blue solid line is below brown solid line.
Correctional sell (CORRECTION):
brown solid line is above brown dotted line and brown solid line is below blue solid line.
Choppy:
brown solid line is above brown dotted line and blue solid line is above blue dotted line (on the same bars).
Non Trade (FLAT):
blue solid line is below blue dotted line and brown solid line is below brown dotted line (on the same bars).
You can see the examples on the images below:
More about market condition: read this thread https://www.mql5.com/en/forum/174309
It is just an example from yesterday (sell order should be opened yesterday when new D1 bar is open):

It is example of Non Trade (FLAT):
Ichimoku
The beginning
After
- The theory of the signals
- Ichimoku alert indicator with arrows
- Ichimoku alert indicator improved : warning alert mode was fixed and autosettings feature was added
Forum on trading, automated trading systems and testing trading strategies
Sergey Golubev, 2010.02.27 07:43
Some more exercises.
Checked the market condition using this system https://www.mql5.com/en/forum/179672 and trading using this scalping:
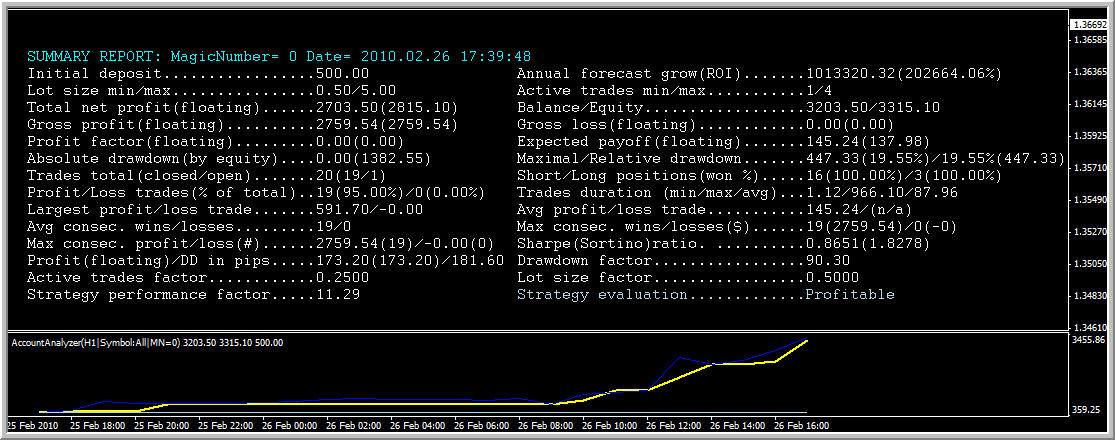
Statement:
ROI = 202664%
Annual forecast grow: 1,013,320 dollars.
(leverage 1:100 on the account I am trading inlc this one)
It means: if I will trade as I am trading now (few hours almost every day) so I will have 1 million dollars with starting initial deposit as 500 dollars.
Do you know what is the most bad when using this system? avidity 
-----------
I am doing this exercises just to feel this system better to describe the rules about how to trade.
- Free trading apps
- Over 8,000 signals for copying
- Economic news for exploring financial markets
You agree to website policy and terms of use
Introduction.
This indicator was created by Tokyo newspaper writer before World War II who had the pseudonym called Ichimoku Sanjin which we can translate as “a glance of a mountain man”. Ichimoku means “one look”; a chart of this style is referred to as ichimoku kinkou-hyou — the table of equilibrium prices at a glance.
Originally it was created to predict the stock market in Japan.
Full name of the indicator: Ichimoku Kinkou Hyou.
It can be usefull to estimate the trend or market condition, support/resistence and for generating the trading signals to buy or sell. Working in the best way on D1 and W1 timeframe.
There are few threads on the forum about this indicator:
https://www.mql5.com/en/forum/172986
https://www.mql5.com/en/forum/173184
https://www.mql5.com/en/forum/173016
In the following few posts I will try to describe the rules for this system:
- about Ichimoku indicator (summarize from the different sources and from my personal experience as well)
and
- about the other indicators of this system.