Something Interesting in Financial Video July 2014
Forum on trading, automated trading systems and testing trading strategies
Something Interesting in Financial Video June 2014
newdigital, 2014.06.29 20:05
Ichimoku Kinkō HyōIchimoku Kinko Hyo (一目均衡表 Ichimoku Kinkō Hyō) usually just called ichimoku is a technical analysis method that builds on candlestick charting to improve the accuracy of forecast price moves. It was developed in the late 1930s by Goichi Hosoda (細田悟一 Hosoda Goichi), a Japanese journalist who used to be known as Ichimoku Sanjin, which can be translated as “What a man in the mountain sees.” He spent thirty years perfecting the technique before releasing his findings to the general public in the late 1960s.

Ichimoku Kinko Hyo translates to ‘one glance equilibrium chart’ or ‘instant look at the balance chart’ and is sometimes referred to as ‘one glance cloud chart’ based on the unique ‘clouds’ that feature in ichimoku charting.
Ichimoku is a moving average-based trend identification system and because it contains more data points than standard candlestick charts, provides a clearer picture of potential price action. The main difference between how moving averages are plotted in ichimoku as opposed to other methods is that ichimoku’s lines are constructed using the 50% point of the highs and lows as opposed to the candle’s closing price.
https://en.wikipedia.org/wiki/Ichimoku_Kinko_Hyo
- Ichimoku Charts – An Introduction to Ichimoku Kinko Clouds by Nicole Elliott
- Trading with Ichimoku Clouds – The Essential Guide to Ichimoku Kinko Hyo Technical Analysis by Menash Patel
- Cloud Charts – Trading Success with the Ichimoku Technique by David Linton
Forum on trading, automated trading systems and testing trading strategies
Something Interesting in Financial Video June 2013
newdigital, 2013.06.13 11:00
Ichimoku 101 tutorial
This is good tutorial on the high probability strategy for Ichimoku indicator in general. Ichimoku is standard indicator in Metatrader 5 and we can read here about this indicator. Besides, we can use this indicator as a custom one using this entry in MT5 Codebase for example.
From Stocks & Commodities V. 18:10 (22-30):
.
Only now, in the early 21st century, are western traders really beginning to understand the power of this charting system created by one Japanese newspaper writer before the second World War.
Forum on trading, automated trading systems and testing trading strategies
newdigital, 2014.07.01 06:33
Trading Video: EURUSD and GBPUSD Break Higher, USDollar at Critical Support
- EURUSD and GBPUSD put opened with tremendous moves for a week that typically sees liquidity drain rapidly
- Despite the move from these majors, the USDollar is only not facing 16-month support
- The BIS - central bank of the central bank - releases a serious warning on stimulus and financial markets
The FX market is doing its best to fight the seasonal liquidity drain's crash into historically low volatility measures. Both EURUSD and GBPUSD marked notable bullish breaks Monday. While the immediate follow through on the moves was limited, the former breaks against a prominent divergence in fundamental forecasts (monetary policy and interest rates) and the latter is now trading at level last seen since 2008. If these pairs are to gain a foothold, we will likely see the USDollar slip below support that has stood for 16-months - difficult in these conditions. There is plenty of event risk to make this a risk. In other news, the Bank of International Settlements (BIS) has issued the most prominent warning of complacency and financial market risk of any regulatory institution to this point. What does all of this mean for traders? We discuss that in today's Trading Video.
US Dollar Looks to ADP Data, Yellen Speech to Set the Stage for NFP
- British Pound Eyeing UK Construction PMI to Drive BOE Policy Outlook
- US Dollar Looks to ADP Data, Yellen Comments to Set the Stage for NFP
- Australian Dollar Drops in Asia on Disappointing Trade Balance Report
The economic calendar is quiet in European trading hours, with June’s UK Construction PMI reading amounting to the only bit of noteworthy event risk. The measure is expected to decline for the fifth consecutive period, dropping to an eight-month low of 59.8. An upside surprise similar to yesterday’s Manufacturing PMI outcome is likely to feed BOE rate hike speculation and drive the British Pound higher after prices rose to the strongest level in nearly six years yesterday. Needless to say, an underwhelming result stands to produce the opposite effect.
Later in the day, US news-flow returns to the spotlight as June’s ADP Employment figures cross the wires. Markets have a sort of love-hate relationship with the report. On one hand, it is analogous to the closely-watched Nonfarm Payrolls reading and traders can’t seem to help but look at it as a leading indicator. On the other, its predictive powers are highly inconsistent from month to month. Still, the outcome does seem to set a tone ahead of the official jobs figures’ publication. With that in mind, a print north of the expected 205k reading may offer a boost to the US Dollar, and vice versa.
Also of note, Fed Chair Janet Yellen is scheduled to speak at the International Monetary Fund. Her comments will be followed by a conversation with IMF Managing Director Christine Lagarde. Investors will closely monitor the central bank chief’s rhetoric to gauge the likely time gap between the end of the QE3 stimulus program – expected later this year – and the onset of interest rate hikes. Rhetoric suggesting outright tightening may come relatively soon on the heels of the end of asset purchases is likely to boost the greenback, while a cautious tone may inspire continued selling.
The Australian Dollar underperformed in overnight trade, sliding as much as 0.4 percent on average against its leading counterparts. The move followed a disappointing set of Trade Balance figures that revealed a trade deficit of –A$1911 million in May. This amounted to a far larger shortfall than the –A$200 million gap expected by economists ahead of the release. April’s trade deficit figure was also revised down to –A$780 million from the initially reported –A$122 million result.
"On our "Q&A Friday," we had a question is from Ari who wrote:
"Hi Kiana, I find your book very easy to read. I noticed that you are a bit in favor of Ichimoku Kinko Hyo. My question to you is: what are the best time frames in correlation with Ichimoku ? Peace! Ari"
Forum on trading, automated trading systems and testing trading strategies
newdigital, 2014.07.03 13:55
Trade Setups in EUR/USD, USD/JPY, AUD/USD for NFPs
Traders lulled into a daze by the low volatility ought to grab a coffee for this morning - volatility should be back with a vengeance. Thanks to the holiday-shortened week for the July 4 US Independence Day, market participants have been gifted with the European Central Bank rate decision and the release of the US Nonfarm Payrolls report coming within less than an hour of one another.
Of the two, the ECB rate decision will be the less exciting, given the likelihood that the ECB sits pat after unveiling a plethora of measures last month; simply not enough time has passed for policymakers to determine if said measures have proven effective. ECB President Draghi's press conference, in lieu of substantive action, will carry additional weight.
With the June US ADP Employment report showing jobs growth north of +280K (which only tallies private payrolls, not government jobs), there is a distinct possibility that the June US NFP figure comes in above +250K. Considering that the Federal Reserve's tone has started to diverge from incoming economic data (the Fed is behind the curve, as they say), a strong June jobs report could be the spark the buck needs to move off of its lowest levels since October.
See the video above for details on trade setups in EURUSD, EURGBP, AUDUSD, and USDJPYForum on trading, automated trading systems and testing trading strategies
newdigital, 2014.07.04 08:06
EUR/USD Forecast July 4, 2014, Technical Analysis
The EUR/USD pair fell during the course of the day on Thursday, as the jobs number out of the United States came out better than originally anticipated, so this of course grow the value of the US dollar higher against most currencies. The European Central Bank course has suggested that it was ready to do whatever it took to keep the market and economy afloat, and as a result it appears that the ECB could keep monetary policy loose, and perhaps even add to that loosened monetary policy. However, there is a significant amount of noise below, so really this market still looks as if it’s ready to bounce around.
Forum on trading, automated trading systems and testing trading strategies
newdigital, 2014.07.04 08:09
AUD/USD Forecast July 4, 2014, Technical Analysis
The AUD/USD pair fell during the session on Thursday, dropping to the 0.9350 level. That being the case, the market certainly looks like it could fall from here, but there is a significant amount of support down at the 0.93 level, meaning that possibly the market continues lower but only after a significant breakdown. On the other hand, if we get a supportive candle here, we could start buying as well as the market could head back towards the 0.95 handle. The market breaking above the 0.95 handle would in fact be very bullish, and would be more of a buy-and-hold type of situation. However, the last two sessions have been rather brutal against the Australian dollar, so it’s hard to imagine that there isn’t something going on here.
Breaking down from here would send this market down to the 0.92 handle, an area that is massively supportive. Because of that, we do think that there are a couple of possible trades coming up, and we are somewhat ambivalent about which direction the market goes, and will simply wait until we get some type of move in one direction or the other in order to be involved. We believe that either direction will work, but it’s very likely that we could stay between the 0.92 level on the bottom, and the 0.95 level on the top for the time being, and possibly even as long as the summer as the Forex markets could get fairly quiet.
Ultimately, we will have to pay attention to the gold markets as well, as the correlation is well-known between the two markets. On top of that, we have to pay attention to the idea of whether or not the Federal Reserve will be able to taper off of quantitative easing going forward, which of course should boost the value of the US dollar. On top of that, it really puts a beating on the value of the Australian dollar, as it is considered to be a “risky” asset. The markets are at a bit of an inflection point right now, so we will certainly be watching.
Forum on trading, automated trading systems and testing trading strategies
Something Interesting in Financial Video February 2014
newdigital, 2014.01.31 08:39
Every trader needs one. Do you know what it is?Every trader needs one.
Do you know what it is.
Many times it's the difference between success and failure in the market.
Watch the fifth episode of the "Traders Whiteboard" series and learn from master trader Adam Hewison on how to incorporate this key element into your own trading.
===============
How to Build a Four-Point Trading Plan
The ‘What’
The most important aspect of a trading plan is the definition of the type of trader that you are. And if you’re a new trader and aren’t quite sure of what type of trader you want to be, it’s ok to modify this as you see more results and get a better idea of which direction you want to move towards.
The benefit behind this is that it helps to keep you grounded. Let’s say that you’re a technical swing trader, but with an upcoming NFP report you see an especially attractive setup that you decide is worth of a quick scalp position.
Well, if that scalp doesn’t work out and a loss is taken – the ‘what’ of a trading plan serves as a reminder that you were trading outside of your comfort zone.
The ‘How’
A trading plan is worthless without a definition of ‘how’ a trader wants to enter and manage positions. This can be as simple as ‘I’m going to scalp trends,’ to as complex as ‘I’m going to take scalps with 8 period EMA crossovers on the 5 minute chart when price is below the 34 period hourly EMA.’
It really just depends on how in-depth you want to be. The benefit of having a more well-defined strategy in this portion of the plan allows you to come back later to troubleshoot if results aren’t meeting your expectations. A more loosely-defined strategy in this section of the plan may lead to a lack of discipline when you’re actually placing trades as the trader hasn’t made the commitment to the strategy by integrating it as part of their trading plan.
An important note here – the strategy should be yours, customized for your unique risk tolerance and personality. This should also mesh with the ‘what’ of the trading plan, as this is an extension of the type of trader you are.
The ‘When’
This part of the plan is often missed by traders; as many markets somewhat define when you’re actually able to trade. If you’re a stock trader, well you have to adhere to open market hours. Even then, many traders choose to focus on the first or last hour of the day, as this is where the majority of volatility will often take place.
But in the Forex market, there is quite a bit more flexibility available to the trader – and this isn’t always a positive thing. The FX Market moves 24 hours a day, and will often display differing characteristics based on the time-of-the-day and the area of the world that is providing liquidity.
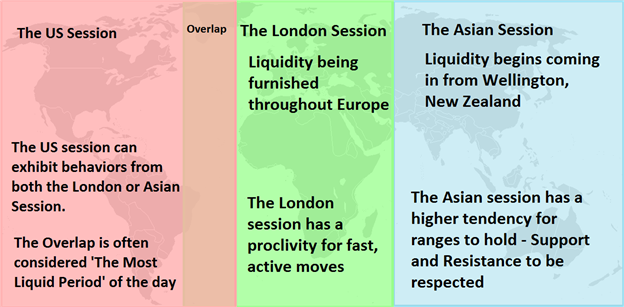
The importance of defining the ‘when’ of a trading plan is that it allows traders to learn and improve upon their strategies and approach with as few moving variables as possible. If a trader normally implements their strategy during the Asian session, but for some reason couldn’t get to sleep and finds themselves trading during the London open with the same strategy; they are introducing an entirely new and unfamiliar risk into their approach.
The ‘Why’
The last part of the plan is, in my opinion, the most important. This is where you write down your goals and reasons for becoming a trader. This can be as ambitious as ‘I want to be a billionaire,’ to as reasonable as ‘I want to replace my income so that I can spend more time with my family.’ I strongly encourage you to set realistic, honest goals otherwise they’re nearly impossible to adhere to. I speak from experience.
Trading isn’t easy. It can be difficult, and tough, and costly, and frustrating all at the same time. Especially when we have fundamental environments that, as we say in Texas, ‘is about as clear as mud.’
The ‘why’ of a trading plan serves as the reminder for why you’re willing to go through the pain; and when times get difficult or a major drawdown is seen on the account, this can help to provide perspective of ‘the bigger picture.’ This allows the trader to take a step back in order to realize that the reasons they want to become a successful trader are worth any trials or tribulations that they may go through.
If the goal doesn’t seem worth the frustration any longer, then at the least you know its time to take a step back and either re-evaluate your options, or quit.
===============
Forum on trading, automated trading systems and testing trading strategies
Something Interesting in Financial Video February 2014
newdigital, 2014.02.02 09:07
Ichimoku - Kumo Cloud Studies I
- Ichimoku - about this indicator in general, what every line of this indicator means.
- Ichimoku cloud, how to use it with trading
- Ichimoku Trading - Ichimoku Training - Support and Resistance with the Ichimoku Cloud Trading
- Kumo Breakout Trading with the Ichimoku System.
- Ichimoku vs Moving Average Trade Analysis.
- Ichimoku vs Moving Average Trade Analysis
- Technical Analysis Course - Module 10: Cloud Charts: the Ichimoku Technique
- Ichimoku - Drawbacks Of Ichimoku Kinko Hyo
Trading Video: Equities Threaten a Turn, Dollar Not Yet Impressed
- Event risk put the focus on rate forecasts, but risk trends carried the greater weight
- Global equities were fading - raising the threat level on a possible risk reversal
- Meanwhile, tepid data from the UK and status quo from Fed speakers couldn't drive GBPUSD below 1.7000
Discontent is stirring amongst the contented speculators. Low volatility and an appetite for yield go hand-in-hand, but even die-hard bulls doubt its much longer lived. Given the breadth of opportunity, market participants are itching for the swell of trend and abundance of opportunity that comes along with a shift in speculative appetites. Yet, we have seen too many starts to be drawn in without confirmation. Global equities made the biggest contribution to a risk interest with heavy selling particularly in Europe. However, that is only the first level of a risk-derived move. Volatility measures, FX participation and fundamental moorings are necessary to alter such a remarkable trend. Will we finally find it? We discuss what to watch and what to trade in today's Trading Video.
- Free trading apps
- Over 8,000 signals for copying
- Economic news for exploring financial markets
You agree to website policy and terms of use
Trading and training video (from youtube for example) about forex and financial market in general.
Please upload forex video you consider as interesting one. No direct advertising and no offtopic please.
The comments without video will be deleted.