Don`t read this thread..Make Money with it. - page 26
You are missing trading opportunities:
- Free trading apps
- Over 8,000 signals for copying
- Economic news for exploring financial markets
Registration
Log in
You agree to website policy and terms of use
If you do not have an account, please register
Mmm, this is interesting!
Re: Don`t read this thread..Make Money with it. Mmm, this is interesting!
Any success ?
Any success ?
Since there are no new posts - almost sure
Forum on trading, automated trading systems and testing trading strategies
Indicators: XPoints
Sergey Golubev, 2014.04.10 06:43
How to Trade Double Top (based on dailyfx article)
- The Double Top is bearish price pattern that consists of two peaks with a trough in between forming an M-shape.
- The double top’s height in pips is used to project the distance of a bearish breakout.
- EURJPY has formed a double top price pattern on the daily time frame chart.
Chart patterns, like the forex double top are warning signs that the current trend is about to reverse. In the double top, a bullish surge forms the first peak. Next there is a profit taking decline that ends at a level of support. As price rebounds from this level, bargain hunters and other buyers jump back into the market anticipating a move to new highs.However, as price returns to the general area of the last peak, buying momentum starts to evaporate. Price struggles with the old high and traders start dumping their positions. Price’s failure to make a new high sparks bearish sellers to come en masse to drive prices lower.
As we can see in the Forex Double Top diagram, the signature M-formation illustrates bears taking control of price action. However, the goal for the sellers is to drive price below the neckline. This would confirm that this pattern is, in fact, a double top. It is at that red circle that Forex traders will look to enter short.
Remember those bargain hunters that got long earlier? Well now those stops are located below this neckline. Stops that protect long positions become sell orders at market when price touches them. This push through neckline creates the acceleration that the sellers are looking for. Usually, the height of the forex double top can be projected from the neckline to determine a price objective.
A Real Time Example: EURJPY Daily Chart
Now that you have seen a textbook double top chart, let’s look at current trade setup. In the EURJPY daily chart we see a strong 660-pip rally that ended on 3/7 at 143.77. Next, a 50% profit-taking decline took price to the 139.93 level before bargain hunters jumped on board for a ride to new highs. However, the EURJPY advance stalled on 4/2 just shy of the old high. Price began falling back to the neckline found in the 140.00 region. Though not a textbook double top, some leeway can be granted when comparing the peaks.
EURJPY is holding a trendline in the 140.00 area. Round numbers can be formidable areas of support. In this case, we would want to see price break and close below the 140.00 area and the neckline. It may pay to wait for the price action to confirm the double top pattern. If our price is not hit, then we will need to look for another trade as our entry criteria was not hit.
Sometimes, after a breakout, price returns to retest the breakout point. This would be a favorable entry as the stop could be placed above the last swing high. Again the key is not to jump in early but wait for convincing confirmation.
Taking Profit
The height of this EURJPY Double top pattern is approximately 382-pips. From this we can project a target of 135.81. However, there is a bit of support circled on the chart at 136.20 that could be strong enough to turn prices upward. In sum, the forex double top should be viewed with much suspicion until confirmation is shown. Once price closes below support, the move down can be a rewarding one.
Forum on trading, automated trading systems and testing trading strategies
Indicators: Levels
Sergey Golubev, 2013.11.13 07:42
How to Trade a Descending Triangle
Talking Points
===============
What is a Descending Triangle pattern?
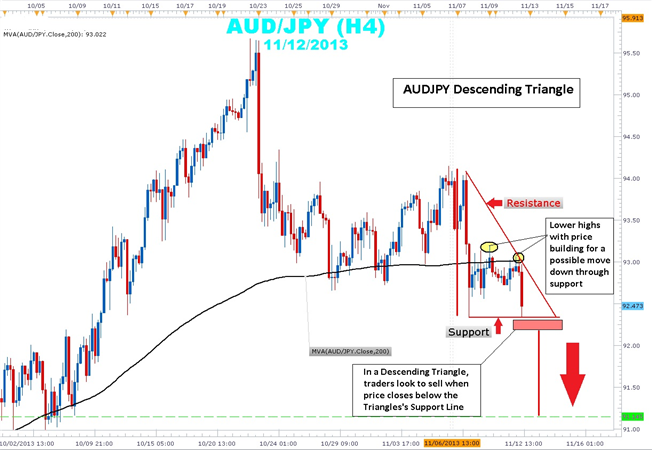
A descending triangle pattern is consolidation price pattern composed of lower swing highs pushed lower by an established downtrend line converging with a horizontal support made up of a series of swing lows located in roughly the same area. Another name for the descending triangle is the right triangle pattern due to its similarity to the geometric shape of the same name. The height of the triangle meets the horizontal support at a 90 degree angle.
Usually, descending triangles form as profit taking by sellers is met with bargain hunting buyers. However, the buying pressure is mutted as higher lows are not made. A news release or economic announcement could be the catalyst required to push price out of this coil tilting the balance strongly in the seller's favor. Unlike its cousins, the symmetrical triangle and ascending triangle, the descending lacks significant bullish participation indicated by that lack of higher lows.
Taking a look at the current AUDJPY 4-hour chart, you can clearly see price action bound between a descending trend line that connects the 11/6 swing high of 94.15 to 11/12 swing high of 93.05. This swing high is a lower swing high than the 11/10 93.19 swing high showing the building strength in the downtrend. Current price action within the triangle is below the 200 simple moving average (SMA), a key indicator that traders use to determine bullishness or bearishness.
Traders will watch price action for a 4-hour candle close below support to confirm that there is follow through in a potential breakout. Stops can be placed near the middle of the triangle just above the 93.00 and 200 SMA. The height of the triangle is a little over 170 pips. By extending this height from the support level of a potential breakout zone, look for a possible target of 91.14. The profit target coincides with the lows seen back on October 2nd.
In summary, descending triangles can be an excellent way to rejoin a downtrend that clearly illustrates risk and reward. Price has a tendency to break form the descending triangle in a downward direction.
Forum on trading, automated trading systems and testing trading strategies
Indicators: Levels
Sergey Golubev, 2014.06.04 12:44
Gold Presses Fibonacci Wave Relationship
- Triangles are consolidation patterns that tend provide clean technical levels to trade from
- Gold may be nearing a bullish reaction point that offers a trading opportunity to buy
- Try trading gold in a practice demo account
Gold appears to be consolidating in a sideways triangle for the past 12 months. This is a big consolidation pattern that offers some trading opportunities inside the triangle.Look for the yellow metal to find support over the next several days and a potential $100 rise in the price of the gold.
The Anatomy of a Triangle
Triangles are consolidation patterns that allow prices to trade sideways in an effort to alleviate overbought and oversold pressures. In the case of gold, it has been working its way lower for the past three years and needs to consolidate those losses, which it has been doing in the triangle pattern.
Elliott Wave triangles are made up of five waves inside the triangle with each wave being contained inside the previous wave. In the idealized example above, notice how wave ‘B’ ends BEFORE the beginning of wave ‘A’. Notice how wave ‘C’ ends BEFORE the beginning of wave ‘B’. This continues until prices squeeze together in five waves (A-B-C-D-E) then they eventually explode.
In the same idealized example above, it appears gold is closing in on the end of the ‘D’ wave which should yield a bounce higher in wave ‘E’.
wave ending near $1235 per ounce. Both wave relationships are expressed through alternating waves having a fibonacci relationship in length.
First, inside the green ‘D’ wave, you’ll see we have a blue a-b-c sequence. Many times, the length of wave ‘c’ will have an equality or fibonacci relationship to the length of wave ‘a’. In the case for gold, the length of blue wave ‘c’ equals blue wave ‘a’ times 61.8% at $1235 per ounce.
Secondly, green wave ‘B’ and green wave ‘D’ are alternating waves. If you take the distance of green wave ‘B’ and multiply it by 61.8% and project it for a distance on green wave ‘D’, it yields a price target of $1235 per ounce.
So we have two different alternating waves pointing to the same price target. This means there will likely be a reaction higher near $1235. If $1235 does fail, look to $1190-$1200 providing significant support.
The price target to the upside in this scenario would be $1340-$1390. So there is enough room to the upside to position towards the long side of the trade.
Patterns
I just cannot imagine lots of traders are so hook in finding the right strategies, modifying these and that yet still a wide majority of traders in this business loss money, if indicators and trading system makes a trader profitable, then why the winners losers ratio is still a big margin? in my 9 years in this profession I have tried thousands of so called profitable system yet nothing works in the long run, the best way to beat the market is create your own strategy based on your personal experience, knowledge and belief system, trading is a personal thing.
I just cannot imagine lots of traders are so hook in finding the right strategies, modifying these and that yet still a wide majority of traders in this business loss money, if indicators and trading system makes a trader profitable, then why the winners losers ratio is still a big margin? in my 9 years in this profession I have tried thousands of so called profitable system yet nothing works in the long run, the best way to beat the market is create your own strategy based on your personal experience, knowledge and belief system, trading is a personal thing.
Forum on trading, automated trading systems and testing trading strategies
Something Interesting
Sergey Golubev, 2017.09.18 11:53
New interesting article was published today:
The Flag Pattern