Indicators: XPoints
How to Trade Double Top (based on dailyfx article)
- The Double Top is bearish price pattern that consists of two peaks with a trough in between forming an M-shape.
- The double top’s height in pips is used to project the distance of a bearish breakout.
- EURJPY has formed a double top price pattern on the daily time frame chart.
However, as price returns to the general area of the last peak, buying momentum starts to evaporate. Price struggles with the old high and traders start dumping their positions. Price’s failure to make a new high sparks bearish sellers to come en masse to drive prices lower.
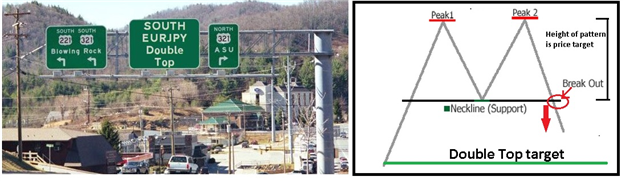
As we can see in the Forex Double Top diagram, the signature M-formation illustrates bears taking control of price action. However, the goal for the sellers is to drive price below the neckline. This would confirm that this pattern is, in fact, a double top. It is at that red circle that Forex traders will look to enter short.
Remember those bargain hunters that got long earlier? Well now those stops are located below this neckline. Stops that protect long positions become sell orders at market when price touches them. This push through neckline creates the acceleration that the sellers are looking for. Usually, the height of the forex double top can be projected from the neckline to determine a price objective.
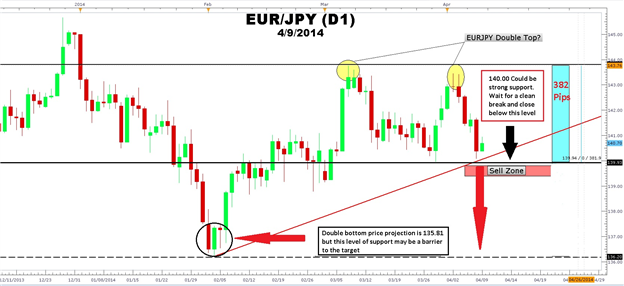
A Real Time Example: EURJPY Daily Chart
Now that you have seen a textbook double top chart, let’s look at current trade setup. In the EURJPY daily chart we see a strong 660-pip rally that ended on 3/7 at 143.77. Next, a 50% profit-taking decline took price to the 139.93 level before bargain hunters jumped on board for a ride to new highs. However, the EURJPY advance stalled on 4/2 just shy of the old high. Price began falling back to the neckline found in the 140.00 region. Though not a textbook double top, some leeway can be granted when comparing the peaks.
EURJPY is holding a trendline in the 140.00 area. Round numbers can be formidable areas of support. In this case, we would want to see price break and close below the 140.00 area and the neckline. It may pay to wait for the price action to confirm the double top pattern. If our price is not hit, then we will need to look for another trade as our entry criteria was not hit.
Sometimes, after a breakout, price returns to retest the breakout point. This would be a favorable entry as the stop could be placed above the last swing high. Again the key is not to jump in early but wait for convincing confirmation.
Taking Profit
The height of this EURJPY Double top pattern is approximately 382-pips. From this we can project a target of 135.81. However, there is a bit of support circled on the chart at 136.20 that could be strong enough to turn prices upward. In sum, the forex double top should be viewed with much suspicion until confirmation is shown. Once price closes below support, the move down can be a rewarding one.

How to Trade EURJPY with Yearly Pivot Points
- Gregory McLeod
- www.dailyfx.com
While a strong uptrend in the second half of 2012 which carried EURJPY into 5-year highs in 2013, EURJPY has been fairly tame in 2014. EURJPY was fueled by a loose Japanese monetary policy affectionately called “Abenomics” named after the Japanese Prime Minster, Shinzo Abe. His “three arrows” plan of fiscal stimulus, monetary easing, and...
You are missing trading opportunities:
- Free trading apps
- Over 8,000 signals for copying
- Economic news for exploring financial markets
Registration
Log in
You agree to website policy and terms of use
If you do not have an account, please register
XPoints:
The indicator predicts the possible reversal points
Author: Nikolay Kositsin