Requests & Ideas, the beginning - page 159
You are missing trading opportunities:
- Free trading apps
- Over 8,000 signals for copying
- Economic news for exploring financial markets
Registration
Log in
You agree to website policy and terms of use
If you do not have an account, please register
ok i will try to explain... can you make these atr levels to look like step, or with pctFilter?
Try this out (atr filter set to 3 in the example)
my offine chart is looking like this..no bars..what cud be wrong..
I used the ' equalvolumebars ' indicator and I got a chart instantly (the one attached)...what historical data could that be using...
Doesn't work for me. Offline chart is only waiting for update. It shows error #5004 (csv file handling error - build 950)
Yes, no time domain. It's like renko chart. I didn't found any good one for free to play with. Some traders seems to be into tick charts, S/R and TLs and so on seems to work as well. Görtzel could be useful here too "in the frame of its possibilities" ;)
Try this out (atr filter set to 3 in the example)
tick chart look pretty close to time chart , maybe little better geometry of impulse/corrections . range chart seems really useful for trading purpose though .
I know, then you can only do PA. It's ok, but unfamiliar, kinda naked and fuzzy. Isn't it better to have the time domain as well, when you go fishing sharks?
I know, then you can only do PA. It's ok, but unfamiliar, kinda naked and fuzzy. Isn't it better to have the time domain as well, when you go fishing sharks?
i'm not fishing sharks , just a cockroach trying to survive in jurassic period !! btw i found a workin range bar chart . u can compare 20range chart with "noraml" time chart(attached one) .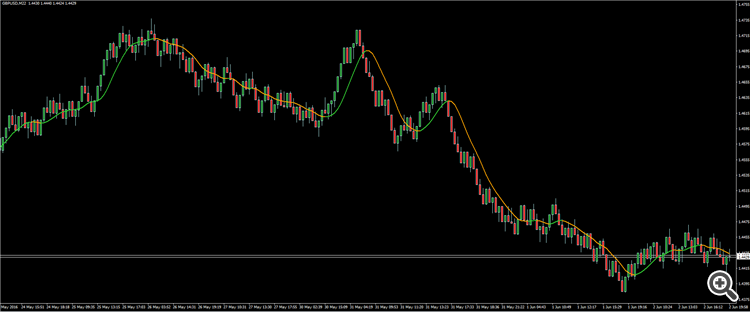
for details check this link were "everything" is already discussed : http://www.forexfactory.com/showthread.php?t=390663
interesting reading can be found here : http://www.forexfactory.com/showthread.php?t=481691
Do it repaint as Renko charts? The diffrence isn't big, maybe they have the same problem. mladen, do you know more?
Why not using tick data indicator - it is virtually the same as "equivolume" for forex symbols, since the volume are ticks - and it works correctly (even EAs can be attached to it). Attaching the newest version (which allows some customization not available with previous versions)
u'r right , looks like there's no way to show the "tick" chart of past data & it must be recorded live. equalvolumebars indi setting is misleading cause it says "tick per bar" but it's actually volume per bar . i think there a high correlation between (+90%)volume and tick so i might actually check to see is there any difference between ur tick indi and eqvlm