Forecasting indicators - page 18
You are missing trading opportunities:
- Free trading apps
- Over 8,000 signals for copying
- Economic news for exploring financial markets
Registration
Log in
You agree to website policy and terms of use
If you do not have an account, please register
Seems - first version is better - it is the statement for today:
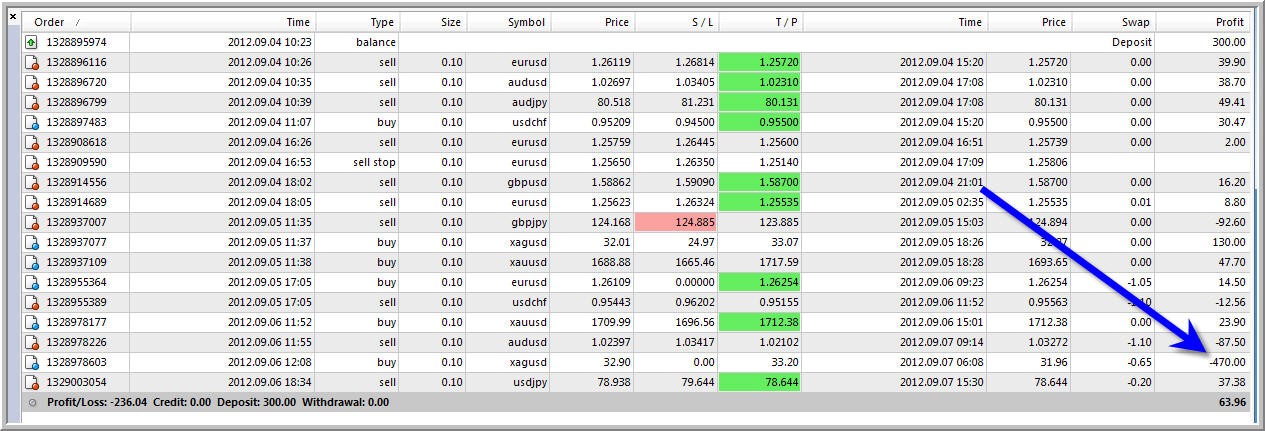
I traded using this WmiFor indicator from this post for 3 days starting with 300 dollars deposit.
I do not believe in magic indicators but seems it works having some probability.
I traded 12 pairs ... it was very good ... i used stop loss 70 and take profit 30 pips (4 digit pips) ... but I lost on silver/usd as never traded silver before sorry:
Because ... what is 4 or 5 digit for XAGUSD if the price is having the value as 32.92 for example?
buy or sell...
I traded using this WmiFor indicator from this post for 3 days starting with 300 dollars deposit.
I do not believe in magic indicators but seems it works having some probability.
I traded 12 pairs ... it was very good ... i used stop loss 70 and take profit 30 pips (4 digit pips) ... but I lost on silver/usd as never traded silver before sorry:
Because ... what is 4 or 5 digit for XAGUSD if the price is having the value as 32.92 for example?The WmiFor30 says clearly if to buy or to sell, but where this say it?
Buy or sell on the chart?
It is next version of this indicator (WmiFor30) from here:
https://www.mql5.com/en/forum/172904/page12
I do not like this indicator because it is nto written the probability of the direction (buy or sell) in percentage ... and because buy or sell direction is not a pattern.
I traded the first version of this indicator (WmiFor) https://www.mql5.com/en/forum/172904/page11 because this indicator is continuing the price to the future using some kinds of patterns and the probability in percentage (so - we can always select future pattern with more highier probability switching the chart between timeframes).
By the way - this idea to make a forecasting based on patterns are not new idea.
As I remember - I tested/traded some pattern indicator for Metatrader 5 on this section so the developing patterns (any developing/unformed patterns can provide good forecasting too (with some probability of course):
=============
- HWAFM tool for Metatrader 5 is here;
- How to instal - read started from this page till this one
- How to instal HWAFM tool for Metatrader 5 for Windows 7 : read this page till this one.
- Trend Scalp system for M1 timeframe for Metatrader 4 to be used together with HWAFM tool for Metatrader 5: public version and elite section version.
- how to trade using HWAFM patterns tool for Metatrader 5 and Trend Scalp system for M1 timeframe for Metatrader 4 in the same time :some trading examples/trading statements/results started from this page till this one; explanation about trading styles - read this post
================
Examples.
1. if we see developing patterns (any developing patterns) so can we say about possible direction of the price in the near future? yes, we can - with some probability of course (because developing patterns are "repainting").
2. If we see formed patterns so can we say about possible direction of the price in the near future?
yes, in most of the cases. Why "in most of the cases"? Because in some cases the price was already realized this possibility for "future movement" - price was moved in "right/correct" direction in case of patterns were formed. Too late sometimes ...
3. If we see any standard/classical indicator so can we say about future possible direction of the price movement in the near future?
Yes, even if trading on close bar - we can: overbough/ovesold levels and so on.
4. If we see any such as recalculating indicators so can we say something about near future?
yes. because any recalculating indicator is providing the following informating to us: "what is going on with the price right now". And this information is providing with 100% probability (because next minutes will be next information - in case of recalculating indicators).
We can use this information for forecasting? yes, on the same way as non-repainting indicators (which are providing the information about "what was happened some time ago with 100% probability"
5. Well. Any indicator ... can be used for forecasting? Yes.
- if indicator is not repainting so we are having the information about "what happened with the price some time/bars ago with 100% probability". And we can "play" with the value of this indicator to understand the future.
because ... when we use closed bar ... closed bar is previous bar, right? but I am sorry - we are making forecasting all the time - we making conclusion that "i will open buy because stochastic is below 30 for one bar ago" ...:)
- re-calculating indicators? yes. Using those kind of indicators so we can understand about "what is hapenning right now with 100% probability". And we can use this information for forecasting.
I just hope that programnmers will create some kind of global forecasting meter/system with many indicators and with probability of this forecasting. And in this case - our tsd forecasting will be much more better than weather report because weather report (if not a name of jazz band with Birdland song) is coming to us without any probability, right? Just switch TV on for any weater report ... no any talking about probability of their forecasting ...
But we (our forex forecasting) will be with probability ... and probability = choice
It was my explanation about why I like forecasting.
Of course, this probability is having probability too ... i mean: how it was calculated with percentages if we do not know the future ...
But it is the other story.
If we understand any forecasting probability as the following:
comparing the sample with past cases ... so let's create some example.
1. Case 1.
Indicator Stochastic.
Sample:
- indicator's lines is crossing level 20 from below to above;
- results: price will go to uptrend.
So, if we will create some tool or indicator which can look back to the history to find similar cases, and opposite cases so we will have probability.
For example, for EURUSD H1 timeframe ... with this Stoch settings ... for this number of bars dowloaded from the history ... we will have 10 pluses as "+" and 10 minuses as "-" so it will be 50% of the probability that price on my chart on the previous post will do to uptrend (just for example ... as price already went to uptrend because this case/pattern was formed).
Let's complicate this subject.
1. Case 2.
Indicator Stochastic (for example).
Sample:
- indicator's lines is crossing level 20 from below to above;
- results: price will go to uptrend up to 10 bars more
It may be calculated on the same way: this sample is comparing to the history to select all the events, and similar events, and calculate the probability.
Let's complicate it more.
1. Case 3.
Indicator Stochastic (for example).
Sample:
- indicator's lines is crossing level 20 from below to above;
- results: price will go to uptrend
Calculation:
- the tool may calculated everything according to similarity (similar case may be "+", opposite case (means: price did not go to uptrend) will be "-".
and
- the tool may calculate the probability for the price movement. if we can take similar cases so we can make same calculation but for price movement by candles. For example, we have 10 similar cases on the history. How the price was moved in those cases? There are some similarity for that, and probability for it?
In this case -we will have direction of the movement as forecasting
+
we can continue the price by candles/bars to the future with some probability too:
In case of recalculating indicators -we need just the part of the indicator which were/are not recalculated yet (last few bars). In this case - we can not "backtest" this indicator (because past history was recalculated already) but it may be possible to look to the history for similar non-recalculated cases mathematically.
In this case - we will have more precision results of forecasting.
That's all news.