Press review - page 173
You are missing trading opportunities:
- Free trading apps
- Over 8,000 signals for copying
- Economic news for exploring financial markets
Registration
Log in
You agree to website policy and terms of use
If you do not have an account, please register
Forum on trading, automated trading systems and testing trading strategies
Indicators: EES V Speed
newdigital, 2014.06.07 07:43
3 Reasons Volatility Might Increase (adapted from Forbes article)
Where art thou volatility? Not here, nor there, but soon to revive, me thinks. Volatility in risk markets is simply the measurement of variation in prices which is often calculated over certain time periods and against the idea of a normal distribution. The most important markers are historical (statistical) volatility and implied volatility. Historical volatility is a retrospective measurement of actual pricing variations whereas implied volatility is the theoretical price of an asset taking into account actual prices, historical volatility, a time component and the risk free rate within a pricing model such as the Black-Scholes model. Both historical and implied volatility have recently declined to cycle lows in many asset classes. The consensus call is for continued calm waters and a potential further decrease in volatility. The consensus call for tame volatility may be underestimating three potential drivers to higher volatility this year: rising inflation and Federal Reserve policy, a taper tantrum and geopolitical unknowns.
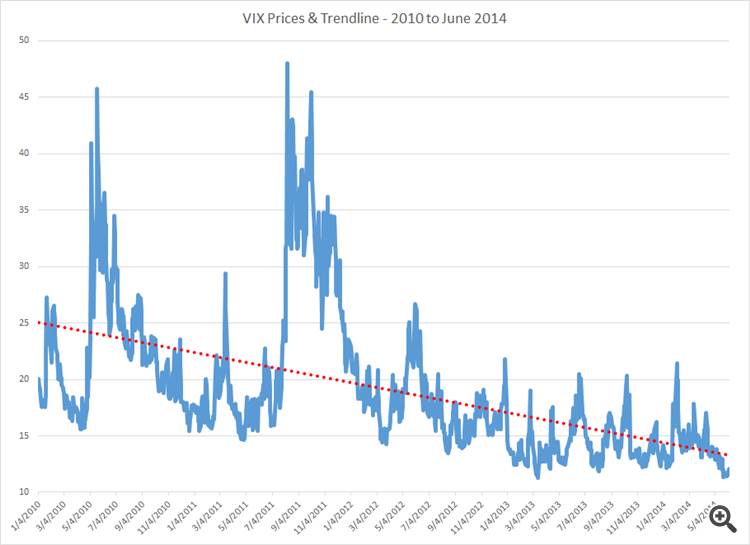
The most popular measure of market volatility in the US is the CBOE Market Volatility Index (the “VIX”) which is also known rather ominously as the “fear gauge.” The VIX measures a weighted average of the implied volatility of a wide range of S&P 500 options with a 30 day maturity. Quite simply, the VIX is the implied volatility of the S&P 500 and is frequently thought of as the market’s broad expectation of volatility over the next 30 day period. The VIX has been on a downward trajectory since 2010.
The VIX has an audience across asset classes as it can give insight into the short term biases and leanings of US equity market participants. To be clear, the VIX is one tool to measure perceived volatility and although a high VIX or an upward trend is most often the result of a declining equity market, the gauge can increase as well when call holders refuse to sell options absent a larger premium. Thus, the VIX can be a measure of upside or downside moves with higher numbers representing the anticipation of sharper moves. Somewhat ironically, there are many instances where higher VIX prices correlate strongly to higher prices in the S&P 500 as the fear dissipates and markets readjust.
The VIX and other measurements of volatility have continued to trend down for many reasons including the fact that the world’s central banks have maintained highly accommodative monetary policies. The European Central Bank has just announced a program of direct asset purchases including the cessation of the “sterilization” of their current markets program. Moreover, secondary central banks like the Bank of Mexico have cut rates in an effort to spur higher inflation. Assuming a direct correlation between liquidity and volatility, all of these programs should act as a governor to higher volatility. Other reasons offered to explain the calmness in markets include exceedingly low trading volumes, range bound markets, recently improving economic data and fewer economic surprises, the transparency of corporate reporting, and the perception that there is no immediate catalyst to drive volatility higher.
Although the trend in volatility is clearly downwards, current complacency should not be mistaken for a permanent drift to lower levels without significant bumps higher and mini-reversals within the trends. Once again, investors are putting their faith into central banks which are doing the one thing that they ostensibly know how to do and have done continuously since 2008 – providing ever increasing amounts of liquidity. To be sure, the ultimate effect of non-traditional monetary policy is unknown and the Federal Reserve and the Bank of England are poised to withdraw some of their stimulus in the medium term. Already, markets are pricing in rate hikes in the US for mid-2015 yet doing so without increased volatility. It is reasonable to suggest that the greatest risk to increased volatility and general market stability may be a mismatch between Federal Reserve policies, the expectations of the bond market and microeconomic data. This triumvirate of fast friends may find itself in an increasingly uncomfortable alliance should US inflation data significantly or unexpectedly increase. Admittedly, higher US inflation in a world currently exporting deflation to US shores is not likely to result in the sustained kind. However, the prospect of Chair Yellen attempting to explain away asymmetric inflation readings as transitory should push up volatility in the bond market.
There is also sensibility in remembering that monetary policy changes frequently take longer to translate to market prices than assumed. It is quite possible that the lingering effects of central bank liquidity will not be felt as a primary cause of higher volatility but rather a second derivative premised upon some otherwise routine market upheaval. When long positions are longer and short positions are shorter, based upon liquidity rather than fundamentals, the correlation between liquidity and volatility cited as calming the markets may cut both ways. Increased liquidity may provide for smooth markets at the outset but higher levels of risk may creep upon casually disciplined risk managers and with it the miasma of higher volatility.
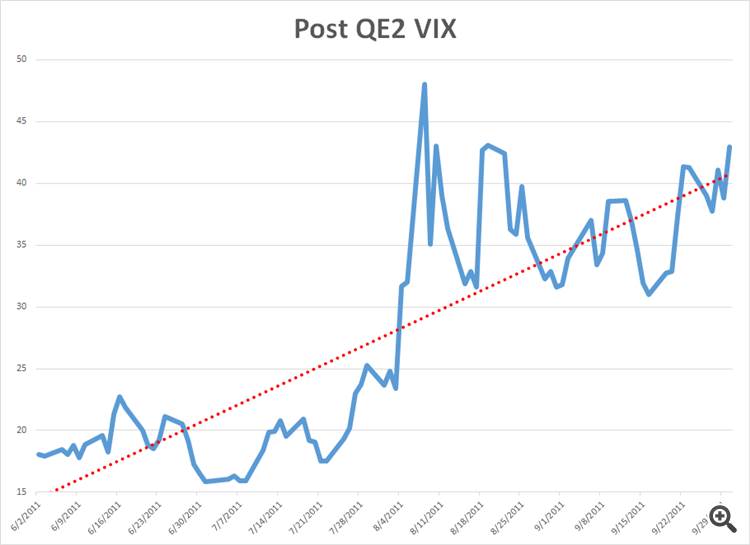
Another reason that volatility could creep higher is the possibility of a “taper tantrum” over the final end of Quantitative Easing. As an analogue one need only to look at the increase in volatility as measured by the VIX after QE2 ended in June of 2011.
The Federal Reserve’s “stock versus flow” argument will be put to the ultimate test assuming tapering continues apace and QE ends toward the end of 2014.
Volatility may also temporarily and dramatically increase due to unexpected geopolitical events. There is a mini civil war in Ukraine right now and it threatens to draw European powers into supporting a proxy contest for Eastern Ukraine between Russia and the West. While Europeans go about deciding where to holiday this summer, the conflict in Ukraine is likely to remain in a sort of pressure cooked stasis. Once the weather turns cold and natural gas for heating is no longer an abstraction the conflict in Ukraine will either resolve quickly or find another gear. Beyond Ukraine, nuclear negotiations with Iran continue to simmer, China and Japan yap at each other and Assad kills off his critics in Syria. Any of these issue may cause a spike in volatility and to expect all of these issues to transpire exactly as a game planned seems rather naïve.
It is true that volatility has decreased. The CBOE Commitments of Traders Report for VIX futures shows a significant net long position for financial players confirming the bias to groupthink towards increasingly lower volatility. This tendency towards anticipating ever decreasing or steadily low volatility flies in the face of the fact that the VIX currently trades at a 45% discount to its longer term historical price average of $20. The odds of a temporary spike in volatility are very good over the remainder of the year and a reversal to slightly higher trend volatility is especially plausible should microeconomic conditions warrant even a slight rethink of monetary policy scenarios. To profit from volatility, is usually to buy it when it is not needed, rather than when the consensus theory is “unexpectedly” being pilloried and volatility is exploding higher.
Forum on trading, automated trading systems and testing trading strategies
Something Interesting in Financial Video June 2014
newdigital, 2014.06.07 09:21
Forex Trading Video: Watch EURUSD for Risk, GBPUSD and NZDUSD For Rates
There is no escaping the growing unease as traditional volatility readings tumble to multi-year and even record lows. And, for FX traders, the most exposed currency pair may be EURUSD. This past week's ECB stimulus push has both stoked investors' push for return and exacerbated an already prominent dependency for the Euro on status quo risk trends. This pair is a focal point for the two key drivers moving forward. Sentiment trends are building to be a greater and greater threat by the week, but that is not a trade to implement until systemic tides have turned. In the meantime, interest rate expectations have been stirred for the Euro and US Dollar this past week, and event risk will do the same for the Pound and Kiwi ahead. We discuss this and more in the weekend Trading Video.
Rate decision in New Zealand and Japan, employment data in the UK, Australia and the US and US retail sales are the highlights of this week. Here is an outlook on the main market-movers coming our way.
Last week, US Non-Farm Payrolls showed a 217K gain in jobs in May reinforcing estimates that the five-year-long recovery has accelerated this spring. April’s jobs addition was the best in more than two years. Meanwhile the unemployment rate remained unchanged at 6.3% in May, matching the lowest level since September 2008. Analysts expected a lower job addition of 214,000 and a higher unemployment rate of 6.4%. May’s advance tops the average monthly gain of about 200,000 during the past year. Will this positive trend continue?
FOMC Voters 2014 Dove Hawk Scale
by Kathy Lien
The Federal Reserve’s Open Market Committee changes every year and 2014 in particular iss a big year for the Federal Reserve because there are a number of new faces on the Federal Open Market Committee or FOMC. With her official confirmation on Monday, Janet Yellen will become the first woman to lead the world’s most influential central bank. Having served as the Vice Chair of the Federal Reserve since 2010, she is not new to the FOMC but her voice will be heard much louder this year in the highly anticipated quarterly post monetary policy meeting press conferences. Yellen is a vocal dove that puts growth ahead of inflation but actions speak louder than words and her vote to taper asset purchases in December suggests that as Fed Chair, she may not be as dovish.
Every year, the makeup of the Federal Open Market Committee also changes with previous voters rotating out and new voters rotating in. This year’s policymakers have the huge responsibility of determining the pace that asset purchases will be tapered and when Quantitative Easing will end.
Two major doves favoring easier versus tighter monetary policy (Evans and Rosengren), one moderate hawk who favors tighter policy (George) and one centrist (Bullard) will be rotating out of voting positions. They will be replaced by Plosser and Fisher, two major hawks, Pianalto a moderate dove and Kocherlakota, who shares a similar bias as Yellen.
Former Bank of Israel Governor Stanley Fischer has also been nominated to replace Yellen as Vice Chair and if confirmed, another hawk would be added to the roster.
There will also be 2 vacancies this year – Elizabeth Duke’s seat (she retired in summer of 2013) and Sarah Raskin’s slot once she moves over to the Treasury. Jerome Powell’s term ends January 31st but President Obama is considering a reappointment. This would leave the central bank more hawkish and willing to follow Bernanke’s proposal for reducing asset purchases by $10 billion at every meeting this year.
Forum on trading, automated trading systems and testing trading strategies
Something Interesting to Read February 2014
newdigital, 2014.02.14 14:53
Millionaire Traders: How Everyday People Are Beating Wall Street at Its Own Game
by Kathy Lien
Trading is a battle between you and the market. And while you might not be a financial professional, that doesn't mean you can't win this battle.Through interviews with twelve ordinary individuals who have worked hard to transform themselves into extraordinary traders, Millionaire Traders reveals how you can beat Wall Street at its own game.Filled with in-depth insights and practical advice, this book introduces you to a dozen successful traders-some who focus on equities, others who deal in futures or foreign exchange-and examines the paths they've taken to capture considerable profits.
With this book as your guide, you'll quickly become familiar with a variety of strategies that can be used to make money in today's financial markets. Those that will help you achieve this goal include:
===============
Other books by Kathy Lien :
USDJPY Fundamentals (based on dailyfx article)
Fundamental Forecast for Japanese Yen: NeutralThe USD/JPY may continue to consolidate in the week ahead as it retains the wedge/triangle formation from earlier this year, but the Bank of Japan (BoJ) interest rate decision may heighten the appeal of the Yen as the central bank is widely expected to retain a positive outlook for the region.
Indeed, BoJ board member Takehiro Sato argued that there is ‘no need’ to adjust policy at the current juncture as the central bank continues to anticipate a ‘moderate’ recovery, and it seems as though we will get more of the same at the June 13 meeting as Governor Haruhiko Kuroda remains confident in achieving the 2% target for inflation over the policy horizon. However, we may see a growing number of BoJ officials scale back their dovish tone for monetary policy as the sales-tax hike underpins the fastest pace of price growth since 1991, and a further shift in the policy outlook may continue to dampen the bearish sentiment surrounding the Japanese Yen as the central bank remains in no rush to further expand its asset purchase program.
With that said, it seems as though the Fed will also stick to its current course for monetary policy as Chair Janet Yellen remains reluctant to move away from the zero-interest rate policy (ZIRP), and the USD/JPY may continue to face a narrowing range over the near-term as the Federal Open Market Committee (FOMC) looks to carry its highly accommodative policy stance into the second-half of the year.
As a result, the USD/JPY may continue to face a narrowing range as it struggles to push above the May high (103.01), but the dollar-yen remains at risk of facing increased volatility during the summer months as it approaches the apex of the wedge/triangle formation from earlier this year. In turn, a less-dovish BoJ interest rate decision may generate a more meaningful decline in the USD/JPY, and the pair may come up against the 101.40-50 region to test for near-term support amid the ongoing series of lower-highs in the exchange rate.
GBPUSD Fundamentals (based on dailyfx article)
Fundamental Forecast for Pound: NeutralThe British Pound finished the week almost exactly where it began, but key UK employment data releases on the calendar promise bigger moves in the week ahead.
Lack of action from the Bank of England kept the Sterling in a tight range versus the US Dollar, while extensive action from the European Central Bank actually forced the Euro/GBP exchange rate to its lowest since 2012. Key technical indicators suggest that the British Pound may nonetheless be at risk of declines versus the Euro and US Currency. A news-driven catalyst could come on upcoming UK Jobless Claims and Unemployment Rate data.
Analysts expect that the UK jobless rate fell to fresh five-year lows in April, and continued outperformance in the labor market will put further pressure on the Bank of England to raise rates through the foreseeable future.
Indeed it was an important reversal in UK interest rate expectations that pushed the Sterling to fresh multi-year highs. Thus any significant disappointments in top-tier economic data could force GBP pullbacks. The bullish forecasts for the key figures leave risks to the downside for the British currency.
Those waiting for substantial GBP volatility may nonetheless need to wait for a change in broader market conditions; 1-week volatility prices on GBPUSD options have fallen near record lows. We may look to sell any important rallies as we see clear risk of a larger GBP turn lower.
GOLD (XAUUSD) Fundamentals (based on dailyfx article)
Fundamental Forecast for Gold: NeutralGold prices firmer on the week with the precious metal up 0.21% to trade at $1252 ahead of the New York close on Friday. The advance comes on heels of shift in the European Central Bank policy outlook and continued strength in the US labor markets. Despite this week’s advance however, bullion remains at risk for further losses heading into June trade with the technical outlook looking for a June low to buy into.
The ECB interest rate decision spurred a 1% rally in gold as the Governing Cancel took unprecedented steps to shore up the monetary union. In one swift move the central bank decided to cut interest rates, offered another 4-year Long-Term Refinancing Operation (LTRO) and unveiled plans to conduct unsterilized Securities Market Program (SMP) purchases moving forward. Gold rallied through a tight weekly opening range on the news before stalling just ahead of key resistance at $1260/70.
The release of the US May non-farm payrolls on Friday offered little clarity on the gold trade with prices nearly unchanged on the day despite broadly positive employment print. The US economy created 217K jobs last month keeping the headline unemployment print anchored at 6.3%. Consensus estimates were calling for a 215K print with and expected uptick in the unemployment rate.
Heading into next week, traders will be eyeing data out of the US with retail sales and the preliminary June University of Michigan confidence surveys on tap. Moreover, broader market sentiment may continue to play a greater role in driving gold price action amid the material shift in the global monetary policy outlook.
From a technical standpoint, gold remains vulnerable for further declines while below the $1260/70 key resistance range. Our base case scenario is to look for a new low to buy into heading deeper into June trade with immediate support targets eyed at $1236 and $1216/22. Bottom line: our focus will remain weighted to the downside sub $1260 with a break below the monthly opening range low at $1240 targeting subsequent support targets into mid/late June.
AUDUSD Fundamentals (based on dailyfx article)
Fundamental Forecast for Australian Dollar: BearishDomestically, the spotlight will be on May’s Employment data and a round of Chinese economic indicators. The former is expected to show hiring slowed, with the economy adding 10,000 jobs compared with the 14,000 increase in April. The jobless rate is expected to tick higher to 5.9 percent. Australian economic data has increasingly underperformed relative to expectations since mid-April, hinting economists are overestimating the economy’s performance and opening the door for downside surprises.
Meanwhile, Chinese news-flow has markedly improved over recent weeks, suggesting expected improvements in May’s trade, industrial production, retail sales and inflation figures may prove larger than what is implied by consensus forecasts. Taken together, this may reinforce the monetary policy standstill telegraphed in last week’s RBA rate decision, putting the onus on external factors to drive price action. On the macro front, Federal Reserve policy speculation remains in focus. As we’ve discussed previously, the fate of the FOMC’s effort to “taper” QE asset purchases with an eye to end the program this year – paving the way for interest rate hikes – has been a formative catalyst for the markets this year. Last week’s supportive ISM data set, upbeat Fed Beige Book survey and marginally better-than-expected expected US jobs report sets the stage for continued reduction of monthly asset purchases and increasingly unencumbered speculation about outright tightening to follow. The week ahead brings further evidence by way of May’s Retail Sales and PPI figures as well as June’s preliminary University of Michigan Consumer Confidence print. Improvements are expected on all fronts.
Furthermore, US economic data has looked increasingly rosier relative to forecasts over the past two months, meaning surprise risks are tilted to the upside. That stands to narrow the Aussie’s perceived future yield advantage in the minds of investors. Firming bets on US stimulus withdrawal may likewise drive broader risk aversion. Needless to say, all of this bodes ill for the currency.
The silver markets rose slightly during the course of the week, but are closing right at the $19 level. The real question then becomes whether or not we can continue to go higher, or are we starting to fall? Quite frankly, we will not feel comfortable with a long-term buy until we get clear of the $20 level, so we would be a bit cautious at this point. However, if we break to a fresh, new low, we could see selling down to the $15 level, and then ultimately the $13 level.
77-year-old trader: How I made a lot of money

Paul Glandorf rattles off stock ticker symbols the way most people talk about popular TV shows and music.At age 77, he is anything but a stereotypical Wall Street trader. He lives in Ohio and prefers casual "retiree clothing." (He put on a tie for this photo.) But his returns would make many top investors salivate.
He participated in an investing competition in 2013 where you had to buy five stocks on January 1 and hold them through the end of the year. His portfolio finished the year with a whopping 71% return.
Four of his picks -- LinkedIn, 3D Systems, Fidelity National and Valeant Pharmaceuticals -- did extremely well. Then there was Lululemon -- the yoga apparel retailer whose shares sank more than 20%.
Glandorf took second place in the contest. And he still grumbles about Lululemon.