Press review - page 177
You are missing trading opportunities:
- Free trading apps
- Over 8,000 signals for copying
- Economic news for exploring financial markets
Registration
Log in
You agree to website policy and terms of use
If you do not have an account, please register
if actual > forecast = good for currency (for AUD in our case)
[AUD - Employment Change] = Change in the number of employed people during the previous month. Job creation is an important leading indicator of consumer spending, which accounts for a majority of overall economic activity.
==========
Australia Unemployment Rate Stable In May
The unemployment rate Australia remained stable for the third consecutive month in May, a report from the Australian Bureau Of Statistics showed Thursday.
The unemployment rate came in at 5.8 percent in May, the same rate as in April and March. Compared to a year ago, the unemployment rate rose 0.3 percentage points in May.
The number of unemployed people rose by 3,200 over the month to 717,100 in May. Out of the total, the number of unemployed looking for full-time work rose 9,000 to 529,700 and for part-time it decreased 5,900 to 187,400.
The number of employed people fell 4,800 over the month to 11,564,600. The number of full-time employees rose 22,200 while number of part-time employees fell 27,000 in May.
However, the participation rate fell to 64.6 in May from 64.7 in April.
Top Trade Idea For June 12th, 2014 – NZDUSD
In light of the recent RBNZ interest rate decision and looking at how the kiwi pairs reacted to the rate hike down under, I would like to focus on the nzdusd today and to made a case about why the pair is not going to stop anywhere around these levels and why it should attack the all important 0.90 area.
Yes, I know we are only in the 0.8650 and recent highs are still holding but the pattern above on the daily chart is a contracting triangle that broke higher somewhere in February this year, price made an impulsive move, or a five waves structure if you want for wave 1 pink in the chart above and then for the second wave it made a complex correction, namely a double running flat.
The second flat pattern there kissed the broken now b-d trend line, like a good bye kiss, and then price exploded.
But the info above is only one side of the bullishness on the pair. The bigger degree triangle you are seeing there has a measured move, the so called thrust of a triangle and this one points minimum to, well, 0.8872 to come.
The 0.8950 target is given by the fact that the double three running pattern on the bigger degree charts is always being followed by a third wave extension, and it means now we are looking for a 3rd wave pink that should be bigger than 161.8% when compared with the value of wave 1 pink. Minimum.
That gives us 0.8938 for the extension and I will book profits in that area, up to 0.8950. Why? Well, we want to avoid the classical behavior markets make around psychological level (check recent failures eurusd and gbpusd did at almost 1.40 and 1.70).
And all this should happened while price stays above the blue line in the chart above, as piercing that line will invalidate the whole pattern.
China's Forex Reserve Returns 'Relatively Good'
China's returns on its huge pile of foreign-exchange reserves are "relatively good" and the nation has been diversifying its assets in the past few years, officials at the foreign-exchange regulator said Thursday.
They also said in an online interview that the buildup of foreign-exchange reserves, now the world's largest at $3.95 trillion, will gradually ease as the nation's current account position becomes more balanced.
China has been diversifying its foreign-exchange reserves in the past few years and the reserves are "very diversified" in terms of currencies and types of assets, said Huang Guobo, chief economist of the State Administration of Foreign Exchange.
Mr. Huang said assets had been growing steadily and returns on investment were relatively good in the past few years—including last year. He didn't elaborate. He said the priority for China in the management of its foreign-exchange reserves was to maintain adequate liquidity. But he noted that ample liquidity on investments often means lower returns.
"We need to make longer term and more diversified investments from our foreign-exchange reserves while maintaining our fundamental goal of assuring adequate liquidity," Mr. Huang said without specifying further.
He also said that China needs to keep its reserves at a "reasonable level" though he didn't specify how much would be considered reasonable.
The nation's foreign-exchange reserves reached $3.95 trillion at the end of March, a big rise from $3.82 trillion at the end of 2013, official data released in April showed. That reflected a continued trade surplus as well as steady inflows of capital.
A rise in capital inflows and foreign direct investment last year has forced China's central bank to buy foreign currency, partly in a move to stop the yuan from appreciating.
Guan Tao, head of the international balance-of-payments department at the State Administration of Foreign Exchange, said in the same online interview that the yuan would show two-way movement on foreign-exchange markets instead of a steady appreciation as in previous years.
He said this would contribute to a gradual easing of China's accumulation of foreign-exchange reserves.
The officials also said that the foreign-exchange regulator would strengthen its monitoring of cross-border capital flows and prevent potential risk from huge swings in cross-border capital movements. The regulator will also continue its efforts to improve the yuan's exchange-rate mechanism, making it more market-based, they said.
2014-06-12 12:30 GMT (or 14:30 MQ MT5 time) | [USD - Retail Sales]
---
U.S. Retail Sales in May Grow Slower than Estimated
The US Commerce Department reported on Thursday that retail sales in May rose 0.3 percent, much lower than analysts’ estimate of 0.6 percent gain and April’s revised 0.5 percent growth.
“The continued gains during the first two months of the second quarter suggests that consumers are continuing to hold their side of the bargain, building on the strong momentum at the end of the last quarter,” Millan Mulraine, a New York-based deputy chief economist at TD Securities, told Reuters.
Separately, the Labor Department announced that initial applications for unemployment insurance rose 4,000 to 317,000 in the week through June 7. Nonetheless, recent data shows that the US labor market continues to improve steadily.
Employers in the country absorbed 217,000 new workers in May, marking the fourth straight month that the figure has stayed above 200,000. This has seen all the 8.7 million jobs that were shed in the financial recession recouped back.
Most analysts expect the economic growth in the second quarter to range from 3 percent to 4 percent, riding on the back of the resurgent services and manufacturing sectors. The economy posted a 1 percent decline in the first quarter owing to the harsh winter weather.
Another data released by the Commerce Department on Wednesday showed that business inventories grew the most in the six months through April.
The core retail sales, which are adjusted for food, gasoline, automobiles and building materials, remained unchanged in May. The figures in April were readjusted to show an increase of 0.2 percent as opposed to the earlier estimate of a 0.1 percent decline.
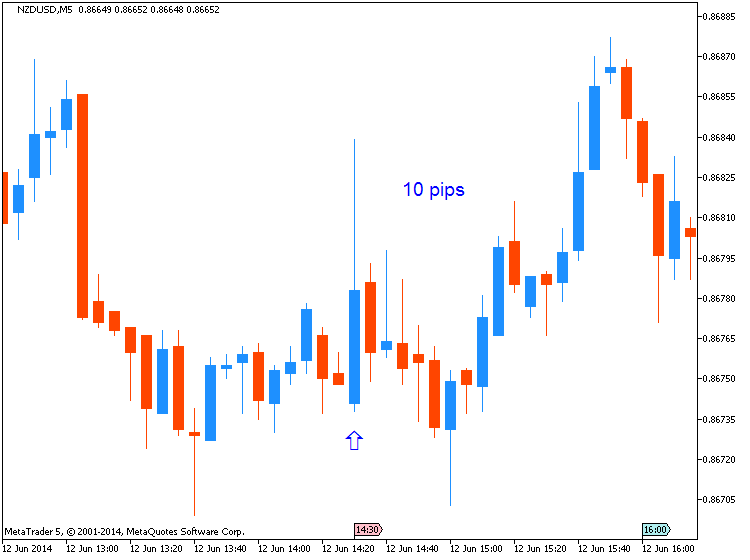
Trading the News: U. of Michigan Confidence (based on dailyfx article)
A rebound in the U. of Michigan Confidence survey may generate a further decline in the EUR/USD as it raises the fundamental outlook for the U.S. economy.
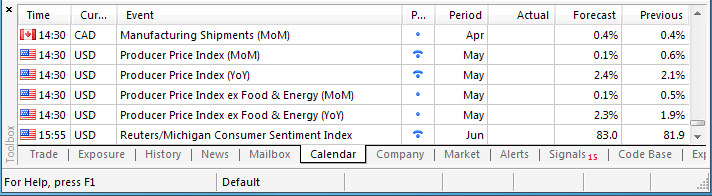
What’s Expected:
Why Is This Event Important:
Indeed, a further improvement in household sentiment may spur a greater dissent within the Federal Open Market Committee (FOMC), and the Fed may show a greater willingness to normalize monetary policy sooner rather than later as the central bank hawks see a faster recovery in the second-half of 2014.
The ongoing pickup in employment paired with the uptick in wage growth may generate a marked rebound in consumer confidence, and a positive print may spur a bullish reaction in the USD as it raises the outlook for growth and inflation.
However, we may see another unexpected downtick in the confidence survey as household face sticky prices, and a dismal U. of Michigan print may dampen the appeal of the greenback as it drags on interest rate expectations.
How To Trade This Event Risk
Bullish USD Trade: U. of Michigan Survey Climbs to 83.0 or Higher
- Need to see red, five-minute candle following the release to consider a short trade on EURUSD
- If market reaction favors a long dollar trade, sell EURUSD with two separate position
- Set stop at the near-by swing high/reasonable distance from entry; look for at least 1:1 risk-to-reward
- Move stop to entry on remaining position once initial target is hit; set reasonable limit
Bearish USD Trade: Household Sentiment Continues to Deteriorate- Need green, five-minute candle to favor a long EURUSD trade
- Implement same setup as the bullish dollar trade, just in the opposite direction
Potential Price Targets For The ReleaseEUR/USD Daily
Impact that the U. of Michigan Confidence has had on EUR/USD during the last release
(1 Hour post event )
(End of Day post event)
2014
May 2014 U. of Michigan Confidence Survey
USDJPY M5 : 15 pips price movement by USD - UoM Consumer Sentiment news event
The U. of Michigan Confidence survey unexpectedly weakened in May, with the index slipping to 81.8 from 84.1 the month prior. Despite the weaker-than-expected print, the EUR/USD struggled to hold above the 1.3700 handle, with the pair closing the day at 1.3692.
AUD/USD: Moves to Two Month High Around 0.9425
After spending a couple of weeks at the end of May trading near and finding support at 0.9220, the Australian dollar has enjoyed a solid surge over over the last couple of weeks. It has not only moved through the key 0.93 level but moved to a resistance level around 0.9425 and in doing so achieved a two month high. The 0.9220 level has repeatedly reinforced its significance as it is again likely to support price should the Australia dollar retreat. Only a month ago the Australian dollar was placing pressure on the resistance level at 0.94 when it was able to poke through for a short period and reach a four week high in the process, however in the last 24 hours it has surpassed those levels and achieved the two week high.
Throughout April and into May the Australian dollar drifted lower from resistance just below 0.95 after reaching a six month high in that area and down to the recent key level at 0.93 before falling lower. During this period the 0.93 level has become very significant as it has provided stiff resistance for some time. The Australian dollar appeared to be well settled around 0.93 which has illustrated the strong resurgence it has experienced throughout this year. For the best part of February and March, the Australian dollar did very little other than continue to trade around the 0.90 level, although at the beginning of March it crept a little lower down to a three week low below 0.89. Towards the end of March however, the Australian dollar surged higher strongly moving to the resistance level at 0.93 before consolidating for a week or so.
For several months either side of the New Year, the Australian dollar established and traded within a narrow range roughly between 0.88 and the previous resistance level at 0.90. Back in January, the Australian dollar was able to rally higher pushing through the resistance at 0.90 to a one month high near 0.91, however it quickly returned to more familiar territory below the resistance levels at 0.90 and 0.88. After showing some resilience in early December moving to a one week high above 0.9150, the AUD/USD spent the next two weeks turning around sharply and falling heavily down to a then three month low close to 0.88.
Australia’s unemployment rate was steady at 5.8 per cent in May, official figures show. The total number of people with jobs fell 4,800 to 11.565 million in May, according to seasonally adjusted figures from the Australian Bureau of Statistics on Thursday. The unemployment rate was expected to reach 5.9 per cent in May, with 10,000 jobs added to the economy, according to an AAP survey of 13 economists. Full-time employment rose 22,200 to 8.068 million in May and part-time employment was down 27,000 to 3.496 million. The participation rate — those who have a job, are looking for work or are ready to start work — fell to 64.6 per cent, from 64.7 per cent in April.
AUD/USD TechnicalDuring the early hours of the Asian trading session on Friday, the AUD/USD is remaining steady around the recent resistance level around 0.9425 after surging higher from around 0.9370 over the last 24 hours. The Australian dollar was in a free-fall for a lot of last year falling close to 20 cents and it has done very well to recover slightly to well above 0.90 again. Current range: trading right around 0.9425.
The dollar and the euro were on the back foot in the past week. The focus is now on the Fed decision and the UK inflation data. In addition, the Philly Fed Manufacturing Index and inflation figures will be of interest. Here are the main events on our FX calendar. Here is an outlook on the market-movers for the coming week. A jump in US job openings underpinned the US dollar. While this figure is lagging, it closely watched by the Federal Reserve. However, other figures from the US, such as retail sales, were mediocre. The UK enjoyed encouraging employment figures that lift the prospects of an early rate hike, and Carney indeed explicitly said that a rate hike make come sooner than later, sending the pound jumping up.. In Europe, the lower bond yields and the implementation of the negative deposit rate weighed on the common currency. Another currency that stood out is the kiwi that leaped up: the RBNZ hiked the rate and did not signal a pause.
Threats, Markets, Iraq And Oil
Global threats are nothing new to markets, but the impact they can have is incredible. Commodity prices can jump quickly, and volatility can drive markets to the point of collapse; as we saw in the global financial crisis. These days, though, threats seem to be few and far between when it comes to markets.
However, one of the largest threats to the markets has appeared this year, in the form of the ISIS in Iraq. Normally I try and avoid threats to markets and the impact they may have - or just include a sentence of two – but in this case I feel it is actually a serious threat to oil markets.
Currently Iraq is going through the process of 'turning on the taps', or basically getting its oil production back into full swing, after a deadly war, followed by civil unrest. So far so good, and things are starting to happen in Iraq, which has the world’s fifth-largest proven oil reserves.
But the wheels are starting to come unstuck in Iraq and oil production may be severely affected as a result. The ISIS an offshoot of Al-Qaeda and is looking very deadly; they are not led by an ideologist per say, but instead a seasoned battle commander. Hence why they so far have been extremely successful in their ability to move across Iraq and conquer various cities.
In addition to having a heavily armed force, they are not just a terrorist organisation. They act like a state, setting up courts and schools and providing services for the regions that they control. This is not just a side bent on terror, this is an organisation hell bent on conquering the northern part of Iraq and taking vengeance on the current government.
Chances of success when it comes to conquering Baghdad may seem slim, but many have failed to realize the capabilities that they have. After the capitulation in Mosgul, they acquired ammunition and weapons from the escaping army. They are as a result of this now more heavily armed than ever; and in addition to this to they have captured the equivalent ofUS$400 million from the central bank in Mosgul to give them the capital of a small country now.
An escalation in Iraq now seems inevitable, and regional powers are about to get sucked in whether they like it or not. The Kurds are holding their own province in the north, but many see this as a short term move. Long term we could see an Iraq divided by religious grounds, with a north and south much like in the case of Sudan.
This massive build-up of tension will make Ukraine seem like a small problem as Iraq holds a massive oil wealth and sits in one of the world’s most volatile regions. It’s easy to just look at Iraq, but you need to take a look at the bigger picture, and that includes its neighbours like Saudi Arabia, Kuwait, Iran, Syria and Turkey. Many of these neighbours have large reserves of oil and gas and violence can easily spill over borders which are separated by deserts and not by large geographical features.
I had honestly been expecting a small dip down to the trend line, but the recent escalation of tensions in Iraq will have a major impact. American involvement in Iraq again will also play a big role in oil markets getting even more uneasy, as it’s a sign that things really have hit rock bottom again in Iraq as it cannot control the current insurgency.
The last candle was very aggressive in terms of climbing higher.
And with the escalation likely to hit critical points in the next 24 hours, expect to see major climbs in the chart with a target of 110, as that is the heaviest point of resistance.
With the current US stance to not act, any relief may come too late to help any assault on Baghdad, what is clear though is that the oil markets have not priced themselves into a civil war in Iraq, especially one that will destabilise all oil production in the volatile region and have an effect on global prices. ISIS is hell bent on exacting revenge on the current Iraqi government and an attack for them would be coming full circle in their campaign - Oil prices will be quick to react to such aggression!
Unlucky Friday The 13th? U.S. Stocks End Up For The Day But Down For The Week
With a full moon and a Friday the 13th capping a week of election surprises at home — like Eric Cantor’s shocking primary loss in Virginia’s 7th Congressional district — and unrest in Iraq, investors would have been excused for acting skittish in Friday trading. But instead, they sent the U.S. equity markets for a daily gain on Friday, leading all three major indices finishing the day in positive territory. Unfortunately, the late-in-week gains weren’t enough to offset losses from earlier in the week, with the Dow, Nasdaq and S&P 500 ending the week in the red.
The Dow closed Friday up 41.55 points, or 0.25%, as the Nasdaq finished up 13 points, or 0.3%, and the S&P closed 6 points, or 0.3%, higher for the day. All three indices traded in positive territory for the majority of the day on Friday, a bit of a surprise given the unrest in Iraq, which has seen Sunni militants seize broad swaths of Iraqi territory — territory that includes much of the country’s oil fields. This, in turn, has sent oil prices to their highest levels this year: Brent crude futures hit $114 a barrel before settling at $113.50 and oil futures went as high as $107 a barrel before eventually settling around $106. Compare this to their Monday prices: Brent crude opened the week closer to $108 a barrel and oil started Monday trading around $103.
While these price jumps would have caused market jitters and consumer panic 10 years ago, John Canally, an investment strategist with LPL Financial, said that progress the U.S. has made with energy independence means that oil at $107 a barrel won’t threaten the country’s economic recovery — and that this, in turn, explains why stocks were in the green for much of Friday trading.
“These days, even versus 2005, we’re using less gasoline. We’re doing a better job in conserving it that way,” Canally said in a phone interview. “We’re still well below the level where it begins to pinch growth,” he added, noting that investors can start to worry if oil prices start pushing $130, $140 and certainly $150 a barrel. Also, he added, oil prices normally rise in the summer — peaking around the Fourth of July, typically — so a small part of oil’s increase can be attributed to that.
“You have to remember we just went through geopolitical unrest in Ukraine – and that sort of fizzled. Right on the heels of that, we have the issue with Iraq, and the market gets used to these things,” Canally said, explaining the market’s relatively muted response to the popping oil prices. They really reacted on Thursday, he noted, but Friday’s action was, in his view, typical Friday trading behavior. “And quite frankly a lot of people are sitting in front of their computers watching the World Cup,” he laughed.
Canally also noted that the relatively positive performance for equities on a day with a full moon and superstitious date — Friday the 13th — might be a surprise to some, but is consistent with prior Friday the 13th’s.
“In general, Friday the 13th has been up. There have been 186 Friday the 13ths since 1901, and 110 finished up, the rest down,” Canally said. “Friday the 13th’s are better than the average day. And if you look at Friday the 13th in June, 12 of 15 since 1901 have been up. In that regard, the fact that we’re having an up day today makes sense.”
While stocks finished in the green on Friday, the gains were not enough to offset losses from earlier in the week — some of which market insiders attributed to Cantor’s loss on Tuesday, some of which can be attributed to Iraqi tensions that escalated on Thursday. The S&P finished the week down 0.74%, the Dow closed the week with an 0.9% loss and the Nasdaq closed the week down 0.33%. For the Dow and S&P, the losses marked the first weekly losses in four weeks for the indices.
On a stock-by-stock level, two of the market’s biggest gainers were OpenTable, which earlier on Friday announced that it will be acquired by Priceline for $2.6 billion, and retailer Express, which sparked investor interest after a private equity firm, Sycamore Partners, disclosed a near-10% stake in the company. OpenTable finished the day over $104 per share, a 48% surge, and Express finished over $16 per share, a 21% gain.
GBPUSD Fundamentals (based on dailyfx article)
Fundamental Forecast for Pound: BullishThe GBP/USD rallied to a fresh monthly high of 1.6990 as Bank of England (BoE) Governor Mark Carney showed a greater willingness to normalize monetary sooner rather than later, and the pound-dollar may continue to carve a series of higher-highs & higher-lows during the summer months amid the ongoing shift in the policy outlook.
Nevertheless, the data prints due out next week may generate a minor setback in the British Pound rally as the U.K. Consumer Price Index (CPI) is expected to narrow to an annualized 1.7% in May, but the BoE policy statement may heighten the bullish sentiment surrounding the sterling should the central bank adopt a more hawkish tone for monetary policy.
Indeed, the BoE Minutes may reveal a growing dissent within the Monetary Policy Committee (MPC) as a greater number of central bank officials turn increasingly upbeat on the U.K. economy, and the policy statement may spur a more meaningful pickup in interest rate expectations should the committee lay out a more detailed exit strategy. With that said, a split BoE decision may serve as the fundamental catalyst to trigger another near-term rally in the GBP/USD, and we will maintain a bullish outlook for the pair as the Federal Reserve remains reluctant to move away from its zero-interest rate policy (ZIRP).
As a result, the GBP/USD looks poised for a higher-high as it carves higher-lows in June, and we will look for opportunities to ‘buy dips’ in the pound-dollar as the Relative Strength Index (RSI) breaks out of the bearish momentum carried over from the previous month.