Press review - page 84
You are missing trading opportunities:
- Free trading apps
- Over 8,000 signals for copying
- Economic news for exploring financial markets
Registration
Log in
You agree to website policy and terms of use
If you do not have an account, please register
EUR/USD weekly outlook: February 3 - 7 (based on investing.com article)
The dollar rose to 10-week highs against the euro on Friday as a slowdown in the annual rate of euro zone inflation in January fuelled fears over the threat of deflation in the euro area.
Monday, February 3
Tuesday, February 4
Wednesday, February 5
Thursday, February 6
Friday, February 7
GBP/USD weekly outlook: February 3 - 7 (based on investing.com article)
The pound ended the week lower against the broadly stronger dollar on Friday as indications that the U.S. recovery is gaining momentum and increased risk aversion underpinned dollar demand.
Monday, February 3Tuesday, February 4
Wednesday, February 5
Thursday, February 6
Friday, February 7
Gold Prices Start The Week Soft As Chinese Celebrate Year Of The Horse (based on kitco article)
Gold prices could struggle during a relatively quiet Asian session as Chinese markets are closed in recognition of the new year, said analysts.
In electronic trading, Comex April gold futures opened Sunday evening at $1,242 an ounce, a gap lower from Friday’s electronic closing price of $1,245.60 per ounce. Prices have managed to rally from the weak open and as of 6:47 p.m. EST, April gold is at $1243.40 an ounce.
Analysts at ANZ Bank in Australia said that although Chinese markets are closed for the next week, they are expecting physical demand to remain low for at least two weeks and as a result are forecasting lower prices.
“With the Chinese absent, the market is likely to struggle to hold rallies,” they said in a research note.
2013-02-03 00:30 GMT (or 01:30 MQ MT5 time) | [AUD - Building Approvals]
if actual > forecast = good for currency (for AUD in our case)
==========
Australia Building Approvals Dip 2.9% In December
The total number of building permits issued in Australia in December was down a seasonally adjusted 2.9 percent on month in December, the Australian Bureau of Statistics said on Monday, standing at 16,141 and falling for the third straight month.
That missed forecasts for a contraction of 0.5 percent following the 1.5 percent decline in November.
On a yearly basis, building permits spiked 21.8 percent - also shy of estimates for an increase of 23.4 percent and down from the 22.2 percent surge in the previous month.
Stock Market Support Is Fragile - 2 Indicators And 2 Strategies For Success If 2nd Shoe Falls (adapted from forbes article)
Indicator #1 – The headlines
Here are the many media descriptions of last week’s and January’s market performance: Stumble, tumble, decline, fall, drop, sink, sell-off, slip and slide. Notice what’s missing: “Dip.” The market is now beyond that shallow move. On the other hand, except in the eyes of a few, the more severe descriptors are missing – like dive, plunge and crash.
Indicator #2 – The 50-day and 200-day simple moving averages (SMAs)
In 2013 and so far in 2014, most stocks and the stock market have tracked the 50-day SMA.
Investment strategy #1 – Don’t act too early
To accomplish the goal of buying low, wait until both indicators show worry has ramped up to the level of questioning stocks’ desirability. If stocks drop anew, the sense likely will be that something is amiss – not that we are simply having a normal shakeout following an exceptionally fine period.
Investment strategy #2 – Act quickly
When stocks or the market run into fundamental problems, quick bounce backs seldom follow price drops. Instead, it takes time for the future outlook to brighten before stock buying picks up. However, a drop in a bull market, growth period can have a bounce back because the price fall is investor-driven, and that can be reversed quickly.
2013-02-03 08:15 GMT (or 09:15 MQ MT5 time) | [EUR - Spanish Manufacturing PMI]
if actual > forecast = good for currency (for EUR in our case)
==========
Spanish Manufacturing Expands On Production, Orders
The Spanish manufacturing sector started 2014 on a positive footing, Markit Economics said Monday.
The seasonally adjusted Markit Purchasing Managers' Index rose to 52.2 in January from 50.8 in December. Moreover, the improvement in operating conditions in January was the strongest since April 2010.
The rate of growth in manufacturing output accelerated in January and was the fastest in close to three-and-a-half years. Total new business also grew at a sharper pace, with some panellists highlighting the impact of rising new export orders.
Gold price 'to average $1,220 in 2014'
Some analysts expect price to fall below $1,000, while others are much more bullishThe gold price will average $1,219 an ounce this year, according to a survey of analysts.
The analysts expect the gold price to range between $1,067 and $1,379 this year, a report compiled by the London Bullion Market Association (LBMA) found.
Yesterday's gold price according to the LBMA's afternoon London "fixing" was $1,248.
Gold ended 2013 at $1,202, 28pc lower than at the beginning of the year, bringing to an end 12 consecutive years of price growth.
The most optimistic prediction for the gold price this year came from Martin Murenbeeld of Dundee Capital Markets in Canada, who said the price could go as high as $1,550, although he put the bottom of its possible price range at just $1,075.
2013-02-03 09:30 GMT (or 10:30 MQ MT5 time) | [GBP - Manufacturing PMI]
if actual > forecast = good for currency (for GBP in our case)
==========
UK manufacturing PMI grows for tenth consecutive month
UK manufacturing grew for a tenth consecutive month in January according to the latest PMI figures, with new orders and employment also rising.
Markit’s UK Manufacturing Purchasing Managers’ Index (PMI), a survey compiled of more than 600 industrial companies, slid to 56.7 in January from December’s 57.2.
Despite the UK’s PMI hitting a three-month low, it was comfortably above the survey’s long-run average of 51.3, suggesting a strong start for the economy in the first quarter of 2014.
“Although the pace of output expansion has cooled slightly in recent months, growth is still tracking at one of the highest rates in the 22-year survey history,” said Rob Dobson, senior economist at PMI compiler Markit.
I never know about this fundamental indicator ... so -
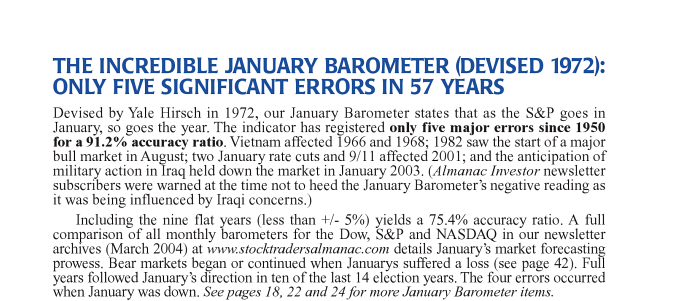
January barometer - (from wikipedia) : "The January barometer is the hypothesis that stock market performance in January (particularly in the U.S.) predicts its performance for the rest of the year. So if the stock market rises in January, it is likely to continue to rise by the end of December. The January barometer was first mentioned by Yale Hirsch in 1972"
This is the page #16 of 2008 edition of this book (Stock Trader's Almanac 2008) :
This is January so ...
2013-02-03 15:00 GMT (or 16:00 MQ MT5 time) | [USD - ISM Manufacturing PMI]
if actual > forecast = good for currency (for USD in our case)
==========
U.S. Manufacturing Index Indicates Notably Slower Growth In January
While the Institute for Supply Management released a report on Monday showing modest growth in U.S. manufacturing activity in the month of January, the pace of growth slowed much more than economists had been anticipating.
The ISM said its purchasing managers index fell to 51.3 in January from a revised 56.5 in December. A reading above 50 indicates continued growth in the manufacturing sector, but economists had expected the index to show a much more modest decrease to a reading of 56.0.
With the much steeper than expected decrease, the purchasing managers index fell to its lowest level since hitting 50.0 in May of 2013.